HAL Id: hal-01999298
https://hal.archives-ouvertes.fr/hal-01999298
Submitted on 30 Jan 2019
HAL is a multi-disciplinary open access
archive for the deposit and dissemination of
sci-entific research documents, whether they are
pub-lished or not. The documents may come from
teaching and research institutions in France or
abroad, or from public or private research centers.
L’archive ouverte pluridisciplinaire HAL, est
destinée au dépôt et à la diffusion de documents
scientifiques de niveau recherche, publiés ou non,
émanant des établissements d’enseignement et de
recherche français ou étrangers, des laboratoires
publics ou privés.
Effects of the fundamental oxide properties on the
electric field-flash temperature during flash sintering
Rachman Chaim, Claude Estournès
To cite this version:
Rachman Chaim, Claude Estournès. Effects of the fundamental oxide properties on the electric
field-flash temperature during flash sintering. Scripta Materialia, Elsevier, 2019, 163, pp.130-132.
�10.1016/j.scriptamat.2019.01.018�. �hal-01999298�
OATAO is an open access repository that collects the work of Toulouse
researchers and makes it freely available over the web where possible
Any correspondence concerning this service should be sent
to the repository administrator:
tech-oatao@listes-diff.inp-toulouse.fr
This is an author’s version published in:
http://oatao.univ-toulouse.fr/21694
To cite this version:
Chaim, Rachman and Estournès, Claude
Effects of the fundamental oxide
properties on the electric field-flash temperature during flash sintering. (2019)
Scripta Materialia, 163. 130-132. ISSN 1359-6462
Effects of the fundamental oxide properties on the electric field-flash
temperature during flash sintering
Rachman Chaim
a
,
*
, Claude Estournès
b• Department of Materials Sdence and Engineering, Technion - Israel Institute ofTechnology, Haifa 32000, Israel
b Université de Toulouse, CJRIMAT, CNRS INPT UPS, Université Paul-Sabatier, 118 route de Narbonne, F-31062 Toulouse cedex 9, France
ARTICLE INFO ABSTRACT
Keywords: Flash sintering Joule heating Oxides Crystal-type Ionie potential
Flash sintering of mtide powders is associated with dissipated power in the narrow range 10-50 W • cm-3 irre spective of their composition. By analysis and normalization of the experimental results from literature to con stant parti de size ( 100 nm) and applied electric field ( 500 V cm-1 ), we show that the relative flash sin te ring temperature is dictated by the oxide crystal-type and its cation ionic potential resulting from its chemical com position. The expected flash onset temperature increases with the increase in fusion enthalpy and confirm the formation of liquid at the particle contacts as a mechanism for the powder densification.
Flash sintering (FS) is a nove) sintering method by which a simulta neous application of critical electric field and temperature Ieads to ultra fast densification of ceramic powder compacts within seconds. The process is often accompanied by a flash event hence termed flash sintering. The sudden increase in the electrical conductivity at the flash onset temperature leads to local Joule heating at the particle con tacts. The different aspects of the powder characteristics and the process parameters were investigated during FS and different atomistic mecha nisms, either in solid-state (1,2] or liquid-assisted [3], were proposed for the ultrafast densification. Nevertheless, the relation between the criti cal electric field and its flash temperature to the basic properties of the ceramic is still unknown. Compilation of flash sintering data of different oxides by Raj [4] revealed that the dissipated power at the flash event extends over a narrow range, 10-50 W•cm-3• Raj and others showed that this power range is independent of the heating rate, the applied electric field [5], the specimen volume [6], and the powder particle size [7]. This narrow range of dissipated power in oxides with different chemical compositions and powder characteristics, may point to similar mechanisms activated at the flash onset conditions; consequently, some basic properties of the oxide should define its relative electric field-flash onset temperature.
In the present analysis, we follow our previous mode) (3,8) where the flash and the simultaneous abrupt increase in the electrical conduc tivity were related to the current percolation through the softened/ melted parti de contacts. Irrespective of the densification mechanism,
• Corresponding author.
E-mail addresses: rchaim@technion.ac.il (R Chaim), estourne@chimie.ups-tlse.fr
(C. Estournès).
https://doi.org/10.1016/j.scriptamat2019.0l.0l 8
there is a common agreement that certain amount of power is needed to initiate the flash event. This arises from the current percolation threshold that necessitates softening/melting of critical volume fraction of the oxide at the parti de contacts. The existence of the incubation time (9), where specimens with higher electric resistance ( dises with identi cal diameters and increasing heights) exhibited shorter incubation times to the flash event at the isothermal conditions [7], confirms this trend. Therefore, as soon as the critical power for softening/melting of the particle contact is attained, the corresponding temperature acts as the flash temperature. Consequently, the relative flash temperature of a given oxide among ail oxides should be dictated by its basic properties that define its crystal stability, i.e. fusion entropy, crystal structure, ionic potential, etc.
We used the data compiled by Raj [4] on different oxides flash sintered in air, in addition to oxides from other sources [10-24). A few single data points were also included [10,14,15,19], and the appropriate oxide was underlined in Table I (see Supplement). We used and plotted these experimental FS data, where several different electric field - flash temperature combinations were available, as shown in Fig. 1. Ali these data were acquired in the same atmosphere (air), but vary in the heating rate, the range of the applied fields, as well as the flash temper atures and the original particle size. These plots often show linear to shallow hyperbolic relations between the flash temperature and the ap plied field on the semi-logarithmic scale (Fig. 1 ). ln order to compare the flash sintering temperature data in Fig. 1, one should normalize the data with respect to the heating rate, particle size and the applied electric field.
It was shown that changing the heating rate from 2 to 20
•c •
min-1 during FS of Al2O3/3YSZ composite yielded flash temperatures in thenarrow temperature range, i.e. lff
=
42 °C, between 1165 °C to 1207 °C (4). Therefore, we neglected the effect of the different heating rates among the various oxide candidates used for comparison in Table I ( see Supplement). Nevertheless, we considered the effect of the particle size via the particle contact, and its electric resistance contribution to the overall specimen resistance (7). Recently, a numerical mode) was developed to express the particle size effect on the flash sintering tem perature associated with the particle contact resistance using 3YSZ (ZrO2 stabilized with 3 mol% Y2O3 and exhibits tetragonal symmetry)as a mode) system (25). The flash sintering temperature rapidly in creased with the particle radius in the nanometer range, but tended to saturation at the micrometer particle size (Fig. 6 in ref. [251). With re spect to the previous model, we used the particle size of 100 nm sub jected to electric field of 500 V•cm-1 as a reference for comparing the
flash sintering temperatures of the different oxides.
First, we selected flash temperatures of oxides that correspond to the applied field of 500 V• cm-1, or the closest to this value. These tem peratures were denoted as Trin Table I (see Supplement). Second, we used the theoretical calculations of the particle size effect [25), and nor malized the flash temperatures T r of each oxide for 100 nm particle size (Fig. 6 in ref. 25, where 3YSZ with 100 nm particle size acts as a stan dard). This resulted in new flash sintering temperatures, denoted Tn in Table I (see Supplement). Further, we assumed that the new esti mated electric field-flash temperature curve, for a given oxide with 100 nm particles, will be parallel to its experimental curve and include Tn. Finally, using this estimated curve, we selected the new flash tem perature Trz at the electric field of 500 V •cm-1 (as Iisted in Table I in
Supplement).
We plotted the resulting flash sintering temperatures normalized for the particle size of 100 nm and applied field of 500 V• cm-1 versus oxide
melting points in Fig. 2. Despite the limited data in Fig. 2, one can find some proximity between the data of groups of oxides with common crystal structure and composition stoichiometry. In this diagram, Ce0.8Gd0.2O1.9, 8YSZ and 3YSZ resemble the CaF2 crystal-type, where
SnO2 and TiO2 resemble the Rutile crystal-type, and PbZrTiO3, BaTiO3,
SrîiO3 and KNbO3 belong to the Perovskite crystal-type. Furthermore,
MgTiO3 and A)zO3 resemble similar crystal structures with some varia
tions in ion occupancies. MgTiO3 follow the Ilmenite crystal-type,
which is a substitutional derivative of corundum (Al2O3) crystal-type,
where the Mg and Ti fill the alternate basal plans. The connecting solid lines between the different oxides in Fig. 2 used only to highlight their crystal relations. Based on Fig. 2 it is clear that there is no direct re lation between the flash temperatures to the melting points of the ox ides. Nevertheless, the relative flash temperature depends on the
ü 'L. !!? 1000 (1.) ()_ E (1.) f- 500 ..c: (j} ro ü: TiO -Rutile smo, �gTiO 2
'
<
3Y �-tel c •••.. Y,o, � -• •• \, ' ... �--,, 4. '•... ·. Ce Gd O a.a 0.2 t.so \�··.' , ... C.·
Q-,
_.
�·
"--
t
.•...
·•. •J 'O' -�- 'D c... MnCo204 'C.,j '-· -c \ •. •·•• �(\ ··,v ··•. Al 0 l_\ � �-.... l_ ��/'-.;.--� l J li•'V--:�
.
....
-
�.'::r .. '.:;--"·�---�"" '"i! ,.- ''\< " BaTiO Ce Gd O os o , , '"' ZnO PZT 'v·�--C. -.c� .. ' :J 8YSZ-cubic O ���-�-���L�( "'•�•�S'�••�)(_C_o0_2�Fe_0�)0_0�3 ���-�� 10 100 Electric Field [V/cm] 1000Fig. 1. Experimental flash temperature-electric field relations in different oxides: Al,O3
[1], BaTiO, [10], Ceo_9Gdo.1Ü1.9s [l l,t2], Ceo.sGdo.2O1.90 [13], (Lao.eSro.4) (Coo.2Feo.sl O,
[12], MgTiO3 [16], MnCo2O4 [17], Pb(Zr052Ti0.48) 03 - PZT [18), SrîiO3 [20], TiO2 [21 ],
Y2O3 [22], 3YSZ [23], 8YSZ [24], and ZnO [25].
C) 2800 2400 2000 1600 1200 8YSZ-cub - 1 J ..,,, �SZ-tet '~-...,_.., Y,O, Ceu,Gdu,0,, LJ 4.04 ZS 343 3.47 \ MnCo O
v
2, Srîi03 Al o°" 5.37 (J 2 'l:,,, ZnOv T,�,/- 4.48 / 4.82/!
i
!.35Sno,◊
.
I\
C BaT,O,
_:
MgTiO�
,l:,,,/
2.07 () __ ,.,../ PblrT1O ' 2.74 fi � 100 nm Particles KNbO 3 @500 Vern 1 800 ����������������� 0 200 400 600 800 1000 1200 1400 Flash Temperature, T12 [0C]Fig. 2. Melting point-flash temperature diagram of oxides normalized for the 100 nm particle size under the 500 V· cm-1 electric field. The numbers indicate the average ionic potential of the cations in the oxides. The lines used as guidelines only to highlight the oxides with similar crystal structure. The arrowed lines discussed in the text. oxide crystal-type and stoichiometry as clearly is visible in Fig. 2. In this respect, Y 203 is Iocated between 3YSZ ( tetragonal stabilized ZrO2
with distorted CaFz-type structure) and AbO3 (corundum). The Y2O3
with bixbyite BCC crystal structure is very close to 2 x 2 x 2 supercell of CaF2, where one fourth of the oxygens are vacant per unit lattice com
pared to CaF2 structure. Therefore, Y cations are six coordinated by the
oxygen anions, as is true for Al cations in A)zO3 as the next neighbor
to Y2O3• Moreover, Y2O3 transforms at 2308 °C to the CaF2 structure
prior to its melting (26). The interrelation between bixbyite Y2O3 to
the crystal-types of its neighbors, i.e. CaFz-type via Iattice symmetry and Corundum via composition stoichiometry, symbolized by the two double arrowed lines. Similarly, LiNbO3 (not treated in this paper)
adopts the Ilmenite-type structure similar to MgTiO3, however, the Li
and Nb are arranged in an ordered fashion within the basal plans of the pseudo-hexagonal lattice. Therefore, the Iarger K ion (0.152 nm) in KNbO3 (in Fig. 2), compared to the smaller Li ion (0.088 nm) in
LiNbO3, leads to the more stable perovskite-type structure than the
Ilmenite-type structure. Consequently, KNbO3 is also interrelated to
both Perovskite-type and Ilmenite-type crystals as symbolized by the double arrowed line. The proximity between crystal-type and composi tion stoichiometry within each group of oxides and between the groups resemble the 'structure-field maps' of Goldschmidt followed by Roy and Muller [27).
In addition, moving from the bottom right to the top Ieft of the dia gram, the electric character of the oxides changes from the insulating di electric, through the semiconducting ( electronic )/ferroelectric and to the ionic conductors. Nevertheless, we expect that the present distribu tion of the various oxides in Fig. 2 dictated by the crystal stability against the application of the electric field. Formation of Iiquid at the particle contacts [8) must be associated with crystal instability, with disconnec tion of the interionic bonds. An important measure of the ion bond sta bility in the crystal subjected to the electric field is its ionic potential (IP), i.e. the cation charge (in our treatment) divided by its radius. In this regard, one should refer to the appropriate cation charge and its ra dius, dictated, respectively, by the crystal stoichiometry and its coordi nation number in the oxide crystal structure. We calculated the cationic potential for each oxide using the Shannon ionic radii [28). The ionic potential for oxides with multiple cations was averaged over the IP of the different cations, considering their molar fractions in the oxide and taking into account the defect stoichiometry. We added the resulting ionic potentials near the oxide symbol in Fig. 2. Although the IP's vary in the narrow range, systematic increase in flash temperature with an increase in IP was observed for each crystal structure. Therefore, for an oxide with a given crystal-type, the average ionic potential seems
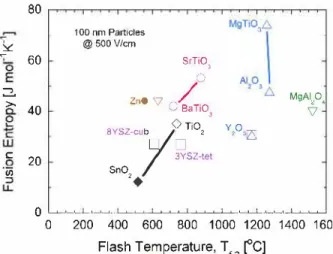
� � 3 >, C: ïii 80 60 40 20 100 nm Particles @SOOV/cm SrTiO,
,-,
ZnOV .,/ ..__, ,._,, BaTiO J BYSZ-cu y ◊Ti02L 7
3YSZ-tet SnO'o
v,o,izs MgAl,0, 'vo
��
�
��
�
�������
�����
�
0 200 400 600 800 1000 1200 1400 1600 Flash Temperature, Tr2 ['C]Fig. 3. Fusion entropy-flash temperature diagram of oxides normalized for the 100 nm particle size under the 500 V·cm-1 electric field. The lines used as guidelines only to highlight the oxides with similar crystal structure.
to be an appropriate fundamental material parameter that determines the relative flash temperature of the oxide.
Finally, we plotted the well-accepted fusion entropies of the flash sintered oxides, when available, versus the calculated flash tempera ture, T12 as shown in Fig. 3. The flash temperature increases systemati
cally with an increase in the fusion entropy, preserving the distribution pattern of the different crystal-types of oxides found in Fig. 2. The normalized flash temperature T 12 increases with increase in
the fusion entropy. Compositional variation of the oxide by means of substitutional ions expected to increase the configurational disorder hence increase the solid entropy [29). Consequently, smaller entropy change is expected during melting ( i.e. fusion entropy) hence a decrease in the flash sintering temperature. These substitutional ions and point defects are expected to decrease the lattice stability towards melting, compared to its single cation pure mode state. We calculated a signifi cant decrease of the flash temperature (T 12) down to room temperature,
for multi-component CaFz-type [13), Perovskite-type [12), and Spinel type [17) oxides (Table I - see Supplement). Flash at room temperature is not surprising by applying relatively high electric fields ( 500 V• cm-1) to the defective oxides.
These findings on the relations between the relative flash tempera ture of a given oxide and its crystal-type and average ionic potential (Fig. 2), as well as its fusion entropy (Fig. 3) are powerful tools for predicting the expected flash temperature of ail oxides. These findings strongly support the idea that flash onset temperature of the oxide dic tated by local fusion of the particle contacts at the flash event. In this
regard, as was noted by Barsoum [30) the fusion entropy per atom/ion vary in a very narrow range around -10 J mo1-1 K-1 regardless of the material composition, in agreement with the narrow range of the dissi pated power observed at the flash onset temperature.
ln summary, normalization of the flash sintering temperature data of various oxides to a reference condition of 100 nm particle size subjected to 500 V•cm-1 electric field revealed the primary task of the crystal structure, the ionic potential, and mainly the fusion entropy on the rel ative value of the flash temperature.
Supplementary data to this article can be found online at https:/ /doi. org/10.1016/j.scriptamat.2019.01.018.
References
[1] M. Cologna,J.S.C. Francis, R. Raj, J. Am. Ceram. Soc. 31 (2011) 2827-2837. (2) C. Schmerbauch, J. Gonzalez-Julian, R. Rtider, C. Ronning, O. Guillon, J. Am. Ceram.
Soc. 97 (2014) 1728-1735. (3) R. Chaim, Materials 10 (2017) 179.
(4) R. Raj,J. Am. Ceram. Soc. 99 (2016) 3226-3232.
(5) M. Cologna, B. Rashkova, R. Raj, J. Am. Ceram. Soc. 93 (2010) 3556-3559. (6) E. Bichaud,J.M. Chaix, C. Carry, M. Kleitz, M.C. Steil,J. Eur. Ceram. Soc. 35 (2015)
2587-2592.
(7) J.S.C. Francis, M. Cologna, R. Raj, J. Eur. Ceram. Soc. 32 (2012) 3129-3136. (8) R. Chaim, C. Estournes,j. Mater. Sci. 53 (2018) 6378-6389.
(9) M. Biesuz. P. Luchi, A. Quaranta, V.M. Sglavo,J. Appl. Phys. 120 (2016) 145107. (10) J.C. M'Peko,J.S.C. Francis, R. Raj,J. Eur. Ceram. Soc. 34 (2014) 3655-3660. (11) M. Biesuz. G. Dell'Agli, L Spiridigliozzi, C. Ferone, V.M. Sglavo, Ceram. Int 42 (2016)
11766-11771.
(12] A. Gaur, V.M. Sglavo,J. Am. Ceram. Soc. 98 (2015) 1747-1752.
(13) X. Hao, Y. Liu, Z. Wang,J. Qiao, K. Sun,J. Power Sources 210 (2012) 86-91. (14)N. Shomrat, S. Baltianski, C.A. Randall, Y. Tsur, J. Eur. Ceram. Soc. 35 (2015)
2209-2213.
(15)H. Yoshida, P. Biswas, R. Johnson, M.K. Mohan, J. Am. Ceram. Soc. 100 (2017) 554-562.
(16] X. Su, G. Bai,J. Zhang,J. Zhou, Y.Jia, Appl. Surf. Sei. 442 (2018) 12-19. (17] A. Gaur, V.M. Sglavo,J. Eur. Ceram. Soc. 34 {2014) 2391-2400.
(18) X. Su, G. Bai, Y.Jia, Z. Wang, W. Wu, X. Yan, T. Ai, P. Zhao, j. Eur. Ceram. Soc. 38 (2018) 3489-3497.
(19] R. Muccillo, E.N.S. Muccillo,J. Eur. Ceram. Soc. 34 (2014) 915-923.
(20) A. Karakuscu, M. Cologna, D. Yarotski, J. Won, J.S.C. Francis, R. Raj, B.P. Uberuaga, J. Am. Ceram. Soc. 95 (2012) 2531-2536.
(21) S.K.Jha, R. Raj,J. Am. Ceram. Soc. 97 (2014) 527-534.
(22) H. Yoshida, Y. Sakka, T. Yamamoto,J.M. Lebrun, R. Raj,J. Eur. Ceram. Soc. 34 (2014) 991-1000.
(23) R.I. Todd, E. Zapata-Solvas, R.S. Bonilla, T. Sneddon, P.R. Wilshaw, J. Eur. Ceram. Soc. 35 (2015) 1865-1877.
(24) JA. Downs, V.M. Sglavo, J. Am. Ceram. Soc. 96 (2013) 1342-1344. [25) R. Chaim, J. Mater. Sei. 53 (2018) 13853-13864.
(26) A. Navrotsky, L Benoist, H. Lefebvre, J. Am. Ceram. Soc. 88 (2005) 2942. (27) O. Muller, R. Roy, The Major Ternary Structural Families, Springer Verlag, Berlin,
1974.
(28) R.D. Shannon, Acta Crystallogr. A 32 (1976) 751-767.
(29)C.M. Rost, E. Sachet, T. Borman, A. Moballegh, E.C. Dickey, D. Hou, j.L Jones, S. Curtarolo, J.P. Maria. Nat. Commun. 6 (2015) 8485.