Publisher’s version / Version de l'éditeur:
Vous avez des questions? Nous pouvons vous aider. Pour communiquer directement avec un auteur, consultez la
première page de la revue dans laquelle son article a été publié afin de trouver ses coordonnées. Si vous n’arrivez pas à les repérer, communiquez avec nous à [email protected].
Questions? Contact the NRC Publications Archive team at
[email protected]. If you wish to email the authors directly, please see the first page of the publication for their contact information.
https://publications-cnrc.canada.ca/fra/droits
L’accès à ce site Web et l’utilisation de son contenu sont assujettis aux conditions présentées dans le site LISEZ CES CONDITIONS ATTENTIVEMENT AVANT D’UTILISER CE SITE WEB.
Inter-Noise 2004 [Proceedings], pp. 1-8, 2004-08-01
READ THESE TERMS AND CONDITIONS CAREFULLY BEFORE USING THIS WEBSITE. https://nrc-publications.canada.ca/eng/copyright
NRC Publications Archive Record / Notice des Archives des publications du CNRC :
https://nrc-publications.canada.ca/eng/view/object/?id=b23a5bb8-d638-4bf6-b50f-0bba06348410 https://publications-cnrc.canada.ca/fra/voir/objet/?id=b23a5bb8-d638-4bf6-b50f-0bba06348410
NRC Publications Archive
Archives des publications du CNRC
This publication could be one of several versions: author’s original, accepted manuscript or the publisher’s version. / La version de cette publication peut être l’une des suivantes : la version prépublication de l’auteur, la version acceptée du manuscrit ou la version de l’éditeur.
Access and use of this website and the material on it are subject to the Terms and Conditions set forth at Impact sound ratings: ASTM versus ISO
Impact sound ratings: ASTM versus ISO
Warnock, A.C.C.
NRCC-47036
A version of this document is published in / Une version de ce document se trouve dans : Inter-Noise 2004, 33rd International Congress and Exposition on Noise Control Engineering,
Prague, Czech Republc, August 22-25, 2004, pp. 1-8
The 33rd International Congress and Exposition on Noise Control Engineering
1/8
Impact Sound Ratings: ASTM versus ISO
A.C.C. Warnock
Institute for Research in Construction, National Research Council Canada, 1200 Montreal Road, Ottawa, Ontario K1A 0R6, Canada
Abstract [694] The two standard methods for rating the impact sound insulation of building components (ISO 717-2 [1] and ASTM E989 [2]) produce Ln,w (normalized weighted impact sound
index) and IIC (impact insulation class). ISO 717 also proposes two spectrum adaptation terms to be used in addition to Ln,w. These four ratings can give quite different rankings when applied to the same
set of test results. When they are applied to evaluate floor toppings, especially on lightweight joist floors, contradictions become even greater. Standard writing committees need to remove the confusion caused by the existence of these different rating methods.
1 INTRODUCTION
Impact sound tests in accordance with the ISO [3] and ASTM [4] methods are carried out in essentially the same way using the same standardized tapping machine. Four possible systems are described in standards for rating the effectiveness of the floor systems [1, 2]. The same rating systems are or can be used to evaluate floor coverings or toppings that may be placed on concrete slabs or on lightweight joist floors. Differences among the four rating systems can be very large. Data collected in the NRC laboratory over several years are used to illustrate the problems facing the standards-writing committees.
2 THE RATING SYSTEMS
The same frequency range and reference contour are used for calculation of Ln,w and IIC. The
ASTM fitting procedure differs in only two respects from the ISO standard: the data are rounded to the nearest decibel instead of to the nearest 0.1 dB and the maximum deficiency allowed during the fitting procedure is 8 dB – the “8 dB rule”. When fitting is complete, the IIC rating is obtained by subtracting the value of the reference contour at 500 Hz from 110. This has the effect that higher numbers mean greater protection against impact sound. In contrast, the Ln,w rating decreases as the
floor impact sound attenuation increases. When the 8 dB rule is not invoked, the two ratings are related by IIC = 110 – Ln,w.
In an informative Annex to ISO 717, spectrum adaptation term(s), CI, are proposed that are meant
to deal with low frequency impact sound. The sum of the adaptation term and the Ln,w rating is
equal to the unweighted energy sum of the tapping machine levels minus 15 dB. The suggested frequency range is 100 to 2500 Hz but it can be extended down to 50 Hz. In this paper C50 and C100 denote the energy sums from 50 or 100 to 2500 Hz minus 15 dB.
3 COMPARISONS FOR COMPLETE FLOOR SYSTEMS
IIC, Ln,w, C100 and C50 have been calculated for 407 tests carried out over several years in the
floor testing suite at NRC. Most types of floors common in North America were included in the set. The effect on IIC of rounding to the nearest 0.1 dB instead of 1 dB is minimal; only 41 results changed when the rounding rule was changed and the changes were all by only by ±1 point.
As might be expected, the E989 8 dB rule gives IIC values that do not always agree with Ln,w
ratings. 152 of the floors tested were given poorer ratings by the ASTM system (Figure 1). The differences are not all small. The origins of the 8 dB rule are shrouded in historical mist and it is not the point of this paper to examine its validity.
0 50 100 150 200 250 -1 0 1 2 3 4 5 6 7 8 9 (110-IIC)-Lnw Count
Figure 1: Distribution of differences between (110-IIC) and Ln,w.
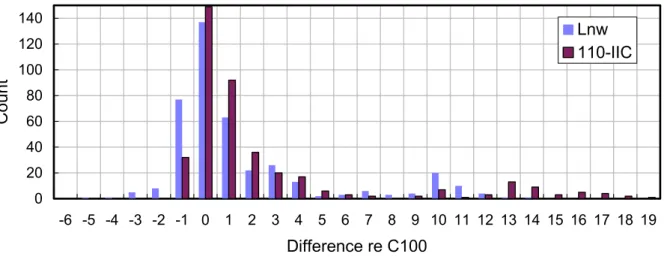
Neither IIC nor Ln,w correlate very well with the C100 rating. This is not surprising. C100 is
supposed to be a superior rating and so should not agree perfectly with the older ratings based on reference curves. The distribution of differences is shown for 110-IIC and Ln,w in Figure 2. Where
the differences are large and positive, the floor tested usually had a concrete or other very hard surface. 0 20 40 60 80 100 120 140 -6 -5 -4 -3 -2 -1 0 1 2 3 4 5 6 7 8 9 10 11 12 13 14 15 16 17 18 19 Difference re C100 Count Lnw 110-IIC
Figure 2: Distribution of differences re C100.
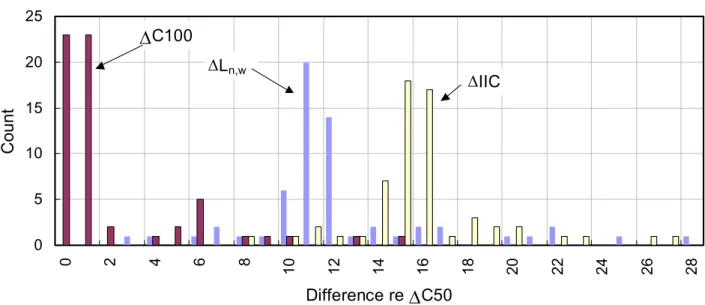
Part of the reason for introducing a new rating, is to deal with the low frequency sounds that are so disturbing beneath light joist floors. All of the tests included data down to 50 Hz so the C50 rating
3/8
differences for this comparison is shown in Figure 3. The range of differences is much greater as might be expected since many of the floors in the database were joist floors which usually have most of the transmitted impact energy at low frequencies. Even C100 does not compare very well with the C50 rating.
If only complete systems are being compared, having four rating systems giving contradictory information is not satisfactory. The situation becomes worse when ratings for floor toppings are compared. 0 20 40 60 80 100 120 -24 -20 -16 -12 -8 -4 0 4 8 12 16 Differences re C50 Count Lnw 110-IIC C100
Figure 3: Distribution of differences re C50
4 FLOOR TOPPINGS ON CONCRETE SLABS
The test procedures for evaluating floor coverings or toppings in ISO 140-8 [5] and ASTM E2179 [6] are almost identical. The change in impact sound pressure level caused by placing a topping on a concrete slab is added to the levels for a hypothetical reference concrete slab and the difference in rating for the two hypothetical systems is the rating for the topping.
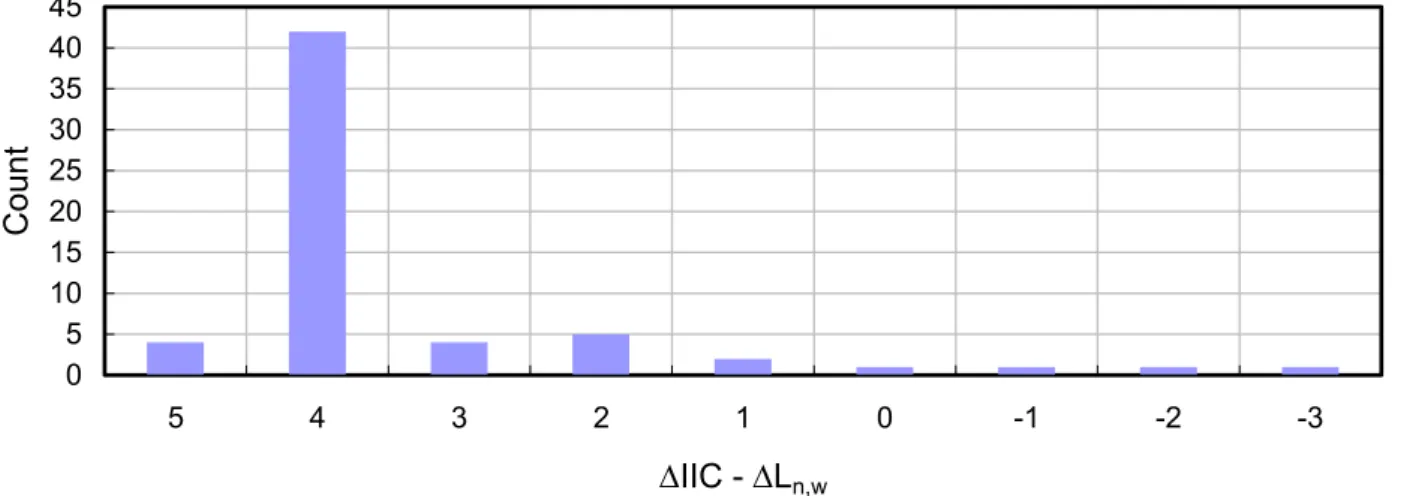
0 5 10 15 20 25 30 35 40 45 5 4 3 2 1 0 -1 -2 -3 ∆IIC - ∆Ln,w Count
The rating procedures are based on E989 and ISO 717-2 and are denoted as ∆IIC and ∆Ln,w.
Because of the 8 dB rule in E989, the reference contour for the bare reference slab is 4 dB lower when it is fitted than in the case of the ISO 717 fit. This bias can be further modified by a second application of the 8 dB rule to the reference slab plus the topping. Figure 4 shows the distribution of differences measured for 61 different toppings tested on a 150 mm concrete slab.
Toppings can also be evaluated using the differences in the two quantities C50 and C100 defined above. Figure 5 compares the two standard ratings with the difference in C100. Figure 6 uses ∆C50 as the common reference. These variations are large because of the differences between the contour fitting method and the energy sum method.
0 5 10 15 20 25 30 3 4 5 6 7 8 9 10 11 12 13 14 15 16 Difference relative to ∆C100 Count ∆Ln,w ∆IIC
Figure 5: Differences between ∆IIC and ∆Ln,w and ∆C100
0 5 10 15 20 25 0 2 4 6 8 10 12 14 16 18 20 22 24 26 28 Difference re ∆C50 Count ∆IIC ∆Ln,w ∆C100
Figure 6: Differences between ∆IIC, ∆Ln,w,, ∆C100 and ∆C50 for toppings on a concrete slab
5 FLOOR TOPPINGS ON JOIST FLOORS
Toppings placed on joist floors with wood subfloor do not give the same reduction in impact sound pressure level as they do when placed on a concrete slab. An ISO working group has almost
5/8
levels below due to the tapping machine are measured with and without the topping just as is done on a concrete slab in ISO 140-8.
The differences in level obtained will be applied to some reference impact spectrum and the change in the ratings will be used to evaluate the topping. It is reasonable to assume that the difference rating will use one or more of the systems already presented. There is no reference impact spectrum as yet for this measurement procedure. However, the joist floor construction shown in Figure 7 is very similar to one described in the ISO draft standard as a standard floor. For the purposes of this paper, the impact levels measured under this floor in our lab are taken as the reference impact spectrum.
To estimate the magnitude of the differences one might see for such test results, improvement spectra from 41 measurements of toppings on joist floors were applied to the “reference” spectrum in Figure 7 and rated using the four rating schemes. The improvement spectrum for one particular topping has been added to this spectrum in Figure 7 and the values of the four ratings with and without the topping are shown in the figure.
The improvements were obtained on floors that were similar but not identical in construction to the reference floor. Since the focus here is on the rating system, any differences due to these construction differences are not important.
Reference Floor 30 35 40 45 50 55 60 65 70 75 80 63 125 250 500 1k 2k Frequency, Hz
ISPL, dB Bare +top ∆
Ln,w 62 55 7 IIC 48 53 5 C100 62 56 6 C50 67 64 3 Bare With topping
Figure 7:The “bare” curve shows the measured impact sound pressure levels used as a reference impact spectrum. The lower curve is the result when a topping is applied.
It would be confusing to use the same symbols for toppings tested on a joist floor as for those tested on a concrete slab, so for the present, four new symbols are introduced. These are a) ∆joistIIC for the
difference in IIC, b) ∆joistLn,w for the difference in Ln,w, c) ∆joistC100 for the difference in the
unweighted energy sum from 100 to 2500 Hz, and d) ∆joistC50 for the difference in the unweighted
energy sum from 50 to 2500 Hz.
Figure 8 shows the broad distribution of differences between ∆joistLn,w and ∆joistIIC; less than half of
the differences are in the range ±1. The ISO 717 based rating tends to give higher ratings, which was not the case for toppings on concrete.
Figure 9 compares the three ratings that are based on energy summation from 100 to 2500 Hz. The
0 2 4 6 8 10 12 -10 -9 -8 -7 -6 -5 -4 -3 -2 -1 0 1
∆joistIIC - ∆joistLn,w
Count
Figure 8: Distribution of differences between ∆joistLn,w and ∆joistIIC for 41 toppings on joist floors
0 2 4 6 8 10 12 14 16 -16 -14 -12 -10 -8 -6 -4 -2 0 2 4 6 Difference re ∆joistC100 Count
∆joistIIC ∆joistLn,w
Figure 9: Difference in ratings for toppings on joist floors relative to ∆joistC100 , the difference in the flat
level from 100 to 2500 Hz.
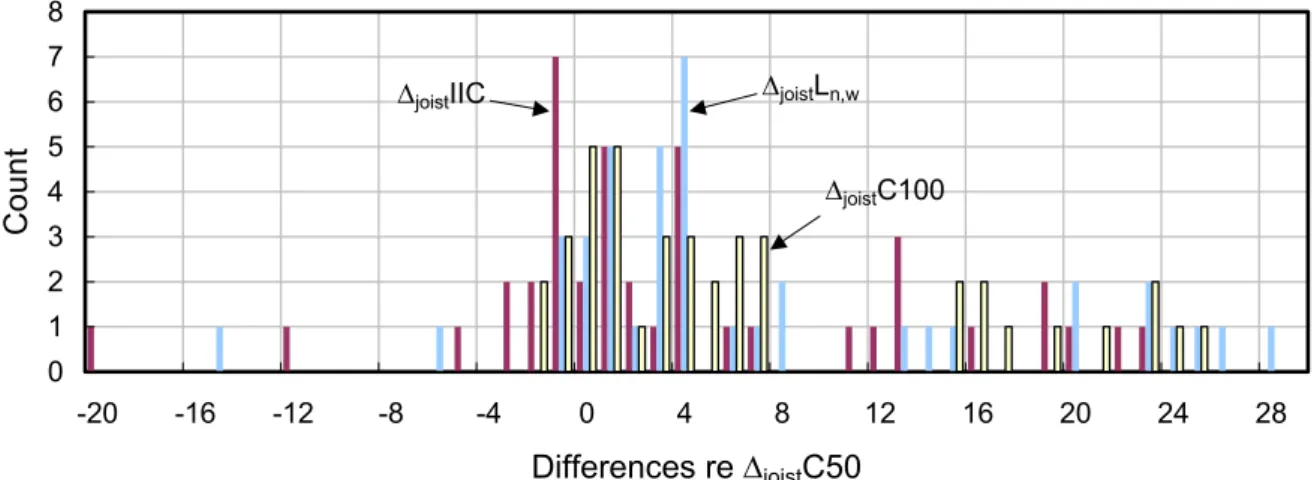
Since the point of the energy sum ratings is to deal with low frequency sound, ∆joistC50 ought to be
the best of these ratings. It is compared with the other three in Figure 10. Including frequencies below 100 Hz increases disagreement among the ratings.
Some of the differences seem unreasonably large but their cause can be understood when the spectra are examined. The topping shown in Figure 7 does not change the general shape of the spectrum much, so the four difference ratings are in reasonable agreement. Figure 11 shows the impact levels and ratings that result when the improvements for a carpet and underpad are applied to the reference floor spectrum. In this case the 8 dB rule causes the ASTM rating to be 10 dB different from the Ln,w based rating. The C100 difference lies between the two but the C50 rating is
much less because of the preponderance of low frequency energy.
A different situation arises when the topping applied has a hard surface and increases high frequency energy. Figure 12 gives an example where a gypsum concrete topping was poured on a joist floor. At one extreme, the IIC approach says the floor is 12 dB worse than before the topping was applied. At the other, the C50 difference says the floor is 8 dB better.
7/8 0 1 2 3 4 5 6 7 8 -20 -16 -12 -8 -4 0 4 8 12 16 20 24 28 Differences re ∆joistC50 Count ∆joistC100 ∆joistIIC ∆joistLn,w
Figure 10: Difference in ratings for toppings on joist floors relative to ∆joistC50, the difference in the flat
level from 50 to 2500 Hz.
Carpet and underpad
10 20 30 40 50 60 70 80 90 63 125 250 500 1k 2k Frequency, Hz ISPL , d B
ASTM E989 fit ISO 717-2 fit Bare +top ∆ Ln,w 62 31 31 IIC 48 69 21 C100 62 37 25 C50 67 59 8
Figure 11: Improvement for a carpet and underpad applied to the reference floor.
Gypsum concrete topping
40 45 50 55 60 65 70 75 80 63 125 250 500 1k 2k Frequency, Hz ISPL, dB
ASTM E989 fit ISO 717-2 fit Bare +top ∆ Ln,w 62 69 -7 IIC 48 36 -12 C100 62 58 4 C50 67 59 8
Figure 12: Improvement for a gypsum concrete topping applied to the reference floor
6 SUMMARY
The differences between the IIC and the Ln,w ratings are too large even when applied only to
complete floor systems. When these two systems are used to rate floor toppings, the differences between rating systems becomes much greater.
The C type ratings, based on research, are not yet mandatory in ISO 717. It would be unwise to make these additional ratings mandatory without simultaneously abandoning the use of the contour fitting procedures in E989 and ISO 717-2. To have four contradictory systems in place would lead to intolerable confusion.
It would be ideal if both ISO and ASTM could change simultaneously to something like the C100 rating. The C50 rating, while useful for research work might lead to unacceptably large reproducibility ranges for the test methods because of variability at low frequencies.
REFERENCES
[1] ISO 717. Rating of sound insulation in buildings and of building elements, Impact sound insulation [2] ASTM E989. Standard Classification for Determination of Impact Insulation Class (IIC).
[3] ISO 140-6. Laboratory measurements of impact sound insulation of floors
[4] ASTM E492. Standard Test Method for Laboratory Measurement of Impact Sound Transmission through Floor-ceiling Assemblies using the Tapping Machine.
[5] ISO 140-8. Measurement of sound insulation in buildings and of building elements, Laboratory measurement of the reduction of transmitted impact noise by floor coverings on a standard floor
[6] ASTM E2179. Standard Test Method For Laboratory Measurement Of The Effectiveness Of Floor Coverings In Reducing Impact Sound Transmission Through Concrete Floors.
[7] ISO 140-11. Laboratory measurements of the reduction of transmitted impact noise by floor coverings on lightweight framed standard floors.