Publisher’s version / Version de l'éditeur:
Proceedings of the 18th International Symposium on Ice, IAHR'06, 2, pp. 89-96, 2006
READ THESE TERMS AND CONDITIONS CAREFULLY BEFORE USING THIS WEBSITE.
https://nrc-publications.canada.ca/eng/copyright
Vous avez des questions? Nous pouvons vous aider. Pour communiquer directement avec un auteur, consultez la première page de la revue dans laquelle son article a été publié afin de trouver ses coordonnées. Si vous n’arrivez pas à les repérer, communiquez avec nous à [email protected].
Questions? Contact the NRC Publications Archive team at
[email protected]. If you wish to email the authors directly, please see the first page of the publication for their contact information.
NRC Publications Archive
Archives des publications du CNRC
This publication could be one of several versions: author’s original, accepted manuscript or the publisher’s version. / La version de cette publication peut être l’une des suivantes : la version prépublication de l’auteur, la version acceptée du manuscrit ou la version de l’éditeur.
Access and use of this website and the material on it are subject to the Terms and Conditions set forth at
Development of a database for iceberg sightings off Canada's East
Coast
Verbit, S.; Comfort, G.; Timco, G.
https://publications-cnrc.canada.ca/fra/droits
L’accès à ce site Web et l’utilisation de son contenu sont assujettis aux conditions présentées dans le site
LISEZ CES CONDITIONS ATTENTIVEMENT AVANT D’UTILISER CE SITE WEB.
NRC Publications Record / Notice d'Archives des publications de CNRC:
https://nrc-publications.canada.ca/eng/view/object/?id=e518b073-7382-46ff-bdbe-8ba6f662a8c3 https://publications-cnrc.canada.ca/fra/voir/objet/?id=e518b073-7382-46ff-bdbe-8ba6f662a8c3
Reprinted from:
Proceedings 18th International Symposium on Ice, IAHR’06 Vol. 2, pp 89-96, Sapporo, Japan, 2006.
DEVELOPMENT OF A DATABASE FOR ICEBERG SIGHTINGS OFF
CANADA’S EAST COAST
S. Verbit1, G. Comfort1, G. Timco2
1
BMT Fleet Technology Limited, Kanata, Canada
2
Canadian Hydraulics Centre, National Research Council, Ottawa, Canada
S. Verbit, BMT Fleet Technology Limited, 311 Legget Drive, Kanata, ON, Canada, K2K 1Z8
Tel.: 613-592-2830; Fax: 613-592-4950; email: [email protected]
ABSTRACT
Icebergs are a significant hazard for shipping and other operations conducted off Canada’s east coast, such as oil drilling. Iceberg sightings have been made for almost 400 years. Currently, iceberg sightings are carried out by the International Ice Patrol, the Canadian Ice Service, and the offshore oil industry. Over the past seven years, a database has been developed which contains these sighting data. The paper describes the database and a summary of the data. Efforts are currently underway to expand the database with flight track information to increase the utility of the database by enabling iceberg spatial densities to be calculated, as it is not feasible to perform continuous sampling of the vast areas of interest. Sample results are presented.
INTRODUCTION AND OBJECTIVES
For many years, information on the number of icebergs on the Grand Banks of Canada was contained in numerous sources and no comprehensive resource was available. Each industry maintained their own information and this made it difficult for both industry and regulators. Knowledge of the historical iceberg population is important for planning purposes and for accurate analysis of probabilistic ice loads in different regions of the Grand Banks. Because of this, the Canadian Program of Energy Research and Development (PERD) began a program in 1998 to consolidate the available information and to maintain and improve it on an annual basis. The database is available for download from the National Research
Council’s Canadian Hydraulics Center’s (CHC) website (www.chc.nrc.ca under Cold
Regions Technology). The development, features, and current status of the database are presented.
ICEBERG SIGHTING DATABASE DEVELOPMENT AND CONTENT
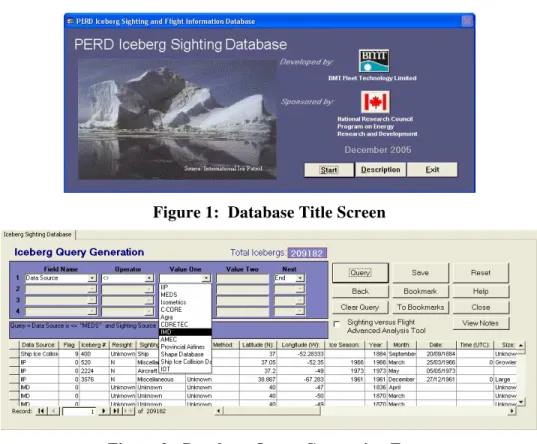
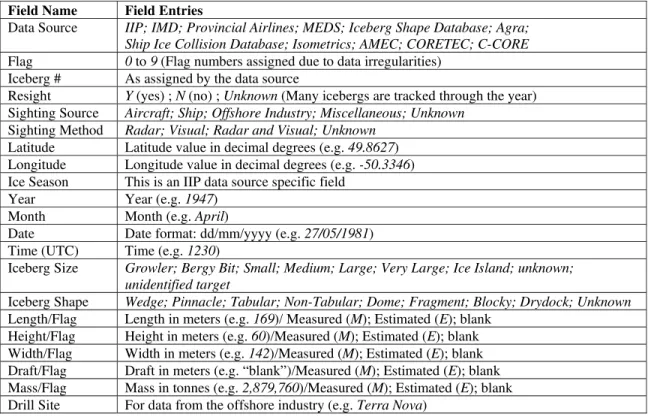
The database was developed using Microsoft Access. A practical, user-friendly interface was designed to allow users to query the database without being familiar with either MS Access or the database’s internal setup (Figures 1 and 2).
Figure 1: Database Title Screen
Figure 2: Database Query Generation Form Database Development Efforts
The PERD Iceberg Sighting Database was initially developed in 1998 and over the past eight years has been updated annually. All information on the development of the database is available in the current report describing the database (BMT Fleet Technology, 2005). In addition to updating the population statistics, further development efforts have been focused on producing the most complete, comprehensive, and useful collection of iceberg sightings possible. For example, in 2002 an extensive literature search and review was conducted to find additional sighting records only available in print. In 2003, the database was extensively queried for each month of each year for various geographic regions of interest to investigate trends. In 2004, data from other PERD databases were included. Most recently, development efforts have focused on incorporating flight track data, which was a step toward allowing the search areas associated with the sighting data to be determined. The primary goal was to enable statistical models and other analyses to account for a sampling area, which in turn accents the fact that the iceberg sightings available in the database do not represent an exact picture of all icebergs within the eastern Canadian coastal region.
The Data
The database now holds 209,182 iceberg sightings (Table 1). Over eighty per cent of the sightings were made during large-scale surveys conducted by the International Iceberg Patrol (IIP) and the Canadian Ice Service (CIS).
Table 1: Database Content by General Sighting Source
Data Source # of Sightings Period of Record
Large-Scale Surveys (e.g., IIP, CIS) 174,445 1960 to 2004 Data From Oil Industry Wellsites 18,519 1981 to 2004
Historical Data 15,342 1619 to 1959
Detailed Iceberg Field Surveys 876 1979 to 1997
The database interface allows the user to select the search parameters to run a query, and save the results in MS Excel format (Figure 2). The data table contains 21 fields (Table 2) which generally fall into the categories of: (a) the data source & sighting parameters; (b) the position and time of the sighting, and; (c) the iceberg physical properties.
Table 2: Iceberg Sighting Database Fields
Field Name Field Entries
Data Source IIP; IMD; Provincial Airlines; MEDS; Iceberg Shape Database; Agra; Ship Ice Collision Database; Isometrics; AMEC; CORETEC; C-CORE
Flag 0 to 9 (Flag numbers assigned due to data irregularities)
Iceberg # As assigned by the data source
Resight Y (yes) ; N (no) ; Unknown (Many icebergs are tracked through the year)
Sighting Source Aircraft; Ship; Offshore Industry; Miscellaneous; Unknown
Sighting Method Radar; Visual; Radar and Visual; Unknown
Latitude Latitude value in decimal degrees (e.g. 49.8627) Longitude Longitude value in decimal degrees (e.g. -50.3346) Ice Season This is an IIP data source specific field
Year Year (e.g. 1947)
Month Month (e.g. April)
Date Date format: dd/mm/yyyy (e.g. 27/05/1981) Time (UTC) Time (e.g. 1230)
Iceberg Size Growler; Bergy Bit; Small; Medium; Large; Very Large; Ice Island; unknown; unidentified target
Iceberg Shape Wedge; Pinnacle; Tabular; Non-Tabular; Dome; Fragment; Blocky; Drydock; Unknown
Length/Flag Length in meters (e.g. 169)/ Measured (M); Estimated (E); blank Height/Flag Height in meters (e.g. 60)/Measured (M); Estimated (E); blank Width/Flag Width in meters (e.g. 142)/Measured (M); Estimated (E); blank Draft/Flag Draft in meters (e.g. “blank”)/Measured (M); Estimated (E); blank Mass/Flag Mass in tonnes (e.g. 2,879,760)/Measured (M); Estimated (E); blank Drill Site For data from the offshore industry (e.g. Terra Nova)
Data Verification Procedures
Data quality verification has been done throughout the development of the database. All data are checked using a mapping program to identify obvious problems, such as an incorrect position placing them on land or out of “reasonable” range. Other corrections made to the data have included: ensuring that uniform numbering between the Sighting Database and the original data source is retained to allow cross-referencing; the integration of duplicate iceberg sightings when possible between different data sources, to avoid inflating the number of unique icebergs sighted; the addition of the “Flag” field to note existing data changes and/or irregularities. For example, an error in longitudes was discovered for many of the sightings from the 1994 IIP data set. All affected data were flagged (Singh et al, 1999).
Data from Other Databases
Sightings from pre-existing databases were inserted into the PERD Iceberg Sighting Database: (a) the Iceberg Shape Database (Canatec, 1999); (b), the Ship Iceberg Collision Database (Hill, 2004), and; (c) the PERD Iceberg Management Database (Rudkin, 2005). The purpose of the inclusions was not to duplicate or replace the existing databases, but to extract the data relevant to the Sighting Database. The sightings extracted are referenced with flags and can be cross-reference to their original sources. In the case of the Iceberg
Management Database, this work included consultation with Provincial Airlines Ltd., and the development of a unified numbering system for cross-database consistency.
SAMPLE ICEBERG SIGHTING RESULTS
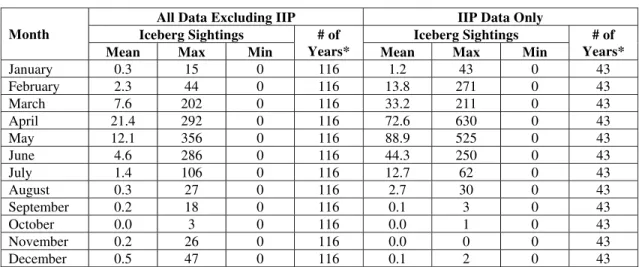
The database was queried (Comfort et al, 2003) to determine the number of iceberg sightings for each month of each year for: (a) the whole area encompassed by the database-iceberg counts were determined for each 1° by 1° latitude by longitude cell, and; (b) the Grand Banks and vicinity-iceberg counts were determined for each 0.5° by 0.5° latitude by longitude cell, within ranges of latitude and longitude of N 45° to N 47.5° inclusive, and W 45° to W 49.5° inclusive. The database was further queried to determine the number of iceberg sightings for each month of each year for the “oil development area” of the Grand Banks as defined by latitude and longitude ranges of N 46° to N 47.5° inclusive, and W 47.5° to W 49.5°. As expected, these queries showed that iceberg sightings peaked in April and May (Table 3).
Table 3: Iceberg Sightings: Grand Banks+
All Data Excluding IIP IIP Data Only
Iceberg Sightings Iceberg Sightings
Month
Mean Max Min # of
Years* Mean Max Min
# of Years* January 0.3 15 0 116 1.2 43 0 43 February 2.3 44 0 116 13.8 271 0 43 March 7.6 202 0 116 33.2 211 0 43 April 21.4 292 0 116 72.6 630 0 43 May 12.1 356 0 116 88.9 525 0 43 June 4.6 286 0 116 44.3 250 0 43 July 1.4 106 0 116 12.7 62 0 43 August 0.3 27 0 116 2.7 30 0 43 September 0.2 18 0 116 0.1 3 0 43 October 0.0 3 0 116 0.0 1 0 43 November 0.2 26 0 116 0.0 0 0 43 December 0.5 47 0 116 0.1 2 0 43 +
Latitude Range: 46° to 47.5°N; Longitude Range: 47.5° to 49.5°W; *The years analyzed span to 2001
More sightings have been made in the past 40 years than previously. This reflects the fact that the sightings in the database prior to 1960 are all based on limited retrieval of historical records as well as sampling, whereas regular surveys were commenced in 1960 by the IIP. This observation highlights the importance of sampling frequency, which was the main issue addressed during the most recent development efforts. The annual sighting numbers
occurring in May from 1940 to 2001 are shown in Figure 3, which illustrate the importance of sampling frequency.
0 100 200 300 400 500 600 19 40 19 50 19 60 19 70 19 80 19 90 20 00 Year N u m b e r of S ighti ngs ( M ay onl y) IIP Sightings Other Sources Historical
Only IIP Data
Available
Figure 3: Iceberg Sightings in May for Lat.:46°-47.5°N, and Long.: 47.5°-49.5°W CURRENT DATABASE IMPROVEMENTS: ADDITION OF FLIGHT TRACK DATA
Probably, the most severe limitation of the Sighting Database is that it does not contain information regarding the sampling that was done. Should a particular query return no sightings, it is not possible to determine whether: (a) no sampling (e.g., flights, observations) was done in the selected area over the specified time period, or; (b) no icebergs were present. Considering that the majority of the sightings in the database were made from large-scale, aerial surveys, efforts are being made to include flight track data in the Sighting Database.
Overview
A second data table was added to the Sighting Database which includes flight track data for IIP and CIS flights with an associated user interface. The flight track information was
supplied in electronic format by the CIS (L. Desjardins, CIS). These data were decoded using a project-specific program. Flight track data from 1986 to 1991, and from 1998 to 2003, have been inserted into the expanded database. The intermediate data were at the quality assurance stage and not available for insertion.
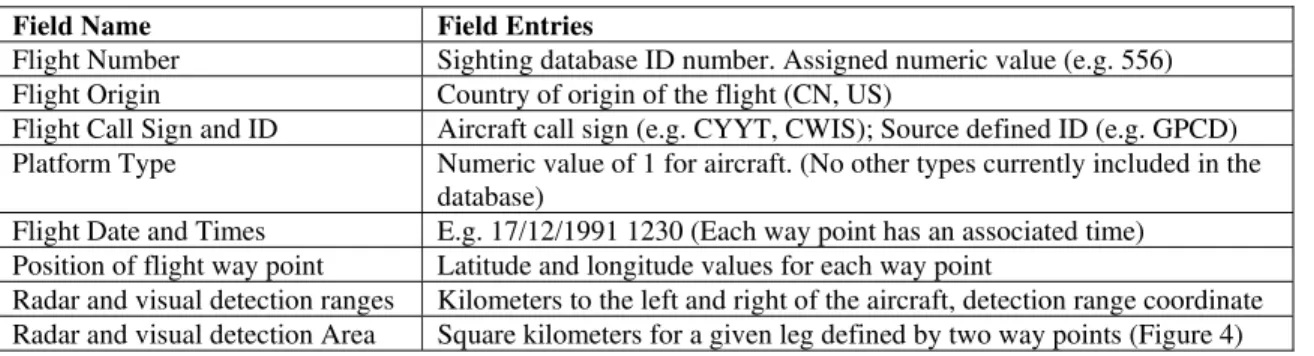
Table 4: Iceberg Sighting Flight Track Data Fields
Field Name Field Entries
Flight Number Sighting database ID number. Assigned numeric value (e.g. 556) Flight Origin Country of origin of the flight (CN, US)
Flight Call Sign and ID Aircraft call sign (e.g. CYYT, CWIS); Source defined ID (e.g. GPCD) Platform Type Numeric value of 1 for aircraft. (No other types currently included in the
database)
Flight Date and Times E.g. 17/12/1991 1230 (Each way point has an associated time) Position of flight way point Latitude and longitude values for each way point
Radar and visual detection ranges Kilometers to the left and right of the aircraft, detection range coordinate Radar and visual detection Area Square kilometers for a given leg defined by two way points (Figure 4)
Cross Referencing Analysis Tool and Sample Results
A flight vs. iceberg sighting cross-referencing tool was implemented to analyze the new flight track data. It is accessible from either the Iceberg Sighting or the Flight Information sections of the database. The tool queries the flight and iceberg sighting data tables based on user entered geographical positions and time criteria. The results include: (a) the flight track; (b) the sampled search area; (c) the positions of icebergs sighted within that search area of interest, and; (d) the calculated iceberg density based on the sampled search area. The sampled search area, and in turn the density, are calculated based on either: (a) the visual range of coverage; (b) the radar range of coverage, or; (c) the nominal coverage, determined from the search grid coordinates inputted by the user for a particular query.
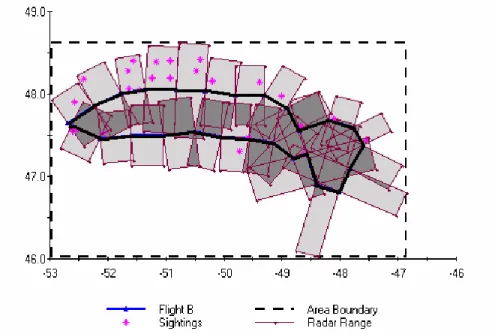
Figure 4 shows the trajectory of database flight number 880, the radar coverage associated with each leg of the flight (small rectangles), the nominal search area (dashed line), and the icebergs sighted. The darker shaded areas represent regions that have overlapping radar coverage. The coordinates of the radar area (and visual) for each flight leg are calculated based on the radar range reported in kilometres in the coded flight messages obtained from CIS. The visual range reported for this flight was nil for all flight legs. Twenty-five icebergs were observed during flight 880.
Figure 4: Example Database Output Chart for Flight 880 on May 7, 2000
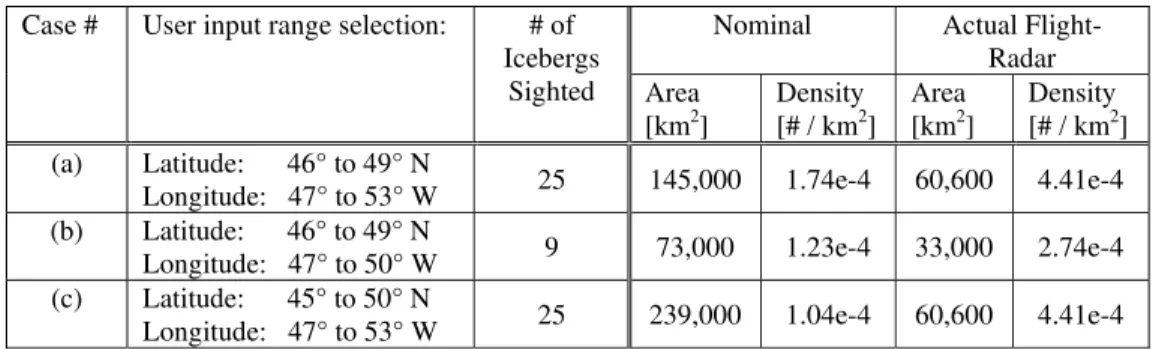
Figure 4 only presents one possible search area result for May 7, 2000 that detected flight 880. A wide range of possible coordinate grids could potentially be inputted by the user for May 7, 2000 resulting in a multitude of possible iceberg density results. It is instructive to compare the actual iceberg area densities with the nominal ones that would be calculated based on the coordinates inputted for a particular query. Three example cases are presented in Table 5.
Table 5: Sample Iceberg Area Densities for Flight 880 on May 7, 20001
Nominal Actual Flight-Radar Case # User input range selection: # of
Icebergs Sighted Area [km2] Density [# / km2] Area [km2] Density [# / km2] (a) Latitude: 46° to 49° N
Longitude: 47° to 53° W 25 145,000 1.74e-4 60,600 4.41e-4 (b) Latitude: 46° to 49° N
Longitude: 47° to 50° W 9 73,000 1.23e-4 33,000 2.74e-4 (c) Latitude: 45° to 50° N
Longitude: 47° to 53° W 25 239,000 1.04e-4 60,600 4.41e-4
1
No icebergs were sighted visually during Flight 880 on May 7, 2000.
Note that the sum of the leg areas shown in Figure 4 cannot be used to compute the total flight coverage area, as there is significant overlap, an issue yet to resolve within the database. To determine the actual coverage areas by the aircraft radar system for the only flight east of St. John’s, Newfoundland on May 7, 2000, the flight coverage coordinates were exported to a GIS software tool (Figure 5).
Figure 5: Radar Coverage for Flight 880 on May 7, 2000
The user defined nominal search areas selected for cases (a) and (c) encompass the total flight search area, but differ in total area, whereas the search area selected for example (b) contains only part of flight 880. These simple comparisons show that nominal values are likely to underestimate the calculated iceberg area densities when accounting for actual sampling areas.
The calculation of the search areas is a laborious process, especially with respect to avoiding errors due to double-counting overlapped areas among various legs of the flight. A more streamlined, user-friendly process is required. The use of an existing GIS software or component is suggested.
CONCLUSIONS
An extensive Iceberg Sighting Database has been developed and quality-checked. The iceberg sighting data table has been updated with annually available data. The Sighting
Database is user-friendly and available on the CHC’s website, www.chc.nrc.ca under Cold
Regions Technology.
To augment the sighting data, flight track data have been incorporated into the database. The icebergs sighted by aircraft are linked with their associated flight, and the database outputs information that allows iceberg area densities to be calculated. However, it is currently a laborious process to calculate appropriate estimates of flight area coverage. The
implementation of a GIS area coverage calculation should be implemented.
ACKNOWLEDGEMENTS
The project was funded by PERD (Program on Energy Research and Development) through the Ice-Structure Interaction activity of the Offshore Environmental Factors POL. Don Murphy of the IIP is thanked for regularly supplying IIP data for the database. The oil industry is thanked for making their data available regularly, which, at present, is being supplied by their survey contractor, Provincial Air Lines (PAL) through Pip Rudkin. Luc Desjardins of the Canadian Ice Service (CIS) is thanked for supplying quality-checked flight track information which has been inputted into the database. Brian Hill of the Institute of Ocean Technology (IOT/NRC) is thanked for compiling the historical sighting data and the Ship-Ice Collision database which have been included in the Iceberg Sighting Database. Anne Collins of the CHC is thanked for her guidance regarding GIS systems and the inclusion of flight track data.
REFERENCES
Canatech Consultants Ltd., ICL Isometrics Ltd., Coretec Inc., and Westmar Consultants Ltd., 1999, Compilation of Iceberg Shape and Geometry Data for the Grand Banks Region, report submitted to PERD PERD/CHC report 20-43.
Comfort, G. and Verbit, S., 2003, Update and Quality Assurance of the PERD Grand Banks
Iceberg Database: 2003, Canadian Hydraulics Centre website, www.chc.nrc.ca.
Hill, B., 2004, Ship-Iceberg Collision Database, Institute of Ocean Technology, (IOT,
iot-ito.nrc-cnrc.gc.ca)
Rudkin, P., 2005, Comprehensive Iceberg Management Database Report: 2005 Update, report ESD2005-0331by Provincial Airlines Ltd. to the Canadian Hydraulics Centre.
Singh, S., Green, S., Ennis, T., Comfort, G., and Davidson. L., 1998, PERD Iceberg Database
for the Grand Banks Regions, Canadian Hydraulics Centre website, www.chc.nrc.ca.
Singh, S., Li, X., and Comfort, G., 1999, PERD Grand Banks Iceberg Database Update,
Canadian Hydraulics Centre website, www.chc.nrc.ca.
Verbit, S., et al., 2000, 2001, 2002, 2004, 2005, PERD Grand Banks Iceberg Database
Update, Canadian Hydraulics Centre website, www.chc.nrc.ca.
Verbit, S., and Comfort, G., 2006, PERD Iceberg Sighting and Flight Information Database,