Publisher’s version / Version de l'éditeur:
Fire Technology, 36, August 3, pp. 184-219, 2000-08-01
READ THESE TERMS AND CONDITIONS CAREFULLY BEFORE USING THIS WEBSITE.
https://nrc-publications.canada.ca/eng/copyright
Vous avez des questions? Nous pouvons vous aider. Pour communiquer directement avec un auteur, consultez la première page de la revue dans laquelle son article a été publié afin de trouver ses coordonnées. Si vous n’arrivez pas à les repérer, communiquez avec nous à [email protected].
Questions? Contact the NRC Publications Archive team at
[email protected]. If you wish to email the authors directly, please see the first page of the publication for their contact information.
NRC Publications Archive
Archives des publications du CNRC
This publication could be one of several versions: author’s original, accepted manuscript or the publisher’s version. / La version de cette publication peut être l’une des suivantes : la version prépublication de l’auteur, la version acceptée du manuscrit ou la version de l’éditeur.
For the publisher’s version, please access the DOI link below./ Pour consulter la version de l’éditeur, utilisez le lien DOI ci-dessous.
https://doi.org/10.1023/A:1015414827695
Access and use of this website and the material on it are subject to the Terms and Conditions set forth at
Fire resistance performance of lightweight wood-framed assemblies
Bénichou, N.; Sultan, M. A.
https://publications-cnrc.canada.ca/fra/droits
L’accès à ce site Web et l’utilisation de son contenu sont assujettis aux conditions présentées dans le site LISEZ CES CONDITIONS ATTENTIVEMENT AVANT D’UTILISER CE SITE WEB.
NRC Publications Record / Notice d'Archives des publications de CNRC:
https://nrc-publications.canada.ca/eng/view/object/?id=68d881ed-e2c9-45a1-8068-fe7d4c5cc1da https://publications-cnrc.canada.ca/fra/voir/objet/?id=68d881ed-e2c9-45a1-8068-fe7d4c5cc1da
Fire resistance performance of lightweight
wood-framed assemblies
Bénichou, N.; Sultan, M.A.
NRCC-43382
A version of this document is published in / Une version de ce document se trouve dans :
Fire Technology
,v. 36, no. 3, Aug. 2000, pp. 184-219
Fire Resistance Performance of Lightweight
Wood-Framed Assemblies
Noureddine Bénichou and Mohamed A. Sultan National Research Council of Canada
Ottawa, Ontario, Canada, K1A 0R6
Abstract
There are extensive efforts underway around the world, including those by the National Research Council of Canada (NRC), to develop fire resistance models. NRC is currently developing thermal and structural models for lightweight wood-framed assemblies, in collaboration with the Canadian wood industry. These models will be used in NRC’s risk-cost assessment models as well as in the development of fire resistance design equations. To aid the development of fire resistance models, NRC has just completed, as a first step, a literature review on the efforts made to predict the fire resistance of lightweight wood-framed assemblies, with the objective of determining the gaps that need to be filled. This paper presents the results of this literature review, which include: standard versus real time-temperature fire curves, experimental studies, available fire resistance models and design methods and the identification of their limitations, charring of wood, and material properties of assembly components at elevated temperatures.
Key words: Assemblies, behaviour, charring, fire resistance, lightweight, material properties, models, wood.
Introduction
In North America, lightweight wood-framed assemblies are commonly used in residential building construction for their light weight and low construction costs. These assemblies, which form the walls and floors of building compartments, can be required to provide adequate fire resistance in order to maintain building integrity, to reduce fire spread from one fire compartment to another, and to provide for the safe egress of building occupants. The fire resistance can be determined by tests or by calculation models. In testing, a barrier is subjected to a fire test conducted in accordance with procedures outlined in standards. In calculation, fire resistance is evaluated using numerical models or simplified formulas. With the advent of performance-based codes, where compliance with a set of objectives must be achieved, validated fire resistance models have become essential.
For many years, the National Research Council of Canada (NRC) has been developing fire safety models, including those for fire resistance. NRC initiated a collaborative effort with the Canadian wood industry to develop fire resistance models for predicting the behaviour of lightweight wood-framed assemblies. To determine the research and development needs in the area of fire resistance, NRC has undertaken a literature survey of previous efforts to develop fire resistance models. This paper presents the results of this survey covering experimental studies, existing fire resistance models, charring of wood, and material properties at elevated temperatures.
Assessment of Fire Resistance of Wood-Framed Assemblies
To protect a building against the costly consequences of fire, a designer must employ strategies. These strategies include, among others, fire containment. Containment is usually achieved by designing building fire barriers (walls and floors) so that the fire is contained within the
compartment of fire origin for a duration of time; i.e., containment is the ability of building boundaries to withstand exposure to fire for a certain amount of time. This duration, called fire resistance, must be adequate for the fire barriers and the structural elements supporting them. Currently, in North America, the fire resistance of a fire barrier is evaluated by standards used in the fire testing of building materials, namely CAN/ULC-S101-M891 (from the Underwriters' Laboratories of Canada) and ASTM E1192 (from the American Society for Testing and Materials). These tests are used to obtain the time to failure based on fire resistance criteria. These criteria can be manifested in three ways:
• Thermal failure defined as an average temperature rise of 140°C or a local maximum of 180°C on the unexposed face above the ambient temperature;
• Integrity failure defined as flames or hot gases penetrating through the components;
• Stability failure defined as the loss of load-bearing capacity of structural members.
In addition, Appendix D of the National Building Code of Canada3 (NBCC) provides a procedure, called the component additive method, to determine the fire resistance ratings of load-bearing light-frame wood floor and roof assemblies, and load-bearing and non-load-bearing wall assemblies. Appendix A of the NBCC3 also provides ready-to-use tables to determine the fire resistance for specific wall and floor assemblies.
Standard Fires Versus Real Fires
To determine fire resistance, exposures (time-temperature relationships) must be known. There are two types of exposures: standard and real exposures. The following sections explain these exposures in detail.
Standard Fires
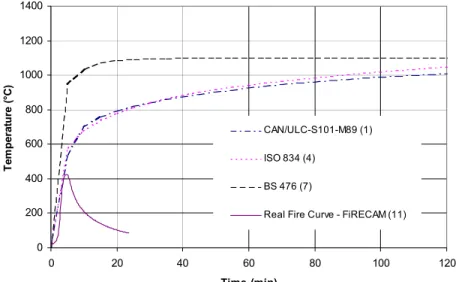
Traditionally, fire resistance is determined by exposing a building component to standard furnace tests. These tests are run until failure of the heated member occurs, based on the failure criteria previously stated. There are many equations governing the time-temperature fire curves for different standards around the world. The following relationship represents the International Standards Organization’s standard ISO 8344 time-temperature fire curve:
1) (8t log 345 T Tg= o + 10 + (1)
where Tg is the average furnace temperature in °C, To is the ambient temperature in °C, and t is the time in min.
In North America, CAN/ULC-S101-M891 and ASTM E1192 provide values that are listed in a table. Several analytical expressions were proposed to approximate the listed values. The following expression is frequently used and reasonably accurate to represent the North American time-temperature curve:5
(
)
(
1-exp-0.49 t)
+22 t 50 7 T Tg= o+ ⋅ (2)In addition, both ASTM and BSI standards specify fire conditions involving hydrocarbon fuels. In the US, ASTM E15296 test methods are used for determining the fire-test response of structural members and fire-containment assemblies that are employed in facilities subject to large hydrocarbon pool fires. In the UK, BS 476: Part 207 specifies the equation below to represent a hydrocarbon time-temperature curve:
(
0.1667t 1.417t 15.833tg 1100 1 0.325e 0.204e 0.471e
T = − − − − − −
)
(3)To show the similarities between the different curves, Figure 1 shows the time-temperature relationships for ISO 834,4 CAN/ULC-S101-M891/ASTM E119,2 and BS 476.7 As seen on the figure, the ISO 834 and CAN/ULC-S101-M89/ASTM E119 curves are very comparable while the BS 476 show a sharp temperature increase, then a constant temperature after that.
Real Fires
Unlike standard time-temperature fire curves, which increase indefinitely, a real compartment fire curve has three distinct phases: a preflashover phase, a fully developed phase (postflashover) and a decay phase. Real fire curves represent a more realistic exposure of building components and are calculated using the heat balance inside a compartment, and the heat transfer through the compartment boundaries. They are a function of many parameters, including the area and height of the ventilation openings, fuel load and lining material. The fuel load is defined as the fuel load in the compartment per unit area of total bounding surfaces. The ventilation openings are characterized by the ventilation factor, F, given as follows:
t w A H A F= (4)
where Aw is the area of openings in m2, H is the height of the openings in m, and At is the total enclosing area in m2.
A number of researchers have formulated equations for real fire curves. In Sweden, Magnusson and Thelandersson8 developed a series of time-temperature curves, known as the
Swedish fire curves, for compartments lined with seven different compartment types with boundaries of different thermal properties. The Swedish time-temperature curves are ventilation-controlled. The length and shape of the decay phase is extrapolated from the test results. In the development of these curves, the authors assume that all energy contained within the fuel is released within the compartment, which is very unlikely to occur.
In the US, Babrauskas and Williamson9 developed a computer program, called COMPF-2, to calculate flashover gas temperatures during a compartment fire. The burning rate in COMPF-2 is governed by the lesser of the ventilation control, fuel surface control, or crib porosity control. Fuel geometry for fuel bed controlled wood fires has a sensitive effect on the shape of the time-temperature curve. The decay phase is very short for ventilation controlled fires and longer for fuel surface controlled fires.
In Canada at NRC, Lie10 formulated the time-temperature relationship of a real fire inside a compartment for both before and after decay phases. In addition, NRC has also developed a fire growth model11 as part of the development of a risk-cost assessment model, called FiRECAM (Fire Risk Evaluation and Cost Assessment Model). The fire growth model generates time-temperature design fires based on the size of the fire compartment, fuel load and ventilation. Figure 1 shows a real curve as predicted by the FiRECAM fire growth model. This curve is different than the standard curves as it grows up to a maximum temperature level and then starts decreasing as the fuel load and air supply decrease.
Concluding Remarks
Although the formulations mentioned above might give an approximation of the shape and magnitude of the time-temperature curves of real fires, there is still considerably more work that needs to be undertaken. This includes the arrangement, size and geometry of the fuel, as well as
the impact of different occupancies. Finally, all these factors require more testing and validation. Of equal importance to the fire community is that the development of real time-temperature fire curves must address the need to gain the recognition of the authorities having jurisdiction and the international standardization bodies.
Studies on the Fire Behaviour of Wood-Framed Assemblies
Wood members can perform and resist well when exposed to fire for a limited period of time. This resistance depends on their size, protection membrane, rate of char and loss of cross-section. Over the years, many researchers have conducted studies on the fire resistance of wood-framed assemblies.
In an effort to incorporate the results of a number of deemed-to-satisfy provisions into the British Standards, Hall12 carried out tests on load-bearing timber stud partitions exposed to a standard fire. Hall stated that the findings represent only a limited number of possible constructions and that further work is required.
NRC has been studying the fire resistance performance of wood structures for many years. In 1960, Harmathy13 conducted a standard test on a non-load-bearing solid wood partition, which failed after 80 min of exposure, due to integrity failure. In the mid 60s, Galbreath14 compiled a large amount of information on the fire resistance of lightweight-framed assemblies exposed to ASTM E1192 or BS 4767 fires. The information, which was scattered throughout the published literature, was prepared for use by designers, manufacturers and building officials in the absence of specific test information. This comprehensive list of test data was then used to develop the NRC’s component additive method that is mentioned later in the section called “Simple Design Methods”. In the 1990s, an extensive NRC-industry experimental program was carried out on lightweight frame assemblies, with the objective of developing new fire-resistance ratings for
these assemblies. Sultan et al.15,16,17 conducted standard fire resistance tests on insulated and non-insulated small- and full-scale wall and floor assemblies protected by gypsum wallboard. This study was able to demonstrate the temperature distributions across the assemblies. This data was used to formulate the fire resistance ratings of a large number of gypsum-protected wood-framed assemblies ranging from 30 to 120 min. The authors also analyzed the effects on the fire performance of these assemblies and studied the impact of a number of parameters upon fire resistance, including insulation, structural load, assembly component dimensions and modes of failure. The authors stated that: rock fibre, installed tightly, increased the fire resistance, whereas the installation of glass fibre or cellulose fibre in non-load-bearing walls did not affect the fire resistance; increasing the number and thickness of gypsum layers increased the fire resistance rating; increasing the thickness alone did not improve the fire resistance rating (FRR), in the presence of resilient channels, however, FRR increased from 25 to 40 min when resilient channels were not present; wood studs provided better fire resistance than steel studs in non-load-bearing walls with a double layer of gypsum on each side; no particular benefits were noticed in using staggered or double row studs instead of single row studs.
Kodur et al.18 reported the results of 10 full-scale fire resistance tests, conducted at the NRC’s Fire Risk Management Program, on load-bearing gypsum wallboard protected, wood-stud shear wall assemblies insulated with glass and rock fibres, with and without resilient channels on the fire exposed side. The gypsum wallboard had a thickness of 12.7 mm and the walls had two possible arrangements: one layer of gypsum on each side, and one layer of gypsum on each side plus a shear membrane on the exposed side. The shear membranes used were plywood and oriented strand board. The authors presented the measurements of the temperatures and deflections and the effects on the fire performance of the walls of the shear membrane, type of shear membrane, insulation type, load intensity, and the resilient channel installations.
The Swedish Institute for Wood Technology Research has conducted a number of studies to assess the behaviour of wood-framed assemblies, with the objective of developing rational models for predicting fire resistance behaviour. Östman et al.19 experimentally investigated the fire protection effect of gypsum wallboard attached to timber-frame assemblies and found that gypsum wallboard protection increases the fire resistance as a function of time and board properties. The authors also determined the fire protection effects of the boards on the load-bearing capacity, deflections and charring depths of the timber frames.
König20,21 reported the results of an experimental testing program conducted on small- and full-scale timber-frame members exposed on one side to the ISO 8344 standard fire curve. The small-scale tests were loaded in pure bending, protected by mineral wool; gypsum wallboard protection was provided in some cases. The gypsum wallboard did not contribute to the strength of the structural members and was added in order to investigate its fire protection effect on the timber members. König measured the material properties, temperature profiles inside the wood and charring depth and found that the degree of charring varies linearly with time at a rate of 1.4 mm/min. The behaviour also shows that the decline in compressive strength is more rapid than that in tensile strength. Full-scale tests were performed on axially loaded walls. Using material properties determined from small-scale tests, König compared the deflection from full-scale test results with those predicted by models developed by König and Källsner22 and found good correlation. One phenomenon in load-bearing wood walls is that the charring of the stud creates an eccentric load. The author suggested allowing the load to move towards the uncharred edge of the stud by assuming hinged support conditions.
König et al.23 studied the load-bearing behaviour of timber structures against the existing requirements for high-rise timber houses in Sweden and Norway. Small-scale fire tests of lightweight specimens subjected to real fires were performed in order to study the structural
behaviour. The specimens were made of wood-based I-beams, protected by gypsum wallboard and insulated with mineral fibre wool. The authors found that when the timber member is fully protected, it can survive a complete burn out. However, the member failed after some period, once ignition and charring started.
König24 reported the results of an experimental investigation of the fire resistance of load-carrying timber-frame assemblies. The assemblies were exposed to fire, following the standard ISO 8344 time-temperature curve as well as to real fires based on Magnusson and Thelandersson’s formulation.8 The authors conducted medium-scale tests on walls and small-scale tests on floors and analyzed the effect of fire curve, load ratio, cavity insulation and linings on the fire performance of the assembly. Rock fibre increased the fire resistance more than glass fibre did. König also identified the failure criterion for fall-off times of gypsum wallboard and distinguished between three phases in the charring process of wood. Using the experimental data of residual cross-sections, the author determined the areas, second moments of area and section modulus of members of assemblies, and, subsequently, a line representing the best correlation with the strength reduction factor. The flexural stiffness was also seen to decrease sharply, especially after calcination of the gypsum wallboard.
Concluding Remarks
For many years, experimental studies of fire resistance have been undertaken around the world. The data from these studies is very valuable as it provides for an understanding of the behaviour of the assemblies when subjected to fire and validates the predictions of fire resistance models. More recent fire resistance testing has included the measurement of the physical and mechanical properties of individual components, which is critical for their use in the evaluation of fire models. However, testing is very expensive and time consuming and, furthermore, there are
major limitations on the availability of data, due to their proprietary nature. Advances in fire resistance research should not be hindered by such obstacles and, as such, the data should be made available whenever possible.
Existing Models
Although beneficial, test methods have many drawbacks, including high cost and time requirements, limitations of the specimen geometry and loading, effect of restraint and reproducibility. Hence, they should only be conducted to validate the outcome of a fire resistance method, to assist in developing new methods, or to permit studies of the effects of variables on the performance of materials. Calculation techniques are becoming more popular and may well serve the needs of performance-based codes, especially where exposures differing from that in the standard test must be considered.
Gammon,25 at the University of California, Berkeley, developed a finite element model to predict the time to failure of load-bearing lightweight wood-framed wall assemblies exposed to the ASTM E1192 fire curve. The model combines heat transfer analysis and structural modelling. The heat transfer analysis does not, though, account for convection inside the wall cavities. The structural model mainly considers the buckling load of individual wood studs as their cross-section is reduced due to charring, hence the contribution of the protective lining to the stability and strength of the assembly is ignored. The author compared the simulation results against experimental published data and found good agreement.
Sterner and Wickström,26 at the Swedish National Testing Institute, developed a two-dimensional heat transfer model called TASEF. TASEF uses a forward difference integration scheme to formulate heat transfer, which includes the convection and radiation across cavities. The model does not allow for either moisture transfer within an assembly or ablation of
the gypsum wallboard. In the model, the thermal inertia and the thermal conductivity are specified as a function of the temperature. Other assumptions include non-consideration of mass transfer and constant emissivities and convection coefficients.
Cuerrier,27 Mehaffey et al.,28 Mehaffey and Takeda,29 and Takeda,30 at Forintek Canada Corp., have been developing a model to predict the behaviour of lightweight wood-stud walls when exposed to the CAN/ULC-S101-M891 time-temperature curve. The model, called WALL2D, is a thermal two-dimensional finite difference computer model validated against a limited number of small-scale and full-scale furnace tests, with good agreement. WALL2D uses thermo-physical properties for gypsum determined from standard bench-scale tests, and thermo-physical properties for wood obtained from the literature. It does not consider moisture migration and assumes zero transmissivity for the cavity gases. The authors have improved the model by including the effect of insulation materials and a new refinement to estimate the radiation heat exchange. Lin and Mehaffey31 used WALL2D to determine the fire resistance of gypsum-protected wood stud walls exposed to simulated office compartment fires.
Clancy et al.,32 at the University of Victoria, Australia, have been developing a model for predicting the behaviour of lightweight timber-framed assemblies when exposed to real fires. The model consists of a finite difference thermal sub-model that performs the heat transfer analysis and a structural sub-model that performs the structural analysis using the stiffness method. The model does not account for moisture transfer and omits plasterboard shrinkage. Comparisons of the model with test data from the literature indicated that the model satisfactorily predicted the temperature distribution throughout the plasterboard and the wood studs, as well as the time to failure, but underestimated the deflections.
Cramer,33 at the University of Wisconsin, USA, developed a numerical model called SAWFT, that predicts the fire endurance of gypsum wallboard-protected wood floor/ceiling
assemblies. The model is a three-dimensional structural analysis tool that calculates the structural performance of wood assemblies based on the degradation of mechanical properties at elevated temperatures. Earlier work on this model was the development of a model for a single truss.34 The model has a heat transfer algorithm that computes the temperature profile inside the wood. The major drawbacks of the model are the limited applicability of the thermal properties and the lack of interdependence between the calculated structural response and the resulting exposure allowed by gypsum wallboard protection. Cramer verified the model prediction against test results and found that the model provides conservative predictions. The author stated that a more advanced heat transfer model and more data concerning the performance of gypsum wallboard protection were needed.
Hurst and Ahmed,35 at the Portland Cement Association, presented a computer program that can be used to predict the thermal response of wood-framed, gypsum wallboard assemblies exposed to the standard ASTM E1192 fire. The model is based on the finite difference technique, couples the heat and mass transfer through gypsum wallboard, and predicts the dependency between the temperature, moisture content and pore pressure within porous media. To validate the model, the authors conducted experimental testing and found the experimental and analytical predictions to be in agreement.
Collier,36 at the Building Research Association of New Zealand, presented a one-dimensional finite difference model for predicting the thermal response of small cavity structural walls exposed to standard and real fires. The model takes into account the thermal and charring behaviour of timber framing. It does not model mass transfer of water or the thermal effects of insulation. In addition, the ablation and pyrolysis of the timber framing products were modelled with limited success. The thermal properties for all materials were obtained from the literature.
The model predictions were verified against fire tests; the model indicated that the onset of charring was earlier than in the test results and the decay phase was not well predicted.
Thomas,37 at the University of Canterbury, New Zealand, studied the behaviour of load-bearing light timber-framed walls exposed to real fires. The author derived a set of time-temperature real fire curves for typical compartment fires using COMPF-2,9 a post-flashover computer program. The thermal behaviour was predicted using TASEF,26 which was calibrated and validated against experimental tests on full- and small-scale specimens. Thomas studied the structural behaviour of light timber-frame assemblies using ABAQUS,38 a commercial finite element program. The author obtained the material properties for wood and gypsum wallboard from the literature. The comparisons between experimental results and the model predictions from the study were good in some cases and poor in others.
Concluding Remarks
To overcome the high cost and time required for tests, computer modelling can be a very useful tool for predicting fire behaviour. To adequately model the behaviour of wood-framed assemblies, material properties at elevated temperatures and the fire conditions must be well defined. Assembly components (wood, lining and insulation) are materials that possess thermal and mechanical properties at elevated temperatures which are not well defined, as will be seen later. Thus, fire resistance models have had limited success in predicting fire behaviour. Although researchers have reported good correlation between their model predictions and test results, most models have been developed with some limitations in modelling both the thermal and structural behaviour. Finally, for models to be of more suitable use, further development and refinement of models, especially of structural models, is needed.
Simple Design Methods
Numerical models may not be suitable for designers who would prefer an easy-to-use design method. Few simple design methods exist around the world. Those that do exist include the fire severity method and the Component Additive Method (CAM).3
Fire Severity and Time Equivalence
In order to evaluate the fire performance of barriers and structural elements, the fire severity in the compartment of fire origin is measured. Fire severity is defined as the equivalent time of exposure to a standard fire and is used to satisfy the fire resistance of building construction elements. Time equivalence can be based on temperature. Law39 originally developed an empirical relationship, which considered the ventilation and the fuel load. Thomas40 modified Law’s equation and incorporated it into the International Council for Building Research, Studies and Documentation (CIB) design guide;40 Eurocode41 uses a similar equation, as follows:
d , f d , e c w q t = ⋅ ⋅ (5)
where te,d is the required equivalent fire resistance in min, c is a parameter dependent on the material of compartment walls, w is a parameter dependent on the areas of boundaries and ventilation, and qf,d is the fire load density per floor area in MJ/m2.
Thomas et al.42,43 investigated the validity of the CIB and Eurocode time equivalent formulas by making use of the models that were used to study the behaviour of load-bearing wood-framed assemblies. The authors found that the formulas consistently underestimated the fire severity values.
Time equivalence can also be based on the normalized heat load concept developed by Harmathy and Mehaffey.44 The concept involves normalizing the total heat load absorbed by a unit area of compartment boundaries over the thermal inertia of the boundaries. The concept is used as a quantifier for the assessment of fire resistance requirements of compartment boundaries in natural fires, based on the standard furnace test. The authors assumed the boundaries as a semi-infinite slab, an assumption that may not be appropriate for thin material such as gypsum wallboard.
Component Additive Method (CAM)
CAM,3 developed by NRC, determines the fire resistance ratings of load-bearing light-frame wood floor and roof assemblies, and of load-bearing and non-load-bearing wall assemblies. The fire resistance rating is obtained by adding together the assigned times of the finish on the fire exposed side, the framing, and any additional protection, such as insulation. These times are provided in tables in Appendix D of the NBCC.3
In light of test results on wood-framed assemblies,15,16,17 Richardson and Batista45 revisited the sections of CAM which are applicable to light-framed walls protected with gypsum board. The authors argued the basis of the time assigned to membranes lining the fire-exposed side of walls. The main question was whether the time assigned was based on the ability of the membranes to stay in place or their ability to insulate the wall studs from temperatures that could diminish their structural performance or a combination of the two. The test results indicated that the times to onset of charring (reduction of cross section) and fall-off of gypsum board were different. The authors also reported that CAM omits to adequately recognize the contribution of the rock fibre insulation to the fire resistance ratings of non-load-bearing wall assemblies.
Concluding Remarks
A few simple design equations and methods exist. The development of these methods is based on a limited number of tests that cover only a specific type of material. Some researchers have shown the inadequacy of the existing equations. In addition, generalizing one formula to represent all material and construction element types may not be realistic. There is a need to confirm what already exists and to establish new design equations and methods for materials and construction elements not covered by the existing formulas.
Charring of Wood
When exposed to heat, wood undergoes thermal degradation. The conversion of wood to char and gas results in a reduction of the density of the wood. The charring rate, a critical parameter in determining the fire resistance of a structural wood member, is defined as the rate at which wood is converted to char. Researchers have suggested different values for the temperature for charring of wood. White and Nordheim46 suggested a temperature of 288°C, Thomas37 reported using a temperature of 290°C, and Lie10 reported a temperature of 300°C. These values, however, are simply SI conversions, with different accuracy, of the temperature of approximately 550 F. Numerous empirical and theoretical models have been developed to account for the charring rate of wood exposed to fire, in standard and real fires. Some of these models are explained in the following sections.
Rate of Charring in Standard Fires
For standard fires, Lie10 reported that ASTM E1192 assumes that the transverse-to-grain char rate is a constant 0.6 mm/min for all woods exposed to the standard fire exposure. Lie also reported that the charring rate parallel to the grain of wood is approximately twice the rate when it is
transverse to the grain. Purkiss47 reported the charring rates found by a number of researchers for several specimen and timber types. These charring rates were constant and ranged from 0.137 to 0.85 mm/min. The assumption of a constant rate of charring is reasonable for thick wood members. For lightweight framed assemblies, the charring occurs in two directions due to two-dimensional heat transfer in the wood. If used, these charring rates should therefore be adjusted to reflect the non-linear charring development in studs and joists of wood-framed assemblies.
Eurocode41 gives the following charring depth:
t
dchar =βo⋅ (6)
where dchar is the charring depth in mm, and βo is the charring rate (usually between 0.5 and 0.8) in mm/min.
Schaffer48 provided the following equations to calculate the transverse-to-grain charring rate,
βo (in mm/min), of different wood species for standard exposure:
(
)
[
28.726 0.578M S 4.187]
forDouglasfir 0.79 β 1 o + + = (7)(
)
[
5.832 0.120M S 12.286]
forSouthernpine 0.79 β 1 o + + = (8)(
)
[
20.036 0.403M S 7.519]
forWhiteoak 0.79 β 1 o + + = (9)where M is the moisture content in %, and S is the dry specific gravity.
White and Nordheim46 established empirical models to define the charring rate of wood when exposed to the ASTM E1192 time-temperature curve. The empirical models were developed
using regression analysis from 40 tests on eight species, assuming the wood as a semi-infinite slab. The authors proposed the following equation for the time-location of charring:
23 . 1 c c m x t = ⋅ (10)
where tc is the charring time in min, m is the reciprocal char rate in min/mm (see Equation (11)), and xc is the distance of char base from the original fire-exposed surface in mm. The American wood council incorporated this model into their new design guide for evaluating the fire resistance of heavy wood members.49
c f 532 . 0 u 0121 . 0 S 564 . 0 147 . 0 m=− + ⋅ + ⋅ + ⋅ (11)
where u is the percentage moisture content in %, and fc is the char contraction factor (see Equation (12)). d S 270 . 0 d c 00164 . 0 c 203 . 0 d 00423 . 0 732 . 0 fc = − ⋅ + ⋅ c − ⋅ c⋅ − ⋅ ⋅ (12)
where d is the depth of the preservative penetration in mm, and cc is the wood classification (1 for softwood and –1 for hardwood).
Janssens and White50 used the charring rate measurement by White51 to verify the validity of the Eurocode 5, Part 1.241 recommended temperature profile in wood members exposed to fire. The temperature profile is based on German measurements of temperature profiles for wood slabs and beams exposed to the ISO 8344 fire curve. The authors found that the temperature profile recommended in the Eurocode41 is consistent with White’s experimental results, and is given as:
2 t c o p o a x 1 ) T T ( T T − − + = (13)
where T is the temperature in °C, Tp is the char front temperature (300°C), and at is the thermal penetration depth (40 mm for a conservative fit, 35 mm for a better fit).
Tran and White52 investigated the burning rates of four selected wood materials as determined by heat release, mass loss and charring rates. The authors tested thick samples of redwood, southern pine, red oak and basswood in a heat release rate calorimeter for heat fluxes ranging from 15 to 55 kW/m2. Tran and White found that the burning rate was species-dependent and increased linearly with heat flux. They also found that the mass loss and charring rates are related to the heat release rate as shown in the following equations:
c H HRR m& ′′= (14) w o ρ m β = & ′′ (15)
where
m
&
′′
is the mass loss rate per unit area, HRR is the heat release rate, Hc is the heat of combustion, ρw is the wood density. Based on Equations (14) and (15) and an empirical formula to obtain the heat of combustion, the authors proposed a simple method for calculating the wood charring rate.Tsanraridis and Östman53 studied the charring rate of wood studs using a cone calorimeter at a constant heat flux of 50 kW/m2. The authors compared the results from the cone calorimeter against those from full-scale furnace wall tests and found similarities between the two methods.
They obtained the following relationships describing the ratio between the charring depths in the cone calorimeter and the furnace versus the exposure time:
boards) (without e 1.997 d d 0.019t furnace char, cone char, = − (16) boards) (with e 1.418 d d 0.015t furnace char, cone char, = − (17)
where dchar, cone is the charring depth from the cone calorimeter in mm, and dchar, furnace is the charring depth from the furnace in mm.
Based on the test results of 55 specimens of 2x4 Spruce-Pine-Fir (SPF) lumber exposed to a constant temperature of 500C, Lau, White and Zeeland54 presented an empirical model of dimensional charring rates for SPF as a function of time, t. The model is given by the following equation: (t) 8 2b 2a -α β(t) o o − + δ = (18)
where β(t) is the charring rate, α is the average rate of change of the residual area (-1.628 mm2/s), ao and bo are the initial uncharred cross-sectional dimensions, and δ(t) is the total depth of char measured from one side and given by Equation (19) below.
(
)
(
)
2 1 -2 o o o o a b 16 1 4 αt -b a 4 1 δ(t) + + + = (19)The dimensional charring rates were found to be consistent with the results of experiments found in the literature. In addition, Lau et al. used a lognormal distribution to characterize the variability of the area charring rate among the specimens tested and incorporated the effect of variable temperatures into the model.
Rate of Charring in Non-Standard Fires
The charring rate in real fires depends on the severity of the fire to which the wood is exposed. In turn, the fire severity depends on the fuel load and the ventilation factor. Hadvig55 reported detailed information and extensive studies on the charring of untreated wood when exposed to real fires. The following are the equations developed by Hadvig:
3 / t 0 for t dchar =βo× ≤ ≤θ (20) θ ≤ ≤ θ θ − θ − β = 0.75t for /3 t 12 t 5 . 1 d 2 o char (21)
where θ is a parameter given by Equation (22).
F q 0175 . 0 × t,d = θ (22)
where qt,d is the fuel load per unit area in MJ/m2.
Mikkola56 also developed a simple model for charring of wood, based on experimental results. The author found that factors affecting the charring rate include wood density, moisture content, external heat flux and oxygen concentration. Compared to experimental data, the model
was found to be useful for calculating the charring rate, given below, for practical wood structures.
(
p p o v)
n o L ) T T ( c q + − ρ = β (23)where qn is the net heat flux to char front, ρ is the density, cp is the specific heat, and Lv is the heat of gasification of wood.
Concluding Remarks
Charring is the process of the formation of a layer of char during exposure of wood members to fire. The charring layer is assumed to have no strength to resist any applied forces, and is mainly supported by the uncharred portion of the wood. The main properties affecting the charring of wood include density, moisture content and contraction of the wood. There are many charring models available, however, only those that predict good agreement with qualified measuring tests are appropriate for use.
Thermal Properties at Elevated Temperatures
In order to develop heat transfer models, building material properties must be defined. The material properties are affected by temperature, moisture content, density and grain orientation. Building materials can be classified as load-bearing, load-bearing/insulating or insulating.57 Thermal properties are important for the insulating and load-bearing/insulating classes. The thermal properties include thermal conductivity, specific heat and density. Many researchers have reported values for these thermal properties, either based on experimental tests or on values
that best correlate with numerical analysis. Some of the data reported in the literature is presented below.
Thermal Properties of Wood
Thermal conductivity:
Figure 2 shows the thermal conductivity for wood as determined by a number of researchers. As shown, most of the researchers agree that thermal conductivity starts increasing initially up to a temperature ranging from 100°C to 200°C, then decreases linearly between 100°C and 350°C, to finally increase after 350°C. Although the trend is similar, the data values are scattered and it is very difficult to determine a mean curve. The scatter is due to differences in species, wood density, moisture content. The scatter is also due to the methods used for obtaining the data. Cuerrier27 and Takeda and Mehaffey29 used values derived from the literature. Gammon25 derived a formula by combining two equations found in the literature. Thomas37 used a curve that provided a good calibration with measured temperatures within wood-stud assemblies. Harmathy57 reported measured thermal conductivity data. Finally, Janssens60 calculated the conductivity based on wood oven-dry density and moisture content.
In addition, The Forest Products Laboratory Wood Handbook58 provides the following temperature-independent equation (for temperatures around 24°C) for thermal conductivity, which is derived based on measurements made by several researchers on a variety of species.
(
0.1941 0.004064M)
S 0.01864kw = + + (24)
Brown59 reported that the thermal conductivity of pine was equal to 0.13 W/m°C between temperatures of 100°C and 200°C. For charcoal, Brown indicated a constant value of 0.22 W/m°C.
Specific heat:
Figure 3 presents the specific heat for wood versus temperature, as reported by a number of researchers. As was the case with conductivity, the data is scattered due to differences in species and moisture content and it is difficult to try to apply the data reported for model development, as there is little consistency in the reported findings. These differences can also be attributed to the methods used to obtain the data. Gammon25 modeled the specific heat using three different equations for representing different ranges of temperatures. Harmathy’s57 curve is based on experimental data using the Differential Scanning Calorimeter (DSC). Data for Lie10 and Janssens60 are derived from the literature.
Thomas37 reported the following equation, used by Gammon,25 Janssens60 and Mehaffey et al.,28 to determine the specific heat of wood:
∆c
M
1
M
4187
T
b
a
c
pw
+
+
+
+
=
(25)where cpw is the specific heat of wood in J/kg°C, a and b are coefficients given in Table 1, M is the moisture content (kg/kg), and ∆c is the moisture correction (used by Janssens60 only) and given by Equation (26) below.
(
23.55T-1326M 2417)
MThe Forest Products Laboratory Wood Handbook58 reported the following equation for specific heat of dry wood as a function of temperature, in K, for temperatures between 7°C and 147°C:
(
0.1031 0.003867T)
cpw = + (27)
Gammon25 reported a number of equations that cannot be reproduced in this paper due to lack of space; details can be found in his report. Table 2 presents some of the equations reported by Gammon.
For char of wood, Janssens60 used Equation (28) to determine the specific heat of char, cpc. The author assumed wood properties for temperatures less than 200°C and char properties for temperatures greater than 800°C. For the range in between, the author used a linear interpolation. Mehaffey et al.28 used a specific heat of char of 0.69 kJ/kg°C after 350°C:
3 c 7 2 c 4 c pc 714 2.32 T 8 10 T 3.69 10 T c = + ⋅ − ⋅ − ⋅ − ⋅ − ⋅ (28)
where Tc is the temperature of char in °C.
Density:
In general, wood density ranges from 300 to 700 kg/m3. Janssens,60 Lie10 and Takeda and Mehaffey29 reported similar values for the density ratio for wood versus temperature, as shown in Figure 4. The density ratio drops to a value between 0.9 and 0.95 at 200°C, then a sharp decline
follows, reducing the density to about 0.2 at approximately 350°C. After this point, the wood maintains an almost constant density.
Moisture content in wood:
As wood starts heating up, moisture evaporates. Mehaffey et al.28 assumed that this evaporation occurs between 100°C and 120°C, while Janssens60 assumed that it occurs between 100°C and 160°C.
Thermal Properties of Gypsum Wallboard
Gypsum, a name commonly used for calcium sulphate dihydrate, is a crystalline mineral that contains chemically bonded water and a small amount of free water. Gypsum wallboard is a sheet product consisting of a noncombustible core with paper-laminated surfaces. The formulation of the core varies from one manufacturer to another. The water inside the gypsum plays a major role in defining its thermal properties and its response to fire. As the gypsum wallboard is exposed to fire, the water is released and absorbs a considerable amount of heat. Hence, the gypsum wallboard protecting wood-frame assemblies retards the failure of the assembly until the drying process of the gypsum is complete. Since gypsum wallboard is a major part of a fire resistant assembly, it is essential to define its thermal properties.
Thermal conductivity:
Figure 5 shows the reported thermal conductivity of gypsum wallboard versus temperature. The figure indicates that the trend is similar for all studies, but the values reported vary widely. This variation is in part due to the fact that the chemical formulation of the gypsum core varies from product to product, and that the method used to measure or obtain the thermal conductivity may
also differ. The values from Anderson et al.63 are based on measurements conducted using the Transient Hot Strip method, while the values reported by Mehaffey et al.28 and Harmathy57 are from measurements performed at NRC using the TC-31 thermal conductivity meter. The curves shown for Thomas37, Mehaffey et al.28 (as used), and Takeda and Mehaffey29 are modified curves used to provide good calibration between measured and calculated temperatures within wood-stud wall assemblies.
Chemistry and specific heat:
In the process of exposing the gypsum wallboard to fire, it undergoes two endothermic decomposition reactions in which the water within the crystalline structure is removed. In the first dehydration reaction, the gypsum is converted to calcium sulfate hemihydrate as follows:
O H 2 / 3 O H 2 / 1 . CaSO O H 2 . CaSO4 2 → 4 2 + 2 (29)
This reaction starts at about 80°C and finishes at about 120°C. The heat generated by this reaction is equivalent to 112 kJ/kg of gypsum. As seen from the reaction, 75% of the water of crystallization is driven off. In the second dehydration reaction, the gypsum is converted to calcium sulfate anhydrate as follows:
O H 2 / 1 CaSO O H 2 / 1 . CaSO4 2 → 4+ 2 (30)
There is disagreement between researchers about the temperature at which this reaction occurs. Andersson and Jansson63 stated about 210°C, whereas Groves64 stated 300°C. Equation (30) indicates that 25% of the water of crystallization is driven off. Mehaffey et al.28
ignored the heat required to evaporate the water of crystallization in the second reaction. They assumed that all the water evaporates in the first reaction, which requires a higher level of energy.
Figure 6 shows the specific heat of gypsum wallboard versus temperature as reported by a number of researchers. Overall, there is some agreement in the trend, however, the peak values are significantly different. This again is probably due to the difference in the gypsum composition and methods used to obtain the data. While Mehaffey et al.28 and Harmathy57 used values based on experimental tests carried out at NRC using the DSC, Thomas37 calibrated the data with values from the literature to obtain good analytical predictions of temperatures.
Density:
Figure 7 shows the density ratio for gypsum wallboard versus temperature, as reported by Harmathy.57 The gypsum wallboard density ratio is a constant equal to 1, up to 80°C, then there is a sharp drop to 0.95 at 120°C. The behaviour after 120°C is a gradual decrease to 0.9 over a temperature range of 120 to 1000°C.
Ablation:
When material is exposed to fire, thin layers fall off because of chemical and physical changes in the material, i.e., bonding reduction of the material. This process is called ablation. When ablation occurs, the altered material falls off, in the form of a powder, from the unaltered material underneath. Thomas37 reported that ablation occurs at approximately 700°C for normal gypsum wallboard, 900°C for glass fibre reinforced gypsum wallboard and 1000°C for fibre reinforced board.
Fire resistance rating of gypsum wallboard:
The finish rating is an estimate of the thermal response of gypsum. The finish rating is defined as the time for a wood-framing member to reach an average temperature rise of 140°C or a local maximum temperature rise of 180°C above the initial ambient temperature on the surface nearest to fire exposure. For type X gypsum, Veschuroff and Eby65 gave the following formulas for the finish rating: ) 5 7 . 0 to 0 t ( t 40 FR= ⋅ b b = ′′ (31) ) 5 2 . 1 to 5 7 . 0 t ( 15 t 60 FR= ⋅ b − b = ′′ ′′ (32)
where FR is the finish rating in min, and tb is the board thickness in inches.
Thermal Properties of Insulation
Based on experimental results, Sultan et al.16,17,18 suggest that insulation inside lightweight wood-framed assemblies helps delay the onset of wood charring on the fire exposed side and, therefore, the time to failure of the assemblies. It should be noted that, depending on the thermal properties of the insulation material, the onset and progress of charring of the wood member does not vary very much as long as the lining is still providing protection. However, it is of most importance that the insulation material covers the sides of the stud or joist during the entire duration of the fire, including the time after the falling-off of the lining material. The thermal properties of insulation are very important in developing fire resistance models. Unfortunately, only limited data is available.
Thermal conductivity:
Thomas37 and Takeda30 reported the values of thermal conductivity as a function of temperature for rock fibre and glass fibre, based on the best correlation with experimental data, as shown in Figure 8. This figure also indicates that the values reported might not be accurate and that the chemical composition of fibre changes from one country to another.
In addition, König and Norén66 stated that they used values of rock fibre with a density of 30 kg/m3 and a thermal conductivity of 0.040 W/m°C. Gammon25 reported that glass fibre melts at about 815°C.
Heat Transfer Coefficients
In modelling lightweight framed assemblies, heat transfer coefficients are very important. Heat transfer coefficients include the radiative and convective coefficients for different materials and positions. The positions are: the ambient side, the fire side and inside the cavity. Thomas37 detailed the heat transfer coefficient used by different researchers. He also modified some of the heat transfer coefficients found in the literature based on sensitivity analyses and the best correlation with experimental data. The information and formulas are too involved to show in this paper, but are detailed in the Thomas report.37
Concluding Remarks
Thermal properties at elevated temperatures are important for predicting the temperature distribution inside the components of wood-framed assemblies. The process of determining these properties is not easy, especially when dealing with materials such as wood, insulation and gypsum wallboard. Many researchers have defined, through testing or based on the best correlation with model predictions, sets of thermal properties. Furthermore, the available
information describing these properties is scattered because of the different methods used to obtain them; thus the process of choosing accurate properties is difficult.
Membranes or linings such as gypsum wallboard are important because they provide good protection to wood and consequently, delaying the onset of charring of wood on the exposed side and providing the structural elements the ability to withstand the load-bearing forces. The thermal properties of gypsum wallboard are fairly well defined; however, additional test data to increase the experimental database and to confirm the existing information would be valuable.
Experimental results suggest that rock and cellulose fibre insulation inside lightweight wood-framed assemblies helps delay the onset of wood charring on the fire exposed side and, therefore, the time to failure of the assemblies. The thermal properties of insulation are very important in developing fire resistance models. Unfortunately, only limited data is available and more information is needed.
Mechanical Properties at Elevated Temperatures
In order to determine the fire behaviour of load-bearing building elements, it is necessary to establish the mechanical properties of these elements at elevated temperatures. For wood, the mechanical properties include strength and stiffness. These properties are affected by temperature, moisture content, rate of charring and grain orientation. As the temperature increases in wood, its strength and stiffness decrease, and some of the moisture in the wood evaporates and some migrates deeper in the wood. The increase in interior moisture content reduces the wood strength and stiffness. The rate of charring reduces the size of the member, leading to faster member failure. In general, at charring temperature, the strength drops to zero. The grain orientation is also important, since the wood is an orthotropic material and the strength
and stiffness in the longitudinal (axis parallel to the grain) and transverse (axis perpendicular to the grain) grains are different.
Stiffness of Wood at Elevated Temperatures
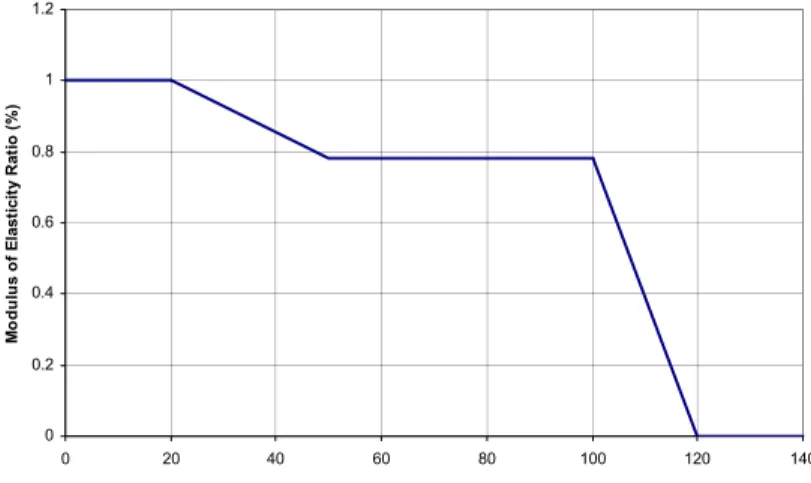
Figure 9 shows the modulus of elasticity parallel-to-grain versus temperature as reported by different researchers. Except for Thomas,37 all researchers reported one set of values for tension and compression. As shown in the figure, Thomas assumed that the modulus of elasticity in compression loses 70% of its strength in the first 120°C. For wood with a moisture content between 0 and 12%, Preusser,67 Lie10 and Janssens68 reported that the modulus of elasticity decreases slowly up to a temperature of 180 to 200°C. After 200°C, the decline is more rapid. Schaffer69 and Thomas37 reported that for the modulus of elasticity in tension, the decline is linear until charring which, according to Gerhards,70 may be unlikely. Gerhards also reported that the modulus of elasticity also decreases by 15 to 20% as the interior moisture content increases from 12 to 28%. In addition, Thomas37 derived the overall shape of the curves that gave good correlation with test results, while the others obtained the data from the literature or from calculation based on published data.
Eurocode 5, Part 1.241 presents the reduced design stiffness, E, as follows:
f , m mean f mod, E k E γ = (33)
where kmod,f is a reduction factor taking into account the thermal effects on the stiffness or strength, Emean is the mean value of modulus of elasticity at normal temperature, and γm,f is a partial safety factor.
Table 3 shows some of the additional equations for modulus of elasticity parallel to the grain, as reported by Gammon.25
Tensile and Compressive Strength of Wood at Elevated Temperatures
Figure 10 shows the strength of wood parallel-to-grain versus temperature for initial moisture contents between 0 and 12%. Schaffer69 predicted a slow decline until approximately 200°C and a rapid decrease after the 200°C value. Knudson72 and Lie10 predicted a linear decrease from beginning to end of the temperature range. Because of the difficulty in quantifying the effect of the moisture content on strength reduction with increasing temperatures, Thomas37 stated that the tensile strength remains constant between ambient temperature and 80°C, then decreases linearly to about 30% of its original value at 295°C, and then drops again to zero at 310°C. The slope of decline changes from one researcher to another. Gerhards70 also showed a decrease in strength ranging between 15 and 25%, as the initial moisture content increases from 12 to 25%. The compressive strength exhibits the same behaviour as the tensile strength, but the decline in compressive strength with temperature is more rapid than the decline in tensile strength. Thomas37 assumed an ambient value up to about 200°C, then a sharp decrease to 0 at 300°C. The slopes of decline are very similar for all researchers except Thomas. Again, Thomas37 derived the curves from calibration with experimental data. The others obtained the data either directly from the literature or based on calculation on reported data.
Eurocode 5, Part 1.241 presents the reduced design strength, ff,d, as follows:
f , m k f f mod, d , f f k k f γ = (34)
where kf is a factor (1.25 for solid timber and 1.15 for glulam and wood based panels) , and fk is the characteristic strength at normal temperature.
In discussing the application of reliability-based design of light structural framing wood members exposed to fire, Lau and Barrett74 formulated, as an example, the reliability of members loaded in tension as a function of the applied load, member initial strength and cross-section, charring rate, and strength degradation (modulus of elasticity and ultimate strength). The authors stated that last two having the most effect. The authors also reported that, for temperatures between –50 and 100°C, the apparent effects tend to be linear for the modulus of elasticity and nonlinear for the strength properties, with more effect on the compressive strength than the tensile strength. In addition, these effects are more prominent in the perpendicular-to-grain direction than in parallel-to-grain direction.
In addition, Table 4 shows some equations for compressive strength parallel to the grain, as reported by Gammon.25
Stress-Strain Relationships of Wood
Stress-strain relationships are important in defining the structural behaviour of load-bearing members. For wood members, there is a need for the development of information, as the amount of information related to stress-strain relationships is lacking. As shown in Figure 11, Thomas37 reported a set of stress-strain relationships and their variations with temperature, based on the best correlation with a large body of test data. More data is also needed to better describe the stress-strain relationships so that more accurate structural fire behaviour can be predicted.
Concluding Remarks
Mechanical properties at elevated temperatures are of prime importance in defining the behaviour of load-bearing wood-framed assemblies and, as such, there is a need to better define these properties. However, as with thermal properties, the mechanical properties of wood are not readily available, and although there is some variation in the information where it does exist, the trend is the same. The variations are due to the difference in species, moisture content and the procedures used to obtain these properties. Although the information is scattered, limited and sometimes based on the best correlation with model predictions, overall, the literature has shown that, as the temperature in wood increases, its stiffness and strength in tension and compression decrease, with a pronounced reduction in compression. As temperature rises, the moisture in the wood evaporates. While some of the moisture is lost in the air, some also migrates deeper into the wood giving it a higher moisture content. This increase in moisture content reduces the wood’s strength and stiffness.
Deformation Properties of Wood
In general, deformation of wood due to high temperatures may be ignored, according to Lie.10 However, wood shrinks over a temperature of 100°C, because the moisture content of wood decreases. The amount of shrinkage depends on the moisture content, species, and grain orientation. Lie reported that the amount of shrinkage can be estimated as 8% in the radial direction, 12% in the tangential direction, and an average of 0.1 to 0.2% in the longitudinal direction. Thomas37 used a total longitudinal thermal expansion of 0.175%, over a temperature range of 0°C to 150°C, in the stud elements. In addition, test values for parallel-to-grain thermal expansion of dry softwoods and hardwoods range between 0.0000031 and 0.0000045/°C.10 The linear expansion coefficients across the grain can range from 5 to 10 times the parallel-to-grain
coefficients. Malhotra78 reported that wood expands up to a temperature of 80°C, with an expansion coefficient of 3.50x10⁻⁶/°C.
Composite Action between Assembly and Gypsum Wallboard
Gypsum wallboard is a component of the assembly that is used mainly to shield the structural wood component from fire. The thermal and mechanical properties of the gypsum wallboard are important for the structure’s ability to withstand load-bearing forces when exposed to high temperatures. Gypsum wallboard may carry some of the load for a limited amount of time, which depends on the mechanical properties (stiffness and strength) of the board. Only limited data is available to describe these mechanical properties at elevated temperatures. Thomas37 reported on some of the data found in the literature, which included the modulus of elasticity and strength for gypsum wallboard. Figures 12 and 13 show the variation of strength and stiffness with temperatures. As shown, the values of both strength and stiffness are reduced to zero at temperatures above 100 to 120°C, where gypsum wallboard becomes brittle. Although gypsum wallboard can provide some load-bearing function, Thomas indicated that this contribution is not significant and may be ignored.
Conclusions, Recommendations and Future Work
This paper presented the results of a literature survey on the research and development of the fire resistance of lightweight wood-framed assemblies conducted by NRC. The conclusions drawn from this survey can be summarized as follows:
Standard fire tests have been used for many years, however, they do not represent real fire scenarios. The introduction of performance-based codes will necessitate the use of real time-temperature curves. Presently, there are some models that can predict real time-temperature
curves in a compartment; these models, however, are limited in their predictions and their use, as they are not internationally approved. Therefore, there is a need to develop recognized models that can provide good predictions of the time-temperature curves inside building compartments.
A number of countries have been conducting experimental studies on the fire resistance behaviour of lightweight wood-framed assemblies. The outcome of these studies is invaluable to the advancement of fire resistance research, as the data is largely unavailable, and this presents a major obstacle to its use. Therefore, there is a need to have more test data available.
In a performance-based code design environment, it is expected that the use of engineering calculations in design will increase. Indeed, the review has revealed that, in recent years, many efforts have been devoted to develop fire resistance models. Fire resistance modelling will also reduce the high costs and time required for fire resistance testing. Therefore, there is a need to develop fire resistance models.
For lightweight wood-framed assemblies, fire resistance behaviour is determined by defining the thermal and structural performance of the assembly when exposed to fires. Thermal behaviour is assessed by estimating the distribution of temperatures inside the assembly. This requires knowing the thermo-physical properties of the different components of the assembly, i.e., wood, lining and insulation, and the information available to describe these properties is often inconsistent. Wood is a material that possesses complex thermo-physical properties, which are not easily defined. The process of selecting accurate thermo-physical properties for wood is difficult. Janssens60 reported that good estimates for such properties, typically, fall in the middle of the range of the values found in the literature. Linings, such as gypsum wallboard, are very important because they provide good protection before the wood starts charring on the fire-exposed side. The thermal properties of gypsum wallboard are fairly well defined in terms of trends. There are, however, differences in values and additional test data is needed to increase the
experimental database confidence. Insulation inside lightweight wood-framed assemblies helps delay the onset of wood charring on the fire-exposed side and, therefore, the time to failure of the assemblies. The thermal properties of insulation are very important in developing fire resistance models, but again only limited data is available, therefore, more data on thermal properties is needed.
The structural fire performance of the assembly is assessed mainly on the basis of the time to structural failure of the wood. The main parameters affecting the structural fire performance of wood-framed assemblies are the rate of charring, degradation of the mechanical properties of the wood, and the load level sustained by the assemblies. Charring in wood is completed at an approximate temperature of 300°C, at which time the charring layer is assumed to have no strength to resist forces. However, the charred layer provides a form of shielding from fire to the uncharred portion; thus, it provides extra time before the uncharred portion starts reaching high temperatures. Many charring models are available; however, model users should choose the ones that were appropriately validated against test data. After partial charring, the uncharred portion carries more load, the wood member starts losing strength and stiffness and the temperature gradient starts increasing rapidly in the uncharred portion. The literature has shown that, as the temperature in wood increases, its stiffness and strength in tension and compression decrease. In addition, as temperature rises, the moisture in the wood is evaporated. Some of the moisture is lost in the air and some migrates deeper into the wood resulting in an increase in its moisture content. The increase in moisture content reduces the wood’s strength and stiffness. The information on the mechanical properties of wood is limited and has shown some variations between different researchers, but the overall trend is again similar. Furthermore, the incorporation of gypsum wallboard to carry some of the load with the wood does not contribute
significantly to increasing the time to failure of the assemblies and may be ignored. This, however, requires further investigation.
Although fire resistance modelling activities have increased in recent years, the fire behaviour of lightweight wood-frame assemblies has not always been adequately simulated. This is partly due to the inaccurate definition of the material properties of the different assembly components. In addition, some models predict only the thermal behaviour, while some others have a strong thermal portion but a simplistic structural portion, and others combine commercially available software to predict the overall behaviour. This literature survey suggests that most of the models have limitations and require more refinement for practical use. The limitations include the lack of modelling of mass transfer of water and water condensation onto cooler surfaces; no modelling of the effects of insulation and ablation of the gypsum wallboard; and the omission of plasterboard shrinkage. Although these limitations exist, many researchers have found that numerical simulations to predict the behaviour of wood-framed assemblies are similar in trend to the test results. Further developments of these models are required.
Modelling can be complex, therefore simplified design methods should be considered. Few design equations and methods exist for predicting the fire resistance of wood-frame assemblies. As in the case of numerical models, these equations and methods have been tested for a limited range of structural material types and fire parameters. More developments and refinement are required in this area, as some of the formulas are limited and their applicability may be questionable in predicting the structural response of lightweight wood-framed assemblies exposed to standard and real fires.