APPLYING LEAN MANUFACTURING
IN AN AUTOMOTIVE STAMPING PLANT
By
Richard J. Welnick
B.S. Aeronautical & Astronautical Engineering University of Washington (1990) Master of Engineering Management Washington State University (1998)
Submitted to Sloan School of Management and the Department of Mechanical Engineering in Partial Fulfillment of the Requirements for the Degrees of
Master of Science in Management MASSACHUSEJ-lSI
OF TECHNOLOG F
and
Z
(
JUL
0
9
2001
Master of Science in Mechanical Engineering
in conjunction with the Leaders For Manufacturing Program
LIBRARIES
at the Massachusetts Institute of Technology May 2001@ Massachusetts Institute of Technology, 2001. All rights reserved.
1
Signature of Author
Department of Mechanical Engineering S)oan S5 ,J.of Management Mav 5 2001 Certified By
"rofessor David S. Cochran, Thesis Advisor Department of Mechanical Engineering Certified By
Professor Charlie Fine, Thesis Advisor Sloan School of Management Accepted By
Ain Sonin Chairman, Departmental Committee on Graduate Studies
Speartment of Mechanical Engineering
Accepted By
Margaret C. Andrews Executive Director of Masters of Business Administration Program Sloan School of Management
APPLYING LEAN MANUFACTURING IN AN AUTOMOTIVE
STAMPING PLANT
By
RICHARD J. WELNICK
Submitted to Sloan School of Management and the
Department of Mechanical Engineering
on May 5, 2001 in Partial Fulfillment of the Requirements for the Degrees of Master of Business Administration
And
Master of Science in Mechanical Engineering
ABSTRACT
Stamping operations are inherently batch processes and therefore are often not as readily adaptable to pull-based manufacturing material flow techniques as other automotive production processes where single-piece flow can be achieved. As a result, until recently Ford Motor Company's efforts to implement synchronous material techniques in its North American plants have tended to focus on assembly lines where there is a natural single-piece flow.
The ultimate goal of pull-based systems is to achieve single piece flow through the manufacturing process wherever possible. While stamping and other batch processes will never economically achieve single piece flow, pull-based lean manufacturing techniques can be applied as a vehicle to improve performance in these facilities.
This thesis will examine the operations of the Wayne Stamping plant and analyze the opportunities for application of lean manufacturing and the challenges to implementation. This project will review current material flow and scheduling practices using the tools of value stream mapping to identify potential improvements. Based on this information, and supplemental research, it will examine a pull-based approach for material flow and recommend a future state.
This thesis will also consider the role of the Ford Production System in this process and its efforts to spread lean manufacturing tools throughout the plants and motivate progress. The Ford Production System uses several approaches to encourage lean manufacturing techniques and these include metrics, coaching, education and assessment. The thesis will also touch on the FPS implementation approach and specifically its role in Wayne's change process.
Thesis Advisors:
Professor David S Cochran
Department of Mechanical Engineering Professor Charlie Fine
ACKNOWLEDGEMENTS
While it is impossible to recognize everyone who has contributed to the success of my internship and the completion of my thesis, I would like to briefly mention several individuals who had a tremendous impact.
First I would like to thank the Leaders For Manufacturing Program, and in particular my thesis advisors Professors David Cochran and Charlie Fine for their support and advice during my internship and this thesis. They provided not only technical advice but also leadership and encouragement. I would also like to thank my fellow LFM classmates, and in particular my Detroit comrades Corey Welch, Quang Nguyen, and Sara Metcalf, for their advice, support and company during our stay there.
At the Ford Motor Company, I would like to thank the Ford Manufacturing Leadership Program for sponsoring the internship and providing access to activities and people that greatly enriched my
experience. In particular, I would like to thank Hossein Nivi and Brian Sullivan for their efforts and time.
I would also like to thank my supervisor Bob Brosko and the Ford Production System group for their time
and willingness to share information. The educational value of this internship was greatly increased because of them. I would also like to thank the managers and employees of the Wayne Integral Stamping
& Assembly Plant who were extremely helpful and patient with my endless questions.
Most importantly, I would like to thank my wife Jennifer for her support not only during this internship but the entire two-year Leaders For Manufacturing Program. She has allowed this experience to be a wonderful adventure.
TABLE OF CONTENTS
ABSTRACT... 3
ACKNOW LEDGEM ENTS... 5
TABLE OF CONTENTS... 7
TABLE OF FIGURES... 9
SECTION 1: INTRODUCTION & OVERVIEW ... 11
1.1 Introduction ... 11
1.2 M otivation... 11
1.3 Background... 12
1.4 Readers Guide To Chapters & Thesis... 13
SECTION 2: PROJECT SETTING AND BACKGROUND ... 14
2.1 Ford M otor Company... 14
2.1.1 Ford M otor Company Culture ... 14
2.1.2 Competitive Environment ... 15
2.2 Ford Production System Overview ... 16
2.2.1 FPS Approach & Execution ... 17
2.2.2 FPS M easurables ... 18
2.3 W ayne Assembly & Stamping Background... 19
2.3.1 Plant Description ... 20
2.3.2 Cultural Issues ... 20
SECTION 3: WAYNE STAMPING OPERATIONS DESCRIPTION... 21
3.1 Stamping Operations Background... 21
3.1.1 Stamping Customers ... 21
3.1.2 Stamping Suppliers ... 22
3.2 Stamping Operations... 23
3.2.1 M anufacturing Process... 23
3.2.2 Facilities Layout and Basic Operations... 24
3.3 M anufacturing Environment ... 26
SECTION 4: VALUE STREAM MAPPING AND CURRENT STATE ANALYSIS...28
4.1 Value Stream M apping... 28
4.1.1 Value Stream M apping Process... 29
4.1.2 Process M aps for W ayne Stamping ... 29
4.2 Current State of Stam ping Operations ... 31
4.2.1 Demand Variation... 32
4.2.2 Scheduling... 32
4.2.3 Batch Size & Inventory ... 33
4.2.4 Overall Equipment Effectiveness ... 36
TABLE OF CONTENTS CONTINUED
4.3 K ey O perational Issues... 38
4.3.1 Downtime ... 38
4.3.2 Schedule ... 39
4.3.3 Changeovers ... 40
SECTION 5: IMPLENTING LEAN MANUFACTURING... 41
5.1 Im plem enting Lean M anufacturing... 41
5.1.1 Elements of Lean M anufacturing... 42
5.2 M aking the Transition... 44
5.2.1 Key Elem ents of Change... 44
5.2.2 Approaches for Implem entation ... 46
5.3 Production System Design and Deployment Framework... 47
5.3.1 Decomposition Description ... 48
5.3.2 Decomposition Evaluation and Results... 49
SECTION 6: PROPOSED FUTURE STATE & IMPLEMENTATION...51
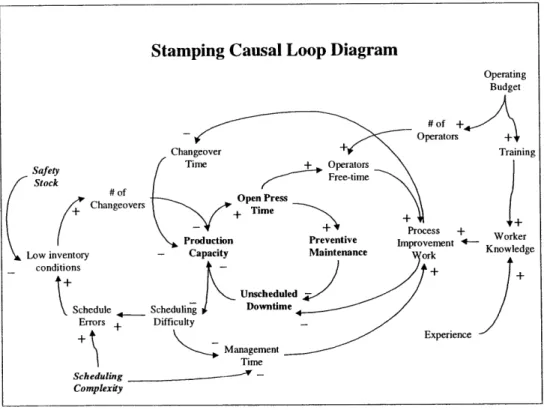
6.1 Proposed Future State ... 51
6.1.1 Future State M ap and Elem ents ... 52
6.1.2 Key Supporting Processes ... 54
6.2 Im plem entation Approach ... 55
6.3 Issues & Challenges to Im plem entation... 57
6.3.1 M etrics ... 57
6.3.2 Organizational Overlap ... 58
6.3.3 Inventory Challenges ... 59
6.4 Sum m ary of Recom m ended Changes... 60
SECTIO N 7: CO NCLUSIO NS ... 61
7.1 Analytical Tools ... 61
7.2 FPS Manufacturing System and Implementation... 62
7.2.1 Lean M anufacturing System ... 62
7.2.2 Implem enting Change within Ford ... 63
7.3 Stam ping Project ... 65
BIBLIO G RAPH Y ... 66
APPENDIX A: CURRENT STATE PROCESS MAPS ... 68
APPENDIX B: INVENTORY AND BATCH DATA ... 71
TABLE OF FIGURES & CHARTS
Figure 2-1, 2001 Ford Focus... 19
Figure 3-1, Wayne Stamping Customer Description... 22
Figure 3-2, Basic Manufacturing Process ... 23
Figure 3-3, Schematic of Wayne Stamping and Operations ... 25
Figure 3-4, Detailed Layout of Stamping Operations... 25
Figure 4-1, Current State Process Map... 30
Figure 4-2, Chart of Batch Size Production for Press Line
1...
34Figure 4-3, Chart of Batch Size Production for Press Line 1 in Days of Inventory ... 34
Figure 4-4, Chart of Days of Inventory by Job for Press Line 1 ... 35
Figure 4-5, Chart of OEE Data ... 36
Figure 4-6, Table of OEE Data by Job ... 37
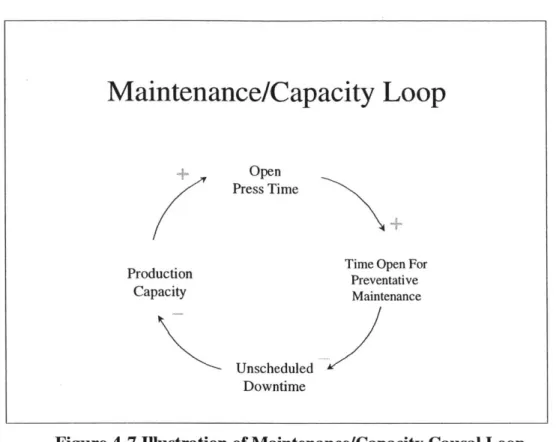
Figure 4-7, Illustration of Maintenance/Capacity Causal Loop ... 39
Figure 5-1, Elements of the Toyota Production System... 43
Figure 5-2, Table of M SDD Results... 49
Figure 6-1, Pull-based Future State Map for Stamping ... 52
Figure 6-2, Stamping Causal Loop Diagram ... 55
Figure 6-3, Transition Approach ... 56
Appendix A, Current State Process Maps For Press Lines Figure A-1, Current State Process Map for Press Line 1... 68
Figure A-2, Current State Process Map for Press Line 2... 69
Figure A-3, Current State Process Map for Press Line 3... 69
Figure A-4, Current State Process Map for Press Line 4... 70
TABLE OF FIGURES & CHARTS CONTINUED
Appendix B, Batch and Inventory Data
Figure B-1, Press Figure B-2, Press Figure B-3, Press Figure B-4, Press Figure B-5, Press Figure B-6, Press Figure B-7, Press Figure B-8, Press Figure B-9, Press
Line 1 Batch Production Data by Piece Count ... Line 1 Batch Production Data by Days of Inventory ... Line 2 Batch Production Data by Piece Count ... Line 2 Batch Production Data by Days of Inventory ... Line 3 Batch Production Data by Piece Count ... Line 3 Batch Production Data by Days of Inventory ... Line 4 Batch Production Data by Piece Count ... Line 4 Batch Production Data by Days of Inventory ... Line 1 Number of Jobs Run Daily ... Figure B-10, Press Line 2 Number of Jobs Run Daily ... Figure B-11, Press Line 3 Number of Jobs Run Daily ... Figure B- 12, Press Line 4 Number of Jobs Run Daily ... Figure B-13, Press Line 1 Total Inventory Maintained Daily... Figure B- 14, Press Line 2 Total Inventory Maintained Daily... Figure B-15, Press Line 3 Total Inventory Maintained Daily... Figure B- 16, Press Line 4 Total Inventory Maintained Daily... Figure B-17, Press Line I Inventory Maintained Daily By Job ... Figure B-18, Press Line 2 Inventory Maintained Daily By Job... Figure B-19, Press Line 3 Inventory Maintained Daily By Job ... Figure B-20, Press Line 4 Inventory Maintained Daily By Job...
72 72 73 73 74 74 75 75 76 76 77 77 78 78 79 79 80 80 81 81
SECTION 1: INTRODUCTION & OVERVIEW
1.1 Introduction
This thesis is based on the work and research that was conducted at the Ford Motor Company in the Wayne Integral Stamping & Assembly Plant as part of an internship project for the Leaders For Manufacturing Program. The internship was sponsored by the Ford Production System (FPS) Group, which is responsible for implementing lean manufacturing within the Ford Motor Company.
This thesis will examine the operations of the Wayne Stamping plant and analyze the opportunities for application of lean manufacturing and the challenges to implementation. This project will review current material flow and scheduling practices using the tools of Value Stream Mapping and Manufacturing System Design Decomposition to identify potential improvements. Based on this information, and supplemental research, it will examine a pull-based approach for material flow and recommend a future state for operations.
This thesis will also consider the role of the Ford Production System in this process and its efforts to spread lean manufacturing tools throughout the plants and motivate progress. The Ford Production System uses several approaches to encourage lean manufacturing techniques and these include metrics, coaching, education and assessment. The thesis will also touch on the FPS implementation approach and specifically its role in Wayne's change process.
1.2 Motivation
Stamping operations are inherently batch processes and therefore not as readily adaptable to lean manufacturing material flow techniques as other automotive production processes where single-piece flow can be achieved. As a result, until recently Ford Motor Company's efforts to implement
synchronous material techniques in its North American plants have tended to focus on assembly lines where there is a natural single-piece flow. While stamping and other batch processes will never economically achieve single piece flow, batch size reduction and pull-based lean manufacturing techniques can be applied as a vehicle to improve performance in these facilities.
This thesis examines the operations of one stamping plant in particular and analyzes the opportunities for application of lean manufacturing and the challenges to implementation. It will also consider the role of other factors such as culture and environment and their affect on the efforts to spread lean manufacturing tools throughout this plant and others within Ford Motor Company.
1.3 Background
The Ford Production System is an initiative of the Ford Motor Company that aims to implement the tools of lean manufacturing throughout its assembly and manufacturing plants. One element of this lean manufacturing system is Synchronous Material Flow or SMF. SMF uses the concept of pull-based material flow to attack both internal and external logistics, reducing inventory and waste wherever possible. Pull-systems, such as Toyota's kanban approach authorize production as inventory is
consumed. This is in contrast to traditional push based systems, such as MRP, that schedule production based on a forecast of demand. [Hopp & Spearman, 2001]
The Wayne Integral Stamping & Assembly Plant offers a unique opportunity to implement lean
manufacturing techniques and material flow within a stamping operation. Since Wayne's stamping, body shop and assembly operations are all located in the same plant, many of the normal issues of logistics are greatly reduced. Since the parts do not need to travel great distances between operations, large inventory buffers are not needed and pull-based kanban processes can more easily be implemented since lead time variation is reduced.
Currently, the stamping operations at Wayne control production using a more traditional scheduling process that plans the day's production, for each of its press lines, based upon the forecasted schedule of its customer. Because of the close proximity between stamping and subsequent operations, Wayne has been able to avoid many of the problems of overproduction that are typical in stamping operations. While it has reduced inventory levels, Wayne has not yet leveraged the opportunity to implement true pull-based material flow between stamping and its customers and reduce the scheduling complexities and corrections that currently exist. Wayne's efforts to reduce inventory before implementing other lean manufacturing principles also raises questions about the implementation of manufacturing systems and the order of implementation. What approach creates success and what impacts has Wayne's implementation process had on operations.
1.4 Readers Guide To Chapters & Thesis
Chapter 1 provides an introduction to the thesis and an understanding of the scope and reason for thesis.
It also provides relevant background to the thesis.
Chapter 2 provides background on the setting for the thesis and important issues affecting it. It provides
an insight into the Ford Motor Company and the competitive environment is faces today. It also
describes the Ford Production System in its current form and gives an overview to the Wayne production facility where the thesis work took place.
Chapter 3 describes the Wayne Stamping facility operations and current management practices. It
provides an overview of the basic material flow and the stamping process involved.
Chapter 4 presents the concept of Value Stream Mapping and how it is applied. It describes how the
Value Stream Mapping Process was used at Wayne and details the operations of the facility through description and data. It also highlights some of the key issues with current operations.
Chapter 5 investigates the topic of lean implementation and compares it with the FPS approach. It also describes the current status of Wayne's implementation using the Decomposition Analysis for
manufacturing systems.
Chapter 6 describes a proposed pull-system and how it might be implemented within the Wayne stamping operations. It will also examine some of the implementation challenges facing this approach.
Chapter 7 examines the findings in light of managerial issues such as metrics and their use in creating
SECTION 2: PROJECT SETTING AND BACKGROUND
While the main emphasis of this thesis is on the manufacturing analysis that was conducted at the Wayne Integral Stamping & Assembly Plant, it is crucial to understand the context and setting where this work was done. To do this it is also necessary to understand the company and major issues that have
influenced the current environment. For this project, the two most relevant influences are the culture and environment of the Ford Motor Company and the implementation of the Ford Production System. The following chapter gives a description of the Ford Motor Company today, explains the Ford Production System and gives an overview of the Wayne Plant as a whole.
2.1 Ford Motor Company Overview
Henry Ford founded the Ford Motor Company in 1903. Today, 98 years later, the Ford Motor Company is the second largest automotive manufacturer in terms of sales revenue and the largest manufacturer of trucks in terms of volume. Ford has operations in 40 countries, operates 114 plants worldwide and employs approximately 248,000 employees in manufacturing operations. Ford recently spun off its component manufacturing operations including 83 plants and 74,200 employees under the name Visteon.
[Ford Motor Company, 1999 Annual Report]
In addition, Ford has diversified into other businesses related to the automotive industry. Ford Credit is now a key component of Ford's strategy, providing financing and leasing to a variety of customers to support Ford's automotive sales. Ford has also moved into several areas of the automotive services industry. An example of this is the acquisition of Hertz rental car in 1987. [Ford Motor Company, 1999 Annual Report]
2.1.1 Ford Motor Company Culture
For a company as large and old as the Ford Motor Company, there is an overwhelming sense of the company's history and legacy within the auto industry. Employees are extremely knowledgeable about the company's history and there is strong sense of heritage among employees. Many in the company have had parents or other family members work at Ford.
Undoubtedly, the sense of heritage is also due in part to the Ford family's active role in the company throughout its history and still today. 109 Ford family members still hold preferred Ford Motor Company stock [Ford Annual Report, 1999] and William Ford Jr. is currently the Chairman of the Board of the company. Additionally, many other family members are actively working in the company today.
2.1.2 Competitive Environment
The competitive landscape of the auto industry has changed dramatically in the past decade. There has been a wave consolidation, through both mergers and acquisitions, in an effort to further reduce costs through even greater economies of scale. To reduce the costs of component manufacture and generate capital, both GM and Ford spun off their component manufacturing businesses as Delphi and Visteon, respectively.
Ford has responded to this consolidation by the strategic acquisition of smaller manufacturers that meet key criteria. These auto-manufacturers have strong customer loyalty and strong brand identity but may have other operational problems in areas that Ford can apply its strengths to create value. Recent acquisitions of this type include Volvo, Jaguar, and Land Rover.
Additionally, Ford has been under pressure from shareholders to improve operational performance in several areas. While Ford has been very successful in North America, it has struggled achieve profitability in other regions such as Europe, Asia, and South America, losing $226 Million in South America alone in 1998. [Sorge, 1999] North American sales accounted for 66% of Ford cars and trucks
sold in 1999 but 73% of the revenues and certainly an even higher proportion of the profits. [Ford Annual Report, 1999] Additionally, within the North American market, Ford is recognized as the leader in trucks
and sports-utility vehicles but has had tremendous difficulty achieving financial success within its car lines. "The bulk of the profits, some experts estimate as much as 60%, come from trucks." [Sorge,
1999] This leaves Ford tremendously vulnerable to an economic downturn or a change such as rising fuel
prices. Additionally, the high profits in this market have attracted more competitors in recent years. Some, such as Toyota, have rolled out entire product families in this category. As a result there is tremendous pressure within Ford to reduce production costs and improve financial performance among both cars and trucks.
2.2 Ford Production System Overview
The original Ford Production System, invented by Henry Ford, revolutionized not only automobile manufacturing, but manufacturing of all kinds. By demonstrating part interchangeability and
implementing the moving assembly line, he was able to take advantage of the division of labor and create economies of scale. [Womack et al 1990] For the first time it was dramatically cheaper to mass-produce manufactured goods. Ford's concept became the foundation on which lean manufacturing was built. In the 1950's and 1960's, the Toyota Motor Company took Ford's mass production techniques and adapted them to the issues facing the Japanese market and competitive environment. That market
demanded more varieties of automobiles in lower volumes to satisfy the needs of the rebuilding economy. To make matters worse, capital was in short supply and labor was strongly regulated by the government.
[Womack et al 1990]
The manufacturing system that evolved is commonly known as the Toyota Production System and was described in detail in The Machine That Changed The World. (Womack et al, 1990) Its focus on defect elimination through continuous improvement techniques such Statistical Process Control (SPC) gained Toyota a reputation for quality products that is unmatched today and permanently altered consumers expectations of the automobiles and products they buy. Additionally, Toyota's focus on inventory management and cost reduction made them the first company to achieve quality and low cost. This breakthrough has made them a formidable competitor. When rising fuel prices in the United States shifted the market demand, Toyota and other Japanese manufacturers were poised to take advantage, and the result was a dramatic reduction in market share for the U.S auto-manufacturers by the early 1990's. In 1995 in an effort to face increasing competition, the Ford Motor Company unveiled a program called Ford 2000, which created a series of initiatives to reengineer Ford's key business processes. One of these initiatives, named Ford Production System, was created to develop a lean manufacturing system, modeled after the Toyota Production System, with a common set of tools and measures that Ford could use to implement and manage the process throughout its plants worldwide. [Kowalski, 1995] It's not unfair to say that many within Ford also wanted to recapture what they believed to be their heritage as the rightful heirs to Henry Ford's original production system.
2.2.1 FPS Approach & Execution
FPS was originally designed with a 5-phase implementation process. The five phases being Operation
Stability, Continuous Flow, Synchronous Production, Pull System, and Level Production. The concept was to build a stable process foundation to build on by implanting tools such as six-sigma, 5S and preventative maintenance. This would allow plants a good understanding of the variation within their processes and hopefully reduce variation levels before they began implementing other lean manufacturing tools and redesigned the flow of their production lines.
In reality, many of the plants have embarked on various pieces of these phases at the same time. Others have begun first with material flow because it creates immediate and visible results that will hopefully spur employees on to further improvement efforts and allow workers to understand their impacts on the production line. Additionally, the Ford Production System has grown beyond the boundaries of lean manufacturing to address all aspects of the manufacturing work environment. The elements of FPS now include:
* Work Groups 0 In-Station Process Control/Quality
* Health & Safety 0 Industrial Materials
* Ford Total Productive Maintenance 0 Managing
* Manufacturing Engineering 0 Training
* Environmental 0 Quality
* Synchronous Material Flow
The responsibility for the FPS process and its implementation lies with the FPS Group. The FPS group is a central group, composed of coaches, auditors and instructors, focused on supporting and stimulating the improvement efforts in Ford's plants. Their strategy for implementation is relatively straight forward: provide training to plant managers and workers on the Ford Production System, support the plants with coaches and subject matter experts, and finally assess and evaluate progress through annual audits of the plants.
The training program is designed to kick-off implementation of FPS at a plant with training for the plant leadership team and then provides classes for hourly and salaried FPS focals on the various tools and levels of the implementation process. Most of the actual class instruction is out-sourced to a training company and this instruction is supported by talks from FPS and Operations Leadership during the courses.
Coaching is concentrated in the area of Synchronous Material Flow, although there are coaches in the other areas of FPS. Each coach is typically assigned to one or two plants and they spend their time
divided between those plants. Their role is to support the identified FPS Focals in the plant, coach, and share best practices. The coaches are typically managers and their main role is working with plant management to create change.
Auditors perform assessments of each of its plants on an annual basis against the FPS elements. Each assessment results in a score, and level for each FPS element and an overall score and level for the plant as a whole. The real goal of these assessments is to encourage the plant management to focus on continuous improvement year to year. It also provides upper management a view of the progress each plant and plant manager is making.
The criteria for the assessment is very well documented, and includes not only the questions and criteria for scoring but examples of the types of systems, documents, actions etc. that the FPS group would like to see in the production system. Typically, each plant has done a self-assessment prior to the FPS group arriving and this is reviewed, as are plant procedures, and the plant operations themselves. A typical assessment lasts one week and results in not only a scoring of the plant, but also recognition of
accomplishments and the identification of opportunities and areas for improvement. There are auditors representing each of the FPS elements, and UAW representatives are also members of the assessment team and FPS group.
2.2.2
FPS Measurables
A key component of the Ford Production System is the metrics used to track performance. These are
known as the FPS measurables. The measurables are intended as a tool to measure the performance of the manufacturing plants in their efforts to implement the Ford Production System and improve
operations. Ford wanted metrics that were quantitative and emphasized physical rather then financial measures. [Kowalski 1996] Since FPS is being implemented worldwide, and it was also important that these metrics were clearly defined and would allow comparison of performance among all of Ford's plants. There are now seven FPS measurables which are described below [FPS, Guidebook for Effective Measurables Overview 1999].
Overall Equipment Effectiveness (OEE) - OEE is a measure of the availability, performance efficiency,
and quality performance of a given piece of equipment.
First-Time-Through (FIT) - FTT is the percentage of units that a complete a manufacturing process the
'ii
Build To Schedule (BTS) - BTS is a measure of the percentage of products that are scheduled that are
produced in a given day in the correct sequence.
Dock-To-Dock (DTD) - DTD is the time between the arrival of raw materials and the release of finished
goods for shipment for a specific control part.
Total Cost - Total cost is the total cost per unit of material, labor, freight, inventory, overhead and other
plant costs.
Safety and Health Assessment Review Process (SHARP) - SHARP is an evaluation of the safety and
health issues and practices at a plant.
Attitude Surveys - various surveys conducted to assess employee opinion on various issues.
2.3 Wayne Assembly & Stamping Background
The Wayne Assembly & Stamping Operations are located in Wayne, Michigan approximately 10 miles west of Dearborn where the Ford Motor Company is headquartered. The plant opened in 1952 and currently covers approximately 3.5 million square feet and employs approximately 4100 employees. Of these roughly 360 are management or salaried and the rest are hourly UAW employees. [Plant Guide,
Blue Oval News 9/21/00]
Figure 2-1 2001 Ford Focus
The Wayne Stamping & Assembly Plant is the U.S. producer of the Ford Focus, pictured above, which it produces in both sedan and station wagon versions. Wayne transitioned from production of the Ford Escort to the Ford Focus during 1999, producing approximately 244,000 total units in 1999. The Ford
Focus is also manufactured in Hermosillo, Sonora (Mexico); Valencia, Spain; Plonsk, Poland; and Saarlouis, Germany. The Ford Focus won the American, Canadian and European awards for Car of the Year in 1999. The demand in North America resulted in an increase of production at Wayne to its current target of 74 cars per hour.
2.3.1 Plant Description
Physically, the Wayne Plant is divided into two separate buildings. The south building contains the Stamping Area and South Body Area. The north building contains the North Body Area, Paint Shop and Final Assembly and Trim Lines.
The South Body Area is responsible for the assembly of the majority of the Focus body structure, while the North Body Area completes the body with such parts as decks and doors. Car bodies are shuttled by conveyor between the South and North Body Areas through an elevated, enclosed tunnel which bridges railroad tracks.
2.3.2 Cultural Issues
The Wayne plant is divided into two distinct cultures. There are two different local UAW contracts in place within Wayne. Wayne Assembly, which contains Wayne's trim lines and paint shop, falls under a traditional union contract. Wayne Integral Stamping & Assembly, which contains Wayne's Stamping Area and Body Shops, on the other hand, are covered by a 'modern' UAW agreement that allows for such activities as job rotation. An example of this is that the Body Shop area is divided into distinct work teams that rotate jobs during the day, including a rotation operating a forklift delivering material to the production line. Ironically, because of the physical plant layout, and the division of the body shops between the north and south buildings, there are actually two different union contracts operating within the same building. These two areas within the north building are under different union leadership and operate as distinct entities in many ways.
Wayne has a strong union culture. An example of the strong union environment is that the UAW bans all foreign vehicles from parking in the general parking lots at Wayne. While this ban is more directed at Ford Motor Company competition, this ban includes vehicles manufactured by companies such as Mazda and Volvo, which although foreign brands are owned and operated by the Ford Motor Company.
SECTION 3: WAYNE STAMPING DESCRIPTION & ANALYSIS
The intent of this chapter is to describe the operations at the Wayne Stamping Plant and give the reader a picture of the environment. This chapter will provide an overview of the basic manufacturing processes and describe the facilities and flow of materials and information that support that process. It will also describe the elements of the work environment that are relevant to the operations and atmosphere within the plant.
3.1 Stamping Operations
The Wayne Stamping Area employs approximately 270 people that include hourly production,
maintenance and material handling jobs, as well as salaried support and management. At the time of this research Wayne Stamping produced approximately 48 different stamped-steel parts that totaled a
scheduled demand of approximately 37,000 individual piece parts per day. These parts are produced on four stamping lines that are supported by one blanker.
3.1.1 Stamping Customers:
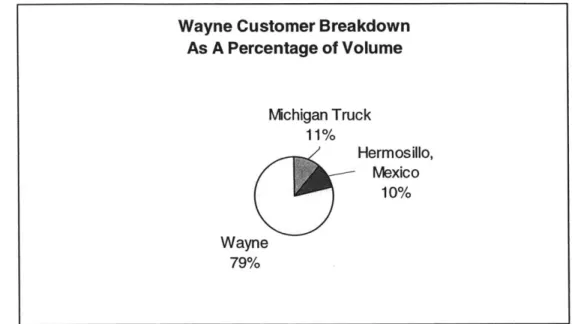
Wayne Stamping has three primary customers that it supplies parts to. The major customer of their production is the Wayne Body production area. Stamping provides parts to both the north and south body shops and accounts for the majority of the Focus body structure produced at Wayne. This includes both sedan and station wagon parts.
Eleven of these parts are also produced in quantities to support production of the Focus at Hermosillo, Mexico. Hermosillo's projected needs are added to the daily production requirements for Focus parts from Wayne Integral Stamping & Assembly. Most of these parts, such as hood inners and outers, are supplied to the Body Areas for assembly prior to shipment to Mexico, but a few parts are delivered directly from Stamping. Parts for Hermosillo are normally delivered by truck.
Additionally, Wayne Stamping also provides door inner and outer parts to the Ford Michigan Truck Plant for use on the Ford Expedition and Lincoln Navigator. The Michigan Truck Plant is located next to the
Wayne Customer Breakdown
As A Percentage of Volume
Mchigan
Truck
11%
Hermosillo,
Mexico
10%
Wayne79%
Figure 3-1 Wayne Stamping Customer Description
Wayne Integral Stamping & Assembly Plant, within the same Ford compound, providing short delivery
times and routes.
As seen in Figure 3-1, the majority of Stamping production is provided to customers either within the same production facility or within the same compound. This close proximity to customers greatly reduces lead-time variation and logistic issues.
3.1.2 Suppliers to the Stamping Operations
There are very few suppliers for the stamping operation. A single distributor, who is located within a few miles of the Wayne plant, supplies steel coils. Logistically, this again provides the plant with several advantages. Coils are usually delivered three times per day, but can be provided more often if necessary. This allows stamping to hold only slightly more inventories then is required for the upcoming shift. Typically one order is placed for the day's deliveries and updated as needed during the day. This provides additional flexibility.
There are also several local manufacturers who provide pre-cut blanks. This compensates for the lack of blanking capacity required by providing outsourced blanks for several of the part numbers.
3.2 Stamping Operations
3.2.1 Manufacturing Process
The manufacturing process in a stamping plant is relatively simple and consists of two basic
manufacturing processes blanking and stamping. Both of these processes use a press and sets of dies to either cut or shape the raw steel. This process is depicted below in Figure 3-2.
In most cases, flat steel is purchased and delivered in large rolls of various widths or lengths depending on the parts being manufactured and the blanking equipment being used. Additionally, the types of steel will be tailored to the needs of the individual parts. These rolls are fed into a blanker, which cuts and stacks flat patterns from the steel. The shape of the flat pattern is designed for the given part to be stamped.
Stacks of these blanks are then transported to the stamping lines and fed into the presses. Once inside the press the flat pattern is squeezed or 'hit' between a matched set of dies to change its shape to match the interior of the die. Depending on the type of press and part shape, the part may achieve its final shape in different ways. The part may need to be transferred through a series of dies, slightly changing
configuration with each hit until the final design is achieved, or simpler parts may need only a single hit to achieve final configuration.
Figure 3-2 Basic Manufacturing Process
Basic Manufacturing Process
Steel
STAMPING
Finished
Both blanking and stamping are fast cycle-time processes. This means that once the process is running for a given part, it takes very little time to complete the manufacturing operation. In other words, once the blanker is running it will cut another flat pattern every few seconds. Similarly, the stamping lines will produce a part approximately every 4-7 seconds depending on the part.
Traditionally, fast cycle time processes have been run in very large batches that maximize the amount of time the equipment was actually producing parts. Since the time to changeover dies for different parts
was very long, switching production to another part meant the equipment was not being used for
significant periods of time. It was considered common sense to reduce setup costs by running the biggest lot size possible. [Monden, 1998]
3.2.2 Facilities Layout and Basic Operations
Figure 3-3 shows a basic schematic of the Wayne Stamping & Assembly building and operations. As described earlier, the South Building contains the stamping operations and south-body production area. Also two warehouses are attached to this building. The bulk of this warehouse space is used to store either finished stamped parts that will be used in the south body production lines or empty racks for these same parts.
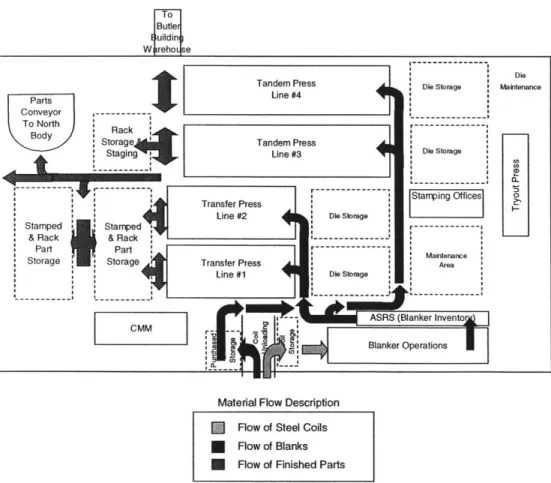
Figure 3-4 shows a detailed layout of the stamping operations in the south building and provides a simplified view of material flow to support the operations. The stamping operations are fairly self-contained and there are two pairs of press lines with equipment and dies stored directly in front of the appropriate press loading area. General maintenance as well as die maintenance is also located directly in the area.
Steel coils arrive from the supplier several times each day by truck. As seen in Figure 3-4, coils would be unloaded and stored directly in front of the blanker. Movement of the blanks is performed by overhead crane. Coils are processed into blanks, stored on pallets and moved into the Murata ASRS (Automated Storage & Retrieval System) for storage until needed. Additional blanks are delivered from outside suppliers to meet the current production requirements that the one blanker is not capable of meeting. These blanks are typically not placed into the Murata system. Instead they are unloaded and stored in their own inventory area from which they would be taken directly to the press lines.
Blanks are typically transported and loaded onto the appropriate press lines via AGV (Automated self-Guided Vehicles), but are also transported by forklift. Press jobs are processed according to a daily
South Body Production Area
North Building South Builc
Stamping Operations
ling
Area Depicted in Layout
Figure 3-3 Schematic of Wayne Stamping and Operations
ToButler
Building
W arehoi se
Tandem Press Die Storage
Parts Line #4
Conveyor
,---To North Rack
Storage Tandem Press
Staging Line #3 Die Storge
- SamigOffices Transfer Press
O
Line #2 1 Die Storage
Stamped Stamped r
---& Rack & Rack
---Part Part r
---Storage Storage Transfer Press Mainteance
Line #1
:
Die StorageA (Blanker Invento
M Blankr Oper p eations
10 1 Die Maitenance
u]
~0
LI]
I-Material Flow Description Flow of Steel Coils Flow of Blanks Flow of Finished Parts
Figure 3-4 Detailed Layout of Stamping Operations.
Assembly Lines
North Body Production Area
schedule that is described in the following chapter. Stamped parts are loaded in racks and transported by forklift to one of four major inventory holding areas or directly to the line if necessary. There is a large holding area near the end of the press lines, which is show in Figure 3-4. There are also two warehouses for inventory depicted in Figure 3-3. The fourth holding area is located in the North Body production area that is also shown in Figure 3-3. Parts for North Body are transported by convey from stamping in the south building to the north building and placed in inventory by fork-lift. The conveyor loading area is depicted in Figure 3-4.
Parts are removed from inventory and transported by forklift or carts and delivered to the appropriate line side location of the body production lines. Delivery is controlled by the production teams and performed
by operators who rotate through a material handling position for a portion of their day. Parts intended for
delivery to Mexico or the Michigan Truck Plant are gathered by Material Planning and Logistics (MP&L) personnel and loaded on trucks for delivery as scheduled.
3.3 Manufacturing Environment
The manufacturing environment at the Wayne stamping facilities is not what the average person might expect from such a facility if they had not been to one. The stamping area of the plant is a high-bay section with high ceilings of approximately 60-ft. Despite the large stamping lines and supporting equipment, the area is very open, well lit and fairly clean. While there is noise from the operating stamping presses, it is not overwhelming. Operators where hearing protection to prevent long-term hearing damage.
Employees in the stamping area tend to be middle-aged and very experienced. Most have been at this stamping facility since it opened approximately twelve years ago and have been employed by Ford for much longer. The management in this area also fits this same profile. They are experienced and
knowledgeable about stamping operations and the stamping business. To put is simply, stamping is their career.
The stamping area is typically scheduled to operate on a 6.5 day / 24 hour schedule with 3 shifts. This means that the presses would be operating 24 hours a day for 6.5 days of the week other then
production. Operators work in three shifts of 8 hours each and work overtime to cover the additional 1.5 or production scheduled for the weekends.
In reality, production is often going 7 days per week, 24 hours a day to keep up with the demand of the assembly line which is normally operating two 10 hours shifts 5 days per week. The pressure to keep up with the line is constant and maintenance is only performed when a stamping line has gotten ahead of the production demand, or when equipment is already down because of process or equipment issues.
Overtime is taken for granted and occurs almost daily for the operators. In addition to the weekend shifts, overtime is necessary during the week to cover absences or help with equipment issues. Since there are very few salaried and management employees supporting the constant operations, long hours and working weekends are also considered the norm for them. At the time of this research, in July 2000, it was not unusual to find salaried workers who had worked every weekend of the year to that time.
SECTION 4: VALUE STREAM MAPPING AND CURRENT STATE ANALYSIS
The intent of this chapter is to fully describe all aspects of the current operations at the Wayne Stamping Plant. This will be done through qualitative descriptions of the processes and decision making,
quantitative data presentation, and analysis of the current operating methods. The bulk of the data used in this chapter was collected during August and September of 2000 at the Wayne Stamping facility.
Additional work and data collection was done between October and December, and some of this material is included as well.
This chapter will describe the value stream mapping process that was used to analyze operations and discuss the value stream map for Wayne Stamping. It will present the data collected, describe management processes and discuss the key findings.
4.1 Value Stream Mapping
The Value Stream Mapping process is a technique that was developed by Mike Rother and John Shook in the Lean Institute and documented in their book, Learning to See, Value Stream Mapping To Create Value and Eliminate Muda, 1998. This process provides techniques to map and document the key elements of a manufacturing enterprise, the inter-relations of these elements, and their current operating characteristics. This provides a framework to analyze the performance of the system, look for
opportunities and design a better manufacturing system.
There are several goals of the Value Stream process. The first is to give an enterprise view of the manufacturing operation to managers or users of the process. Managers working everyday in manufacturing operation often lose sight of the system they are working within and their role in that system. Mapping the system forces them to step back and consider the entire operation from customer back to supplier. Additionally, upper management and plant managers are forced to assess all the processes and their impact on the value stream they manage.
Another goal is to provide tools and a framework that will allow an organized investigation of the current system, an understanding of its flaws and a process for designing an improved system. The final goal is
to present all this in a way that is simple, easy to explain and graphical. The Current State and Future State Maps provide tools that achieve all these goals.
4.1.1 Value Stream Current State Mapping Process
The process of creating a Current State Value Stream Map is relatively simple and straightforward. The users starts at the customer delivery requirements and work their way backward through the entire process documenting the process graphically and collecting data along the way. This process results in a single page map of the manufacturing value stream and its component processes using simple graphical symbols.
The second step is to dive down and understand the current operations of these individual processes that are working within the larger system. Cycle times, inventory levels, quality levels, and equipment performance data is all collected for the processes involved. Ideally these data are collected at the time the mapping is performed. Actual current inventories that are witnessed should be measured and operating performance should be documented. Depending on the complexity of the processes and the number of parts involved further information may need to be obtained or collected from other sources.
The most important part of the value stream mapping process is documenting the relationship between the manufacturing processes and the controls used to manage these processes such as scheduling and
information systems. Unlike most process mapping techniques that often only document the basic process flow, value stream mapping also documents the flow of material and information within the system. Where is material being moved and stored? What triggers the movement of material from one process to the next? What information and what types are being distributed to manage the process? All these questions must be addressed and documented on the value stream map.
4.1.2 Process Maps for Wayne Stamping
The current state maps that were created for the Wayne stamping operations are described here as process maps. Describing them as process maps was done on purpose. The stamping operations at Wayne support internal customers and do not by themselves represent a value stream. If a value stream map of the Wayne production operations were performed, stamping would be only a single process within the value stream and would be represented graphically as a single process box with inputs and outputs. The process maps for the stamping operations represent a second tier of mapping to detail the operations of
these internal processes. This distinction between process map and value stream map may seem subtle but it is important since it ensures that the greater enterprise and stamping's role within it are not lost.
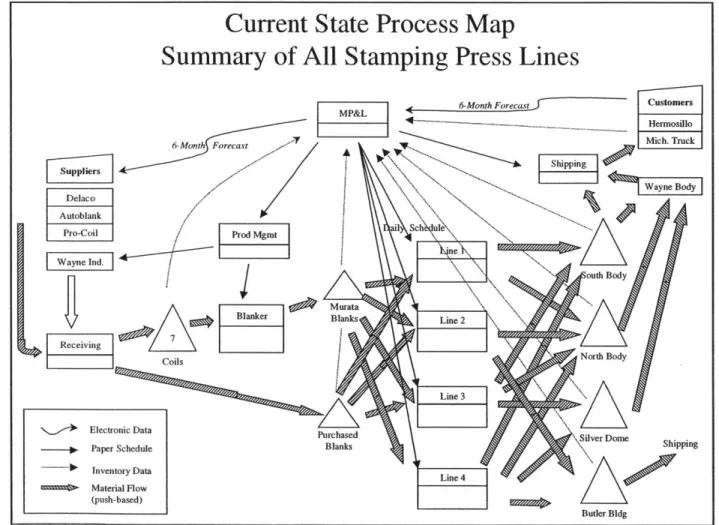
There were several current state process maps created of the Wayne stamping operations. Figure 4-1, below, shows the summary map that displays the material and information flows for all four stamping press lines. This map was also broken down into four individual process maps, each one displaying the
material and information flows for an individual press line. These maps are shown in Appendix A. This was done for two reasons. First the summary map is very cluttered and it is easier to see the actual material flows by breaking them into separate maps. Secondly, the stamping operations tended to be organized by press line with individual work teams running each press, and parts also dedicated to a press line for production. This allowed work teams to make corrections and give feedback on the appropriate maps and data.
Current State Process Map
Summary of All Stamping Press Lines
6-Month Forecast Customers
~-~*.--*
LIilohForecast Mich. Truck
FS__P_11__1*TWayne
Bo Delaco V Autoblank ail Sch ule Pro-Coil Prod Mgmt Wayne Ind. oath Body Murata V BlanksrLBneks Receiving CoilsNorth Body LineElectronic Data Purchased -5Silver Dome
- . Paper Schedule Blanks
~ Inventory Data
Line 4
" Material Flow (push-based)
Butler Bldg
Figure 4-1 Combined Current State Process Map for All Press Lines .jl
As seen in the process map above, various symbols are used to identify different processes. Each triangle represents a separate storage location for inventory. Each double-boxed rectangle represents a process or manufacturing operation that must occur. Lines 1 through 4 are the four stamping press lines and the blanker is also shown. Non-manufacturing processes such as receiving, production management and shipping, are also depicted. While they do not change the product form they are elements of the current process that must occur. Additionally customers and suppliers are depicted. Block arrows represent material flows. Traditional push, or build to schedule, material flows are represented by striped arrows. Pull-based flows are represented by clear block arrows. Information flows are depicted with line arrows. Dashed lines show the flow of inventory information that is collected within the system. A solid line arrow shows the disbursement of the daily schedule by paper throughout the organization. Finally, electronic data transmissions are shown using a wavy arrow.
Typically manufacturing process boxes would also contain data about the operation of that process. For example cycle-time, changeover time, overall equipment effectiveness, and quality would all be
summarized in the process boxes. This information is not displayed for two reasons. First there is again very little room on a single chart. Secondly, it was not always useful to summarize data for a given press line. Whenever possible, it was more useful to use data available based on individual part numbers or jobs that were processed on a given press line. This revealed more of the process variation and insight
into actual operations. The following section details stamping operations and provides this data when appropriate.
4.2 Current State Analysis of Stamping Operations
Value stream mapping is a tool. In this research it was used as a tool to understand the operations of the stamping organization and identify areas for further investigation and data collection. The following sections explain the current state of operations at Wayne Stamping and detail the process used for decision making. It also provides metrics or data on operations wherever possible.
4.2.1 Demand Variation
As in most manufacturing plants production planing is based on the customer's forecasted demand for the product. Variation in the demand or in the lead-time to supply demand can create the need to buffer
production from the demand. It can also result in the 'bull-whip' effect where larger and larger variations in inventory and production responses are transmitted up the supply chain.
Sources of demand variation for the stamping operations come from several areas. The first source of variation arises from their customers' ability to perform to schedule, which is a forecast of actual demand. The primary customer for the stamping area was the body shop, which had significant difficulties hitting its scheduled hourly production targets. This resulted in overtime production Saturdays to try to hit weekly and monthly targets and a fluctuating need for parts from stamping. Additionally, Ford's basic scheduling system is a forecast based traditional MRP (Material Requirements Planning) system. Because of the dependence on forecasting, MRP systems inherently induce additional variation into the production system since the forecast can never perfectly match actual demand. [Hopp & Spearman, 2001] As a result schedule changes or working around the schedule is common.
The second source of variation came for the need to produce additional parts above the scheduled demand that would become service parts for dealers and repair shops. The service part requirements would come in on an irregular cycle and would vary significantly based on orders. This demand would be coordinated with stamping management and siphoned from existing inventories as was deemed feasible. If necessary, additional production parts would be run to cover the extra orders.
The final source of variation was internally created and was caused by inconsistent inventory and production policies. This management approach created variations in the inventory held and the volume produced for a given part on a given day. The following sections on inventory and batch-size will discuss this further and present data to illustrate this issue.
4.2.2 Scheduling
Stamping operations are controlled via a paper schedule that is produced and distributed daily throughout the stamping organization. Each night cycle checkers collect inventory counts of the Work-In-Process inventory or WIP. This count is meant to include completed stamped parts and blanks not only at the designated inventory holding areas, but also along the production lines where parts are stored and fed to the line. These data are manually combined with the customers' scheduled usage numbers for each job to determine the amount (in days) of inventory on hand. Stamping jobs are then sorted based on the
remaining Days-Of-Inventory and scheduled for production that day in order by days of inventory from least to most.
Each morning the production manager receives this schedule, refines it and determines the blanking schedule for that day. Based on the stamping schedule for the day, the current inventory of blanks, and the coils currently in stock a separate hand-written blanking schedule is produced for the day's
production. The schedule provides the job numbers to blank and some level of quantity to produce. This may be an actual production count or a quantity of coils to use. For example, 'blank job 201, two coils'. Operators would then load the appropriate steel coils for that job and cut as many blanks as possible from two full coils. Coils orders for the day are then planned and telephoned to the distributor. There are
several deliveries per day so orders may be updated for the next shifts based on the day's actual production.
4.2.3 Batch-Size and Inventory
Production and inventory data was collected over approximately a one-month period for the blanker and each of the press lines. These data were used to analyze batch size and inventory decisions and
consistency. The data was examined in a variety of ways. Batch sizes were examined by job (part number) both in terms of piece count produced and then normalized by days of inventory produced. Inventory data was examined at the equipment level, as well as by job. Again it was initially examined in terms of piece count production and then normalized by days of inventory available based on the
scheduled daily usage of that part number.
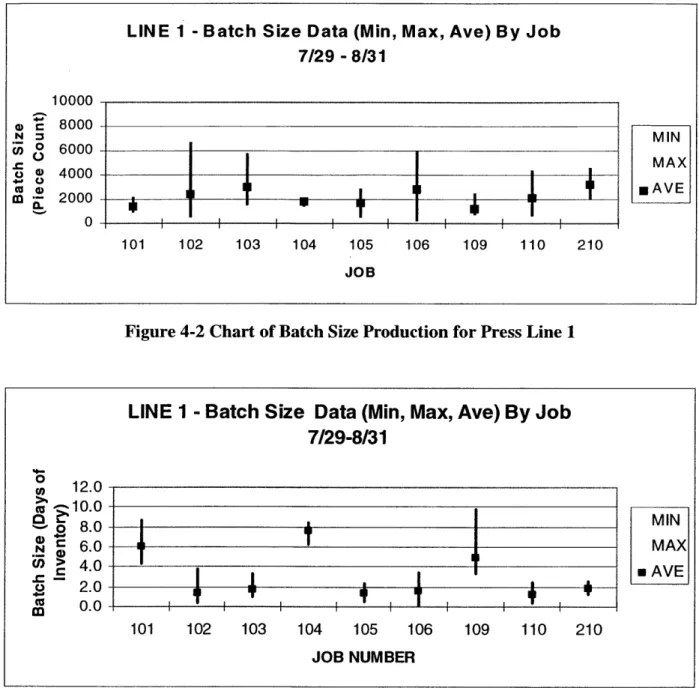
Complete data is available in Appendix B, however the data for Stamping Line 1 is shown below and will be used to describe the data presentation and some of the findings that are typical of the operating policies used to manage production. As can be seen from Figures 4-2 and 4-3, the batch size data is shown for Line 1 broken out by job. The graphs display the minimum, maximum and average batch sizes that were produced during this period. The vertical bars then represent the total range of batch sizes that were produced for a given job or part number during this time. The square data point depicts the average batch
LINE 1
-Batch Size Data (Min, Max, Ave) By Job
7/29
-8/31
- I 101 102 103 104 105 JOB 106 109 110 210Figure 4-2 Chart of Batch Size Production for Press Line 1
0 e, 12.0 Cc 10.0 0 8.0 6.0
2.0
cc
0.0
LINE 1
-
Batch Size Data (Min, Max, Ave) By Job
7/29-8/31
MIN MAX m AVE 103 104 105 1 JOB NUMBERFigure 4-3 Chart of Batch Size Production for Press Line 1 in Days of Inventory
While the raw production count data shows the wide range of batch sizes created for all part numbers. The normalized data gives a much better view of the disparity of volume produced for different jobs taking into consideration the volume required for that part number. Jobs that were produced in large batch sizes, in terms of days of inventory, tended to be low usage part numbers. In other words, a small number of those part numbers were needed daily to support production requirements. These tended to be parts that supported the station wagon model of the Focus, which was produced in much smaller numbers
ao M O -a 10000 8000 6000 4000 2000 0 MIN MAX nAVE 101 102 )6 109 110 210
then the sedan. As seen from the batch size data, these jobs were run approximately once a week. This was done to avoid additional changeovers that would be required to produce these parts in smaller batches. Part numbers required in high volumes were run every day or every other day depending on
recent batch sizes and actual usage.
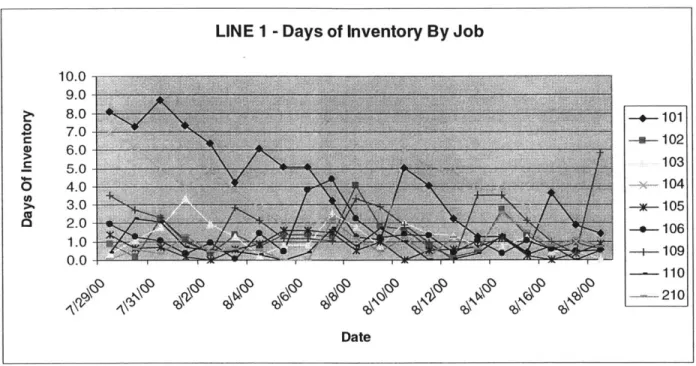
LINE 1 - Days of Inventory By Job
10.0 al----A P' fl 9.0 8.0--o 101 S 7.0 -a-4.102. 0 6.0 7.0 103 0 4.0 . -x-.. 104 5.0 4 .0- _ 104 1.0+- 109 110 40 \
~
0 -210 DateFigure 4-4 Chart of Days of Inventory by Job for Press Line 1
The inventory data during this same period also reflects the operating patterns and decisions discussed above. As seen in Figure 4-4, the large normalized batch sizes produced for certain jobs results in inventory carried for longer periods of time and higher average inventories. What can also be seen from the data is that there is not a standard inventory policy for maximum and minimum inventory carried to support production. On some days, there is no inventory for some part numbers while on other days there is a large inventory of the same part numbers and the inventory fluctuates inconsistently. There are no clear production policies being followed.
Inventory and production policies usually maintain one of several common approaches. Reorder point strategies set a maximum amount of inventory to be held and minimum amount of inventory that includes an appropriate amount of safety stock. Reaching the minimum inventory levels trigger production of this part. Maximum inventory levels would prevent over production. Other approaches include producing a constant size on an irregular schedule as needed to supply demand, or producing variable
batch-sizes on a regularly scheduled production run to meet these same minimum and maximum target levels. The inventory and batch data shows none of these approaches are being used or none of these approaches
are being enforced. There is neither a regular batch size being produced nor a regular production schedule. There is also no evidence of enforcement of minimum or maximum inventory levels on any job.
An examination of the batch size and inventory data in Appendix B shows that the trends and operating policies shown for Line 1 are typical for all of the stamping press lines. Examination of the blanker data shows even more exaggerated examples. Batch sizes tend to be larger and there is more variation in the batch sizes produced. Also the inventory carried is more erratic over time and tends to be higher on average.
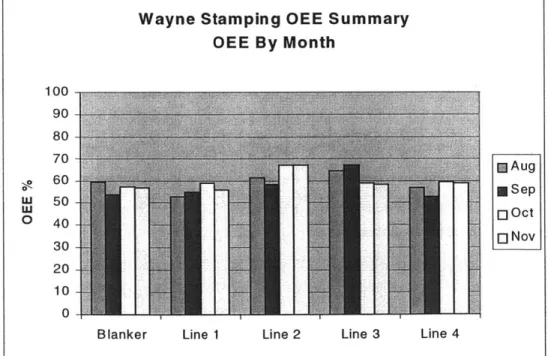
4.2.4 Overall Equipment Effectiveness
Figure 4-5 shows a summary of the Overall Equipment Effectiveness (OEE) numbers for the blanker and each of the press lines by month over a four-month period. These numbers range between 50% and 60% and represent OEE for a given piece of equipment for the entire month. OEE, is a measure of the
availability, performance efficiency, and quality performance of a given piece of equipment [FPS Guidebook etc., 1999].
Wayne Stamping OEE Summary
OEE
By Month
10 90 80 70 ElAugAu 60 *p W 50 Ui Octo
40 Nov 20 20 10 0 Line 4 Line 3Blanker Line 1 Line 2