Can We Reduce Parking at MIT: Design and development of a
functional commuter dashboard
by
Corey L. Tucker
B.S. Civil and Environmental Engineering, Engineering and Public Policy Carnegie Mellon University, 2009
Submitted to the Department of Civil and Environmental Engineering and the Institute for Data, Systems, and Society
in partial fulfillment of the requirements for the degree of
Master of Science in Transportation and Master of Science in Technology and Policy at the
MASSACHUSETTS INSTITUTE OF TECHNOLOGY June 2016
C 2016 Massachusetts Institute of Technology.,AXl Rights Author: ...
Signature
C ertified by: ...
Signature
Reserved.
redacted
May 19, 2016
red acted
John P. Attanucci
\
e arch Associate o il and Environmental EngineeringCertified by: .Signature
Accepted by: ...
Signal
Signat
red acted
Frederick P. Salvucci 5rnior 1,ecturerpf Civil and Environmental Engineering
ure redacted
...
Munther Dahleh Aqting Airector, Technology and Policy Programre redacted
A ccepted by : ... ... Heidi Nepf MASSACHUSETTS INSTITUTE OF TECHNOLOGYJUN 2
0
2016
LIBRARIES
Can We Reduce Parking at MIT: Design and development of a
functional commuter dashboard for MIT
by
Corey L. Tucker
Submitted to the Institute for Data, Systems, and Society and the Department of Civil and Environmental Engineering on May 19,2016, in partial fulfillment of the requirements for the degrees of Master of Science in Technology and Policy and Master of Science in Transportation
at the Massachusetts Institute of Technology
Abstract
This thesis presents the design, development and initial implementation of a new commuter dashboard tool entitled AccessMyCommute for use by all MIT employees. This is the first in a series of new commuter benefit incentives that MIT will introduce during the 2015-2017 academic years to its employees in order to reduce parking demand and to increase campus sustainability. Previous research has suggested that both financial and non-monetary incentives can be effective at encouraging behavior change, and AccessMyCommute leverages that knowledge with the introduction of a number of non-monetary incentives including: real-time trip planning, carpool facilitation, and a leaderboard to exert social influence. The tool also provides a platform for introducing a variety of forms of financial incentives. Quality control and usability studies preceded implementation. Introduction of AccessMyCommute to the MIT community is documented, and a design for the first set of financial incentives is presented. The first set of financial incentives was conducted through the use of Point Programs in
AccessMyCommute and all users were awarded points for their commutes based on levels of sustainability. Those points could then be redeemed for prizes including a small set-value or entries into lottery raffles for larger prizes.
Initial results from the introduction of AccessMyCommute as well as the first point program suggest that in the absence of other incentives, particularly any disincentive to driving, commuters are unlikely to alter their mode. Point programs are effective as an incentive for commuters to log on to AccessMyCommute, but the number of employees participating is small and future work should aim to increase the number of participants. Finally, participation in the initial point program confirmed previous research that suggests that individuals exhibit risk-seeking behavior in the face of uncertain gains. This information should be leveraged in future work with AccessMyCommute, particularly in conjunction with additional new commuter benefits and incentives to be offered by MIT in the next academic year.
Thesis Supervisor: John P. Attanucci
Title: Research Associate in Civil and Environmental Engineering Thesis Supervisor: Frederick P. Salvucci
Acknowledgments
John, Fred, and everyone else associated with MST and with the Transit Lab for taking a chance on me when I was looking for something I was actually interested in doing at MIT.
Matthew, I would not have made it through this without you and our somewhat sarcastic competition to see who could be further behind at all times.
Barb, Ed, and everyone that makes TPP tick. Thank you for dealing with my visits and need to talk to someone about all that is hard about grad school. And for the constant supply of
chocolate...mostly for the chocolate.
Larry Brutti, and the rest of the Parking and Transportation Office. I could not have done this without you. Thank you for all of your help, all of the data, and for constantly telling me to chill out.
Olu Brown, Kevin Lyons, and Eugene Bubis in IS&T. AccessMyCommute would not be online without your help because I certainly could not have done the programming to get all of our data processed week to week. I promise someone will continue to try to fix all the data problems to make your lives easier.
The RideAmigos team. It was a pleasure to work with all of you. Thank you for responding to my constant requests and for going above and beyond to help me accomplish what I needed to in order to get this done.
MIT cycling real and honorary. I could not have asked for a better group of people to call my friends and to get to spend countless hours on bikes and in cars with.
Mom, Dad, Lisa, and the rest of my family for constant support and lack of judgment when I call to tell them any of my crazy ideas for what comes next.
Table of Contents
Abstract...2 Acknowledgm ents...3 Table of Contents...4 List of Figures...6 List of Tables...7 Chapter 1 - Introduction ... 8 1.1 Background/M otivation...8 1.2 M IT asacasestudy ... 91.3 Objectives and M ethodology...10
1.4 Research approach...13
1.5 Thesis Organization...13
Chapter 2 - Literature Review ... 14
2.1 W ebsite Design and Usability ... 14
2.1.1 Design...14
2.1.2 Evaluation ... 15
2.2 Behavioral Econom ics ... 17
2.3 Non-m onetary Incentives ... 21
2.3.1 Short-term initiatives ... 21
2.3.2 Carpool facilitation and benefits... 22
2.3.3 Real-tim e and trip planning information ... 22
2.3 .4 Social Norm s ... 22
2.4 Financial Incentives and Behavior Change ... 23
2.5 Use of Lotteries as Incentive M echanism s ... 24
2.6 Summ ary of Literature Review ... 25
Chapter 3: Dashboard Design and Review ... 26
3.1 Dashboard Design...26
3.1.1. Autom ated com m ute tracking and trip records ... 26
3.1.2. Trip planning tool ... 27
3.1.3. Carpool facilitation ... 27
3.1.4. Lottery and rewards platform ... 27
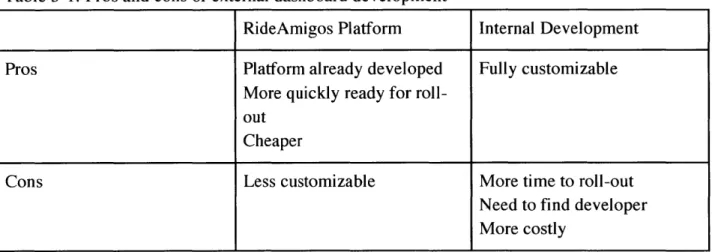
3.2 Dashboard developm ent ... 28
3.2.1. RideAm igos Unity platform and custom ization ... 29
3.2.2 Trip generation logic ... 33
3.3 Dashboard Review ... 36
3.3.1. Quality Control ... 36
3.3.2 Dashboard Usability Review ... 38
3.4 Sum mary...42
Chapter 4 -Incentive Design, Implementation, and Assessm ent ... 43
4.1 Non-m onetary incentives...43
4.1.1. Trip planning with real time inform ation ... 43
4.1.2. Carpool/Vanpool Facilitation ... 44
4.2. Financial Incentives ... 47
4.2.1 Eligible Com m utes ... 48
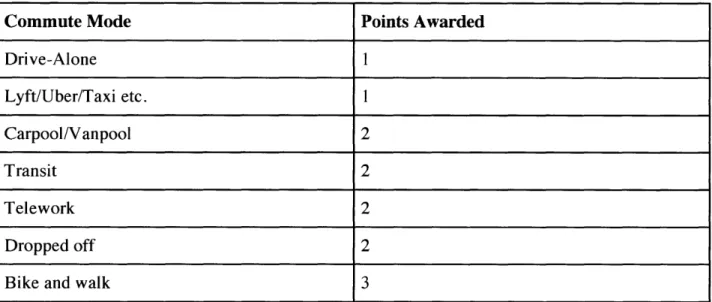
4.2.2. Points Structure ... 49
4.2.3 Rewards ... 50
4.2.4. Paym ent of Rewards ... 57
4.4 Assessm ent of the Initial Dashboard Rollout ... 57
4.4.1 Surveys ... 58
4.4.2. Data Analysis...59
4.5. Summary...62
Chapter 5 - Initial Results ... 63
5.1 Assessm ent of user interaction and perception... 63
5.1.1 Effectiveness of com m unications and rollout ... 63
5.1.2 User Perception...70
5.1.3 Usability ... 70
5.2 Data Analysis...71
5.2.1 Usage ... 72
5.2.2 M ode Share Trends...72
5.2.3 Point Program Participation... 77
5.3 Sum m ary...83
Chapter 6 -Conclusions and Next Steps ... 84
6.1 Sum m ary ... 84
6.2 Next Steps ... 87
6.2.1 Im provem ents to AccessM yCom m ute Interface ... 87
6.2.2 Incorporate social influence as an incentive m echanism ... 88
6.2.3 Com m unity engagem ent...88
6.2.4 Point program s and prizes ... 88
6.3 Im plications for other em ployers... 89
Appendix A: Getting Started with AccessM yCom m ute ... 91
Appendix B: AccessM yCom m ute FAQ ... 94
Appendix C - Survey write-in com m ents ... 96
List of Figures
Figure 2-1 Usability issues by num ber of testers ... 16
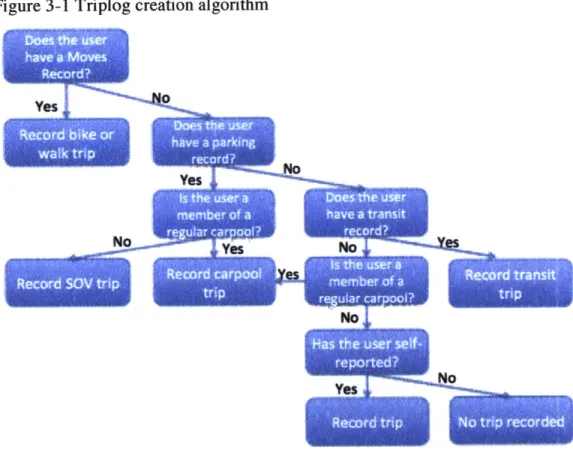
Figure 3-1 T riplog creation algorithm ... 36
Figure 3-2 U sability Review Flow chart ... 38
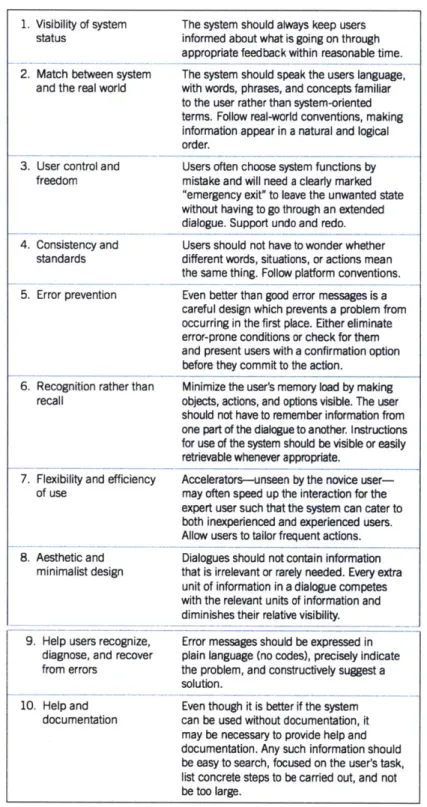
Figure 3-3 N ielsen's Usability Heuristics ... 39
Figure 5-1 Total observed sessions and percent new users during rollout period (February 9 -2 6 ')...6 4 Figure 5-2 How individuals first learned of AccessMyCommute ... 65
Figure 5-3 Total observed sessions and percent new users during point program announcement (M arch 2 1st - A p ril I1")...66
Figure 5-4 Total Access MyCommute Sessions and percent new users ... 67
Figure 5-5 Percentage of users that have redeemed points for prizes ... 68
Figure 5-6 Percentage of users identifying prizes as a major contributor to their decision to log on to A ccessM yC om inute ... 68
Figure 5-7 AccessMyCommrute sessions from the introduction of the point program ... 69
Figure 5-8 Mode share from 2014 MIT Commuter Survey ... 73
Figure 5-9 AccessMyCommute mode categorizations ... 74
Figure 5-10 Estimated mode share from introduction of AccessMyCommute ... 74
Figure 5-1 1 Mode share from February 9 to March 21st. 2016...76
Figure 5-12 Mode share from March 21 to April 29th, 20 16 ... 76
Figure 5-13 Primary Mode of 240 Point Program Participants ... 78
Figure 5-14 Point Program Prize Selection ... 80
Figure 5-15 Individual redemption rates by prize type ... 81
List of Tables
T able 2-1 M indspace ... 19
Table 3-1: Pros and cons of external dashboard development... 28
T able 4-1 Point Structure ... 49
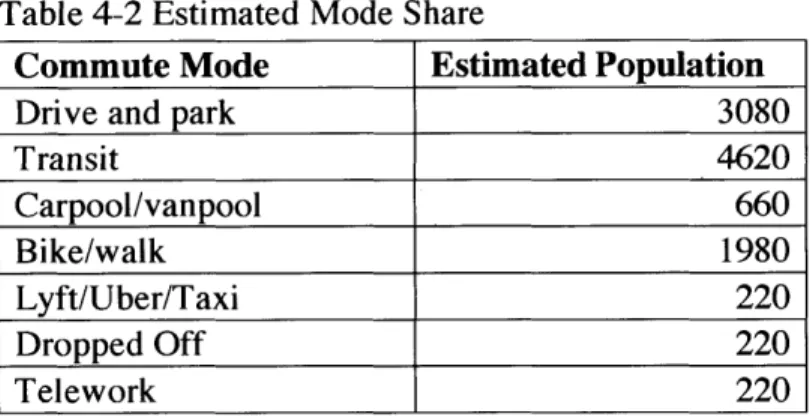
Table 4-2 Estimated Mode Share ... 52
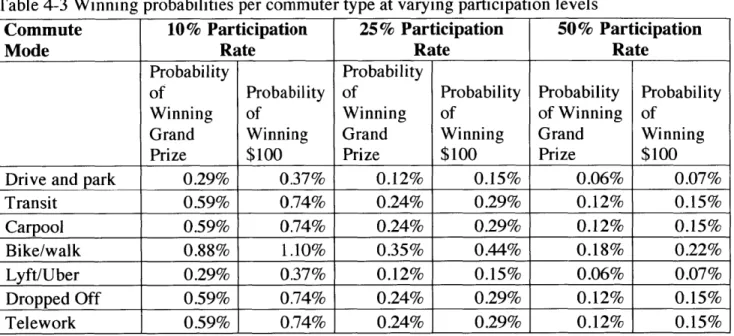
Table 4-3 Winning probabilities per commuter type at varying participation levels...54
Table 4-4 Expected values for set value payout by mode ... 54
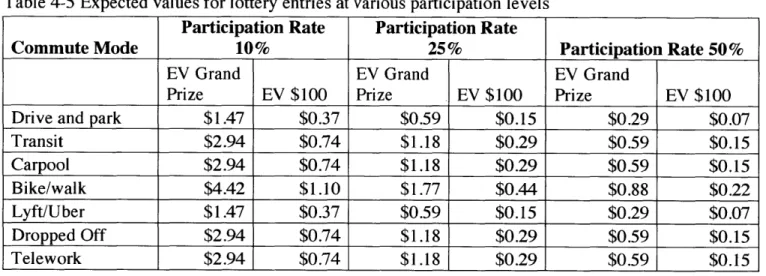
Table 4-5 Expected values for lottery entries at various participation levels ... 55
Table 4-6 Participants choosing a set-value payout (10% overall participation)... 55
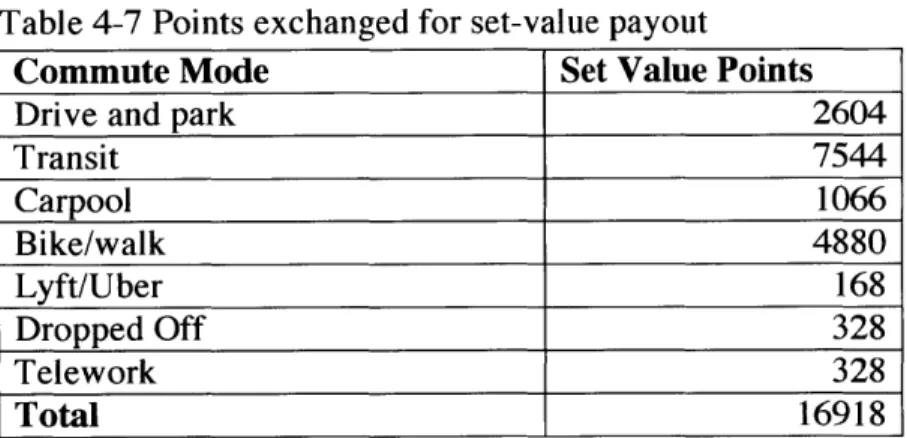
Table 4-7 Points exchanged for set-value payout ... 56
Chapter
1
-
Introduction
This thesis describes the design and implementation of an interactive commuting tool as an incentive mechanism to encourage commuting mode shift away from single occupancy vehicle (SOV) commuting. This type of tool was proposed as a new employer benefit in Emily Gates' master's thesis (Gates, 2015). In this research, the tool was developed and implemented, and early results form its implementation are reviewed to assess employee reactions and early influence on modality.
1.1 Background/Motivation
American cities exhibit the most dependence on car use among major cities worldwide (Kenworthy & Laube, 1999). There are a number of reasons for this, starting with the widespread suburbanization of the mid 2 0th century, which saw the migration of most white-collar workers from city centers to the suburbs (Baum-Snow, 2010). This shift in home locations of a large proportion of the workforce led to a series of patterns that have sustained even as employers and employees begin to move back to central business districts. In the United States, a large proportion of government funding for transportation related projects is spent on highway infrastructure, as opposed to public transit (US DOT, 2013). And employers often offer parking to their employees, either for free or at a heavily subsidized price. These policy choices and norms make sense in an environment where employees and employers are locating outside of core areas, and therefore not concerned about externalities associated with encouraging employees to drive to work everyday, such as congestion and greenhouse gas emissions. This is no longer the situation being faced in the United States, and specifically, in Kendall
Square, a neighborhood located in the city of Cambridge, MA. Large employers are increasingly moving to the Kendall Square area to take advantage of the young, well-educated workforce matriculating from local universities (Chesto, 2016). Property values in central business districts are significantly higher than those in the suburbs and so the costs of continuing to provide
parking to all employees would be very high. Most employers rent parking spaces from real estate developers, who charge set monthly fees at slightly lower than market rate to employers for a guaranteed number of spaces. Employers may then pass some or all of this cost directly to
its employees. By doing this, real estate developers are guaranteed a set amount of income; however, they may miss potential income from market rate parking that they could obtain from
visitors coming to the area for purposes other than work. This is particularly true in Kendall Square, which is a growing social destination for Cambridge residents with shops, restaurants, and entertainment. Many employers offer parking at highly subsidized prices as an incentive to new hires (LAO, 2002). As a result, employees continue to drive their cars to work, creating excessive amounts of congestion in Kendall Square and similarly situated urban centers (Jaffe, 2016). Furthermore, the parking supply in Kendall Square is insufficient to meet increasing
demand at present (S Pollack, 2012). Employers and property developers must consider either building additional parking at high cost or encouraging commutes using alternative modes. Even if additional parking is constructed, the Kendall Square area is geographically constrained by the Charles River, and there is a finite parking capacity that may eventually be reached at which point it will not only be advisable that individuals commute differently, it will be absolutely necessary.
Additionally, the target new hire for most of these companies are recent graduates who are increasingly choosing to live in the core city area, or proximate to it, and commute by means other than single occupancy vehicle (Dutzik & Baxandall, 2013). As such, businesses locating in
Kendall Square, and more broadly in any similarly situated urban area have an opportunity to encourage their employees to commute by means other than personal vehicle in order to reduce
costs for the company, reduce congestion in the area, and reduce contributions to global warming.
1.2 MIT as a case study
The Massachusetts Institute of Technology (MIT) is an example of a large employer located in Kendall Square. MIT employs just over 11,000 individuals at least half time or more, making them benefits eligible (MIT Facts, 2016). Of these, nearly half hold some form of parking permit indicating that they park some or all of the time in MIT parking garages or leased spaces (MIT Parking and Transit, 2015). MIT is an interesting case because it owns much of its parking supply (4000 spaces vs. 300 leased spaces) allowing them to set parking prices independently. MIT is, however, experiencing many of the same problems facing other Kendall Square
employers, namely, parking space constraints. Currently, MIT has two parking garages that have reached the end of their useful life. Additionally, parking demand is growing. MIT has some options to address this issue: renovate the old parking structures, build new underground garages at a cost of nearly $120,000 -$150,000 per space, or try to reduce demand. Although spending money and increasing parking capacity to meet demand is a simple solution, MIT could use that money to fund other university projects such as new lab space or dorms.
As part of Emily Gates' master's thesis work, the utilization of MIT as a case study for improved employer transportation benefits was proposed to the Institute (Gates, 2015). The proposal consisted of three key aspects, that, when combined were anticipated to reduce parking demand at the Institute. The first was a recommended elimination of the annual parking permit and a subsequent shift to charging for parking at all Institute garages on a daily basis. This would reduce the "lock-in" effect of the annual parking permit as parkers would no longer have the sunk cost associated with the permit. Instead, the daily decision of how to get to and from work would become more salient for the commuter that would have to daily consider whether or not
they wanted to pay for parking on campus. The second was the provision of a universal transit pass to all MIT employees. The pass would provide free transit to employees, and would be paid for on a pay per use basis by the Institute. In combination with the shift away from annual
parking pricing, this would provide commuters with a zero marginal cost commuting option, while the marginal cost of parking increased to the new daily parking rate. Finally, it was recommended that the Institute provide employees with a commuter dashboard tool that would provide a trip planner, facilitate carpool matching, and include a platform for the introduction of challenges, games, and lotteries as financial incentives to mode-shift.
After a number of iterations, the decision was made to launch the commuter dashboard, titled "AccessMyCommute", in early 2016. This launch would be followed by introduction of daily parking and universal transit to all employees at the beginning of the 2016-2017 academic year.
1.3 Objectives and Methodology
Previous research in transportation, as well as in other fields such as healthcare and education suggest that both non-monetary and financial incentives can be used to nudge behavior. Non-monetary incentives such as provision of real-time information and trip planning, carpool facilitation and matching, and exerting social pressure and/or leveraging social norms have all been shown to have an influence on behavior. Financial incentives have been used effectively in healthcare to promote both wellness and weight loss (John et al., Gomes et al.). In the field of education, incentives have proven effective at raising student test scores (Levitt et al.). And in transportation, a number of studies from the U.S., India and the Netherlands, have used financial incentives to encourage drivers and public transit users to commute during off-peak hours, thus reducing congestion during the peak (Ettema et al., Pluntke & Prabakhar). Although financial incentives have been employed in all of these contexts with varying levels of success, financial incentives have as yet to be used in an attempt to reduce parking demand by changing
commuter's choice of travel mode.
Although there has been work that employed incentives to change behavior in transportation, the majority of previous research has been focused on shifting travel away from peak periods. This research seeks to apply a similar method to mode shift. This thesis will review the design and implementation of AccessMyCommute at MIT to offer both non-monetary and financial
incentives of varying types and degrees in an effort to reduce parking demand at MIT. In order to facilitate the program, the research team worked with a third party to customize and
implement AccessMyCommute, an online platform to track commuting behavior and implement incentives. AccessMyCommute was populated with trip data obtained from the MIT Parking and Transportation office, the Massachusetts Bay Transit Authority (MBTA), and electively from the Moves trip tracking mobile application that users could download onto their smart
phones. Additionally, self-reported modes were allowed for users for which data could not be obtained from the sources listed above. Financial incentive schemes were conducted through an AccessMyCommute feature called "Point Programs", where points were awarded at designated levels for preferred commute trips (generally non-SOV trips). Those points could then be exchanged for cash prizes or entries into a lottery drawing at the discretion of the user.
In depth study into behavioral economics suggests that individuals do not always behave as expected when making decisions. A number of effects exist that skew human behavior away from the rational (Kahneman et al, 1983). As a result of these effects, it is unclear how
individuals will respond to different types of financial incentives (deterministic vs. lotteries with differentiated payouts and chances of winning), and in fact may differ from individual to
individual based upon each individual's perception of risk. As a result of this, the team offered a variety of different financial incentives including both a set value exchange rate as well as lottery entries for a larger prize drawing. The intent was to develop a better understanding of user
behavior and preferences so that MIT can implement the most effective incentive scheme moving forward.
The methodology for implementing incentives and analyzing the effectiveness of those incentives is as follows:
* Web platform design and implementation
o Design: For the design of the web platform the team worked with a third party developer to modify and further develop their web platform for trip tracking. The customized design seeks to make the tool as user friendly as possible by
eliminating the need for self reporting and automating trip record generation through the use of parking data from the MIT Parking and Transportation office, and public transit data from the MBTA. The tool also integrates the mobile phone app Moves so that users can track their walking and biking trips should they choose to download and use the app. The team designed and implemented an algorithm to create trip records from the data listed above. One trip record is created per user per day to reflect a round trip commute to and from MIT. The logic of the algorithm is discussed in more detail in Chapter 3 - Dashboard Design and Review.
o Quality Control: In order to ensure that the data obtained from the MIT Parking and Transportation office and the MBTA is accurate, and that the algorithm is functioning as expected, quality control testing was conducted prior to making AccessMyCommute available to MIT employees. For this, the team developed a brief questionnaire that was distributed to a sub-group of MIT employees. The questionnaire asked those users to review AccessMyCommute and report on the accuracy of their trip data. Should this review reveal systematic errors, the team
then reviewed the triplog creation process to make edits accordingly. If the triplog creation process was altred in any way as a result of feedback from the questionnaire, an additional quality control check was conducted.
o Usability Review: In addition to quality control, a two level usability review was conducted to ensure that the platform is sufficiently user friendly. The first level
was a heuristic review where a group of transit lab students spent an hour reviewing the dashboard against a set of 10 heuristics defined by Jakob Nielsen (Nielsen & Molich, 1990). These initial reviews informed the second, more formal, moderated usability review conducted with MIT employees. The
moderated usability reviews asked a group of MIT employees to perform a series of tasks while "thinking out loud" with the moderator present to observe the user with the interface and note any issues that arise (Barnum, 2011). Based on these reviews, minor changes were made to the AccessMyCommute interface.
* Implementation at MIT
o Rollout email campaign: An email announcing AccessMyCommute was sent by the MIT Parking and Transportation office to the parking coordinators for each MIT department. This was done over the course of approximately one week, with email distribution to a subset of departments each day. The rollout was conducted slowly so that the team could handle incoming questions and concerns slowly, and so that any initial issues could be identified prior to the dashboard being made available to all Institute employees in the hope that those issues could be
remedied prior to launch to the entire community.
o Point program launch: Approximately a month following rollout of
AccessMyCommute, the team launched the first point program to offer financial incentives in an effort to encourage regular visits and use of the dashboard as well as mode shift away from drive alone commuting. Rewards were offered at three levels: (1) small deterministic cash out, (2) mid level lottery reward with higher probability of winning and smaller buy in, and (3) large lottery reward with small probability of winning and large buy-in. Lottery drawings were conducted once, at the end of the point program. Rewards were distributed following the lottery drawing.
* Analysis
o Survey: A survey was conducted in conjunction with the point program to elicit feedback on reception of AccessMyCommute among MIT employees,
effectiveness of rollout and materials, and attractiveness of the various features including use of the trip planner and point program prizes.
o Mode-shift analysis: Mode share was monitored before, during, and after completion of the point program. That mode share was also compared to
commuting history over previous years to account for variability associated with the time of the year (weather). Because there was not a true control group, past
years populations were used as a control group. To do this, it was assumed that previous years populations of MIT employees are sufficiently similar to the MIT population to which financial incentives were offered so that a time series analysis could be performed to identify any mode shift trends.
o Evaluation of population perception of rewards: By offering multiple rewards during each period including a deterministic prize as well as lottery options, risk aversion and risk seeking among participants was evaluated by analyzing
participation levels in each of the rewards. This information was combined with survey responses to inform recommendations for point program prizes during the future of the program.
1.4 Research approach
This research focuses on the design and implementation of a commuter dashboard at MIT as a case study for utilization of this benefit elsewhere. Although this thesis will explore and analyze first impressions of the dashboard and reactions to the first point program, it will focus heavily on future experiments that should be conducted with the tool now that it is in place.
Furthermore, as the Institute has accepted a proposal for transitioning from annual to daily parking pricing as well as provision of a universal transit pass to employees, this research will consider the future of AccessMyCommute in the broader context of a large-scale change in employee benefits.
1.5 Thesis Organization
This thesis is organized following the outline of objectives enumerated above. Preceding the chapter on experimental design, Chapter 2 will include a review of relevant research literature, including research in human computer interaction and web interface design, behavioral
economics, and the use of incentives to induce behavior change. Following the literature review, Chapter 3 will be devoted to the design and review of AccessMyCommute. Chapter 4 will follow the design chapter, with a discussion of experimental implementation including a full description of the first point program conducted at MIT and the methods for analyzing its reception and success. Chapter 5 will be a full analysis of initial experimental results including user perception, usability of the dashboard, overall mode-shift statistics, and a review of the different financial prizes offered during the first months of the experiment and the reaction to those incentives. Finally, Chapter 6 will offer conclusions about the use of AccessMyCommute to encourage mode shift and will then provide a recommendation for the future of
AccessMyCommute at MIT and it's goals for parking reduction, as well as presenting some key points that will be useful for any other Kendall Square or similarly situated employer considering using financial incentives to achieve parking demand reduction.
Chapter 2
-
Literature Review
This chapter will review research relevant to this thesis beginning with a review of website design standards and usability for both the design and review of AccessMyCommute. It will then review some concepts of behavioral economics that will be critical to designing and
implementing effective incentive schemes at MIT. The review will then turn to a look at the use of non-monetary incentives on behavior change, followed by the use of financial incentives on behavior change. The chapter will conclude with a discussion of some research on the
effectiveness of lotteries specifically as behavioral modification tools.
2.1 Website Design and Usability 2.1.1 Design
Usability is a critical aspect of the design of any website and should be considered throughout the design process. The standard definition of usability provided by the International
Organization for Standardization (ISO) is "the extent to which a product can be used by specified users to achieve specified goals with effectiveness, efficiency, and satisfaction in a specified context of use" (ISO 9241-11, 1998). Further, a study performed by Consumer WebWatch in collaboration with researchers from Stanford University surveyed 2,684 people in an effort to
identify the website features most likely to lend credibility to the site. Of the 16 identified
features, the top two were "Design-look" and "Information Design/Structure" (Fogg et al., 2002). These two features can be mapped directly to the "effectiveness, efficiency, and satisfaction"
descriptors of the ISO standard for usability. This finding further highlights the importance of usability in website design, and suggests that it is THE critical aspect of determining a website's credibility.
Having a working definition of usability is critical to being able to evaluate a website to ensure that it provides a good user experience. Although the ISO definition is concise and easily conceptualized, it does not necessarily lend itself to the development of easily measurable metrics for a usability review. Usability expert Whitney Quesenbery elaborates on the ISO definition to provide a straightforward framework for thinking about usability that she refers to as the 5 E's: effective, efficient, engaging, error tolerant, and easy to learn. Any website should be effective in that it provides users with the information and tools necessary to complete specified goals, those things for which the user would access the website, accurately. It should also be efficient, meaning, it should enable users to not only complete those goals accurately (effective), but it should enable them to complete those goals quickly. The website should be
engaging for the user, they should enjoy using it and want to return. It should exhibit design intended to prevent errors caused by the user and be also able to help users recover from errors that do occur. And finally, a website should be easy to learn, not just at the time of initial launch, but anytime new features are added (Quesenbery, 2001).
2.1.2 Evaluation
Methods to evaluate a website's usability can generally be classified in two ways. The first, is based upon WHEN during the website development process the testing occurs. Testing that occurs during, and possibly ongoing throughout, the design process is referred to as "formative". Formative testing is also generally performed using smaller samples and feedback may be used to make changes to the product during development, before re-testing. In contrast, testing that occurs after the product is complete is referred to as "summative". Summative testing generally has a "goal of establishing a baseline of metrics or validating that the product meets
requirements". It is generally performed with a larger sample, and feedback from summative testing may be archived for future product revisions (Barnum, 2011).
As noted, formative testing generally uses significantly smaller sample sizes than summative testing. Through research on the cost and benefit ratio of usability testing per participant, Jakob Nielsen and Tom Landauer determined that the maximum cost-benefit ratio occurred when testing with between three and five participants as shown in Figure 2-1.
Figure 2-1 Usability issues by number of testers
1000/0
-0
U_75%
-(I)E
ai)
50%
-0
_25%/-I
0/
0%
I
I
I
03
6
9
12
15
Number of Test Users
Image from the Nielsen-Norman Group (https://ww w.nnroup.com/articles/why-you-only-need-to-test-w ith-5-users/)
What their research suggested, as shown graphically in the Figure 2-1 above, is that
approximately 80% of all usability problems are discoverable with five testers, and that above that number you learn relatively little with each new user (Nielsen, 2000)
The second classification of testing methods is based upon WHERE the testing is performed. Traditionally, usability testing has been conducted in a testing lab with specialized equipment and set-up. Available technology is changing this, however, by enabling remote testing through the use of web-cams, computer recording software, and online surveys. There are three main location possibilities for testing: (1) in a lab, (2) in the field -at the user site, and (3) remotely. In the field requires the moderator to travel to the user and perform the testing "in the field". This can be costly because of the potential of required travel, however, there are distinct benefits in that the moderator can see how the user interacts with the website in their environment, including prevalent distractions, etc. Remotely can be synchronous or moderated, with a person
interacting with the user as they complete the test via the Internet, or it can be asynchronous or un-moderated, utilizing computer recording software to record the user's performance of tasks and online follow-up surveys. These methods obviate the costs associated with travel, however, eliminates the possibility of direct observation of the user with the website which may limit understanding of user interaction (Barnum, 2011).
Finally, usability testing can be classified by HOW the testing is performed, or the method of analysis employed. The U.S. Department of Health and Human Services highlights a number of usability evaluation methods including: usability testing (remote -moderated, remote - un-moderated, in a lab, informal), focus groups, surveys, and heuristic evaluation, among many others (usability.gov, 2016). Questions from the "Usability Professionals' Association Salary Survey 2009" regarding techniques, identified usability review and heuristic evaluation as the two most commonly used methods among usability professionals, with heuristic evaluation overtaking usability review for the top spot as compared to 2007 survey results (UPA 2009
Salary Survey, 2009).
A heuristic review is a "review or inspection of a product by experts" (Barnum, 2011). These reviews are based on a set of guidelines or "heuristics" against which a website's functionality and usability is assessed. Jakob Nielsen and Rolph Molich developed the initial set of heuristics to evaluate user interfaces and presented them in their paper, Heuristic Evaluation of User Interfaces (Nielsen & Molich, 1990). Jakob Nielsen further refined the list to a final 10 heuristics:
1. Visibility of system status;
2. Match between system and the real world; 3. User control and freedom;
4. Consistency and standards;
5. Error prevention;
6. Recognition rather than recall; 7. Flexibility and efficiency of use; 8. Aesthetic and minimalist design;
9. Help users recognize, diagnose, and recover from errors; and 10. Help and documentation.
In order to perform a heuristic review, expert users would spend time with the website to familiarize themselves with the platform before analyzing the website against the ten heuristics
listed above. Often this type of review is performed early in the development process, and ideally before a more traditional usability review, as a means of identifying catastrophic errors at a sufficiently early point to be able to remedy it, as well as to inform a future usability review (Barnum, 2011).
2.2 Behavioral Economics
Herbert Simon originated the concept of behavioral economics in his work A Behavioral Model of Rational Choice where he postulated that the prevalent economic assumption of a rational actor (economic man) was in need of revision to account for anomalies of human decision-making (Simon, 1955). His theory was further refined in the 1970s by Daniel Kahneman and
Amos Tversky who presented a collection of biases commonly displayed by individuals making decisions under uncertainty and further developed a set of heuristics of thinking under
uncertainty (Kahneman & Tversky, 1974). Essentially, Kahneman and Tversky posited that making decisions in risky circumstances are difficult, and therefore humans use these heuristics to make the decisions easier. As a result, if we fully understand the heuristics, we can utilize
them to encourage good decision-making.
Kahneman and Tversky went as far as to propose an alternative model to the traditional model of expected utility theory that they titled "Prospect Theory" (Kahneman & Tversky, 1979).
Prospect theory highlights three departures from expected utility theory exhibited by individuals making decisions under uncertainty: (1) the certainty effect, (2) the reflection effect, and (3) the isolation effect. The certainty effect suggests that individuals tend to "overweight outcomes that appear certain, relative to outcomes that are merely probable". This suggests that individuals are risk averse when it comes to gains. That is, a person is more likely to take a sure gain of $5, than a 50 percent chance of winning $10. The expected value of both prospects are the same,
however, individuals are more likely to opt for the certain $5. The reflection effect is
characterized by a reversal of preferences around the break-even point. That is an individual that exhibits risk aversion in the case of sure gains, would exhibit risk seeking in the case of sure losses (i.e. would prefer a 50% chance of losing $10 to a sure loss of $5). Finally, the isolation effect suggests that individuals often disregard components that are shared between alternatives and focus on components that distinguish them. This sometimes distorts rational behavior because there are often numerous ways to decompose a risky choice and this effect ignores all but one (Kahneman & Tversky, 1979).
Robert Metcalf and Paul Dolan conducted a review of the application of these behavioral economic concepts to the field of transportation. Their research highlights a number of
applications to transportation. They note that individuals are extremely sensitive to losses. This corresponds closely to the reflection effect described by Kahneman and Tversky where
individuals would favor a chance of a loss over a sure loss, even when the expected value of the options is the same. They also point out that individuals overweigh small chances. In a study on the probability weighting function, Gonzalez and Wu point out that decision makers do not
usually perceive changes in probability linearly. That is, a change from a five percent chance to a ten percent chance of winning seems more significant than a shift from a 30% to a 35% chance, even though the magnitude of the change is the same (Gonzalez & Wu, 1999). It is also
explained that people value the present very highly and often practice hyperbolic discounting wherein they value the present very highly over later, and although they value later over later still, the relative magnitude of the value differential is less. This leads people to discount future events if sacrifices are necessary in the present. When connected to incentives, this suggests the importance of offering an incentive that is temporally proximate to the sacrifice that is required in order to garner the incentive. Finally, Metcalf and Dolan point to the context of the decision
as being exceptionally important in the behavior of an individual faced with making a risky choice, and present a mnemonic device -MINDSPACE to summarize the impacts of context on human behavior. MINDSPACE stands for messenger, incentives, norms, defaults, salience, priming, affect, commitments and ego (Dolan & Metcalf, 2012). See figure Table 2-1 below for a more detailed explanation of MINDSPACE.
Table 2-1 Mindspace
Table 1
MINDSPACE - the role of context on behaviour.
Messenger
Incentives
Norms
Defaults
Salience
Priming
Affect
Commitments
Ego
We are heavily influenced by who communicates information
Our responses to incentives are shaped by mental shortcuts We are strongly influenced by what others do
We 'go with the flow' of pre-set options
Our attention is drawn to what is novel and seems relevant to us
Our acts are often influenced by unconscious cues
Our emotional associations can powerfully shape our actions We seek to be consistent with our public promises, and
reciprocate acts
We act in ways that make us feel better about ourselves
Note: This is taken from Dolan et al. (2010) and Dolan et al. (2012).
Metcalf and Dolan demonstrate the importance of these contextual attributes by presenting a number of studies. With respect to norms, Metcalf and Dolan note "people often take their
understanding of social norms from the behavior of others" (Metcalf & Dolan, 2012). They further point to a study conducted by Allcott, wherein OPower, a software company that
provides data analytics to utilities and the customers, provided letters to its customers providing social comparisons of energy use between that customer and their neighbors. The outcome was to reduce energy consumption by about two percent compared to the baseline, suggesting that customer's perceptions of social norms for energy use from those letters led them to reduce their energy consumption (Allcott, 2011). Another study performed by Cialdini presented further
evidence that social pressures can be incredibly important in eliciting behavior change. In that study, signs were placed in hotel rooms encouraging people to reuse towels for environmental reasons, which resulted in a 35% increase in towel reuse. When those signs were replaced with signs suggesting that most previous occupants of that room had reused their towels, the
percentage jumped to 49%, further demonstrating the value of social norms on individual behavior (Cialdini, 2003). With respect to transportation, this could mean that people would
more willingly consider taking transit if it were portrayed as the most socially acceptable option, or was the norm.
Saliency refers to the perception by the individual that something is relevant or irrelevant to them. This is usually reflected in the ease with which people can understand and can use or
process information that is made available to them. Furthermore, this contextual attribute also "explains why unusual or extreme experiences are more prominent than constant experiences"
(Metcalf & Dolan, 2012). That is, peak or extreme events, or events that are last in a chain of events, are more likely to recur in our memory and therefore will be representative of the event to us. This phenomenon is closely related to the availability heuristic explained by Kahneman and Tversky and described by the ease with which an event can be recalled (Kahneman & Tversky, 1974). Saliency may be critical in the application of an incentive structure as the reward may be the last in a chain of events, or even represent an extreme event, and therefore significantly impact an individual's perception of the event. An individual who made a minor sacrifice over the course of a month by taking transit rather than driving daily, may forget about that sacrifice if they are rewarded with a large prize at the end of the month, prompting them to continue the behavior in the future seeking a similar reward. Furthermore, the daily decision of whether or not to commute alone could be made more salient by making the costs of that choice more available to the commuter.
Priming describes the phenomenon where an individual's actions may be impacted by cues that we are unaware of impacting behavior. For example, individuals primed with words related to cooperation led people to give more during a public cooperation game (Drouvelis et al., 2010). In another study, individuals primed with words about the elderly were observed to walk slower and have a poorer memory of the room upon completion of the interview (Dijksterhuis & Bargh, 2001). Metcalf and Dolan are unable to present any studies of the priming effect related directly to transportation, but the evidence in other fields is substantial and could be extended to transport related behaviors. For example, even providing commuters with more robust information about their commute by offering suggestions for public transit or biking and walking routes could bring those modes to the forefront of their mind and lead to their consideration the next time a
commuter has to make a choice about how to get to work.
The contextual impact of affect can be described as the impact of an individual's mood on the decisions and choices that the individual makes. A study by Xu and Schwarz suggests that an individual's feelings about driving their car are impacted by how they think about what they are doing (Xu & Schwarz, 2006). The suggestion is that a person who has a positive association with their car, or a negative association with taking transit (or other alternative modes) likely has positive feelings when driving and is more likely to drive. Alternatively, a person who often experiences frustration when driving, perhaps as a result of heavy congestion, might opt happily
to use alternative modes if they are primed with information about those modes (Metcalf & Dolan, 2012).
2.3 Non-monetary Incentives
The theories behind behavioral economics have been utilized in a number of ways to encourage behavior change in the context of transportation. In addition to financial incentives that will be discussed further below, short-term initiatives, carpool facilitation and benefits, provision of real-time information, and leveraging of social norms, are methods frequently used in transportation in an attempt to influence mode choice or other transport related behaviors.
2.3.1 Short-term initiatives
Short-term initiatives may include bike to work days or climate or sustainability challenges, among others. A report from an annual bike to work day event conducted across the Australian state of Victoria reported that 27% of those that reported riding to work for the first time during the event, reported that they were still riding to work five months after the event (Rose &
Marfurt, 2006). This study also asked participants to identify which aspect of the event was most significant in encouraging their participation. The two most prevalent responses were "being part of a big event that promotes cycling" and "seeing lots of people riding to work" (Rose & Marfurt, 2006). These outcomes suggest that providing a participatory experience that
encourages new cyclists by putting a lot of cyclists on the road, perhaps making novices more comfortable by surrounding them with other cycling individuals, as well as fostering a sense of community is likely to solicit new riders, and the experience can contribute to their continued riding as a form of commuting. Further evidence for the effectiveness of ride to work days is provided by similar events held in Queensland, Australia and Washington, D.C. where 38% of first time riders reported continued bike commuting after the event (LDA Consulting, 2002). Another common form of short term initiative are sustainability challenges such as the annual Utah Clear The Air Challenge, which is a month long challenge to encourage non-SOV
commuting throughout the state. The majority of participants joined as a member of a corporate team, suggesting that competitions conducted between businesses may be an effective means for encouraging participation. The challenge was facilitated through a self-reporting online platform designed by RideAmigos, a third party providing a commuter tracking platform which not only tracks trips made via sustainable modes, but provides estimated statistics on C02 reduced,
money saved, and calories burned (UDOT, 2015). RideAmigos will be discussed in more detail
2.3.2 Carpool facilitation and benefits
A review of carpooling incentives conducted by Emily Gates in her master's thesis work suggests that "psychological barriers, attitudes and perceptions" have a significant impact on whether individuals choose to carpool. Further, that "people find employer or school affiliation a quick and comfortable way to decrease the 'stranger barrier' in organizing carpools" (Gates, 2015). As a result, utilizing an employer network to encourage carpooling as a sustainable mode may be effective as it eliminates some of the concerns of potential users.
Another key consideration and complaint of possible carpoolers is that carpooling does not offer the flexibility that they need before and after work, citing necessary stops (groceries, kids at daycare, the gym) as major hurdles in sharing a ride to and from work with other people (O'Brien, 2010). These concerns can be addressed and potentially mitigated by provision of information and the availability of good carpool matching that may enable individuals to find people that have similar commitments or to at least set up carpools on certain days of the week, perhaps when they have a more flexible schedule.
2.3.3 Real-time and trip planning information
With the progression of technology including cell-phone technology and automated data
collection technologies on public transit, information is available more readily than ever before. Real-time information is critical, not only during travel, but for commuters as a part of their
trip-planning to and from work. Mapping technologies such as Google Maps and Open Street maps enable individuals to plan trips and see not only the quickest route by car, but to compare those routes to possible public transit options. A study conducted in New York City suggests that the availability of this information via the web or a smartphone has increased bus ridership in New York by approximately two percent (Brakewood et al, 2015).
2.3.4 Social Norms
Finally, as discussed above, people demonstrably care what others think of them. This results in individuals tending to "follow the crowd" or have a tendency to abide by social norms. The impact of social norms on behavior can be seen in a study by Cialdini where signs requesting that hotel guests recycle their towels were placed in hotel bathrooms. The research demonstrated that the most effective signs were those that implied that recycling hotel towels was the normal behavior for individuals staying in that room (Cialdini, 2003). Furthermore, utility companies often include a comparison of a customer's energy use to their neighbors in order to exert social pressure on the customer to use less energy. A study by Alcott showed that this method resulted in a 2% reduction in energy use as compared to the baseline. This method could be used in the context of transportation by making sustainable commuting patterns the norm. If SOV
commuting becomes an anomaly, rather than normal, a commuter may be more willing to consider alternative commuting habits.
2.4 Financial Incentives and Behavior Change
The use of financial incentives to encourage behavior change is well documented. Studies in health have used financial incentives to both encourage weight loss as well and to encourage people to follow prescribed drug intake (Volpp et al, 2008). In education, a study by Levitt et al. demonstrated that incentives could be an effective means of increasing student performance on standardized tests if rewards are offered immediately. The impact of the offered rewards diminishes if temporally separated from the test demonstrating the behavioral phenomenon highlighted by Metcalf and Dolan of the heightened value of the present (Levitt et. al, 2011). Furthermore, Hirshleifer demonstrated through a study with school children in India, that
providing incentives to encourage behavior change is more effective if applied to behavior inputs rather than behavior outputs (Hishleifer, 2016). That is, rewarding students for better test scores without explaining how they might achieve better test scores may not be as effective as
rewarding students for reading and/or studying more, which may then lead to better test scores. Within the transportation field, incentives have been used in several instances to shift travel demand from peak to off-peak times. Researchers at Stanford University have conducted studies in Bangalore, India, Singapore, and on the Stanford University Campus to offer financial
incentives to commuters willing to shift to off-peak commuting times. The project in Bangalore ran for six months from October 2008 to April of 2009, and was referred to as INSTANT (the Infosys-Stanford Traffic Project), and awarded credits to users daily based on their arrival time at the work site. Users were then qualified for a monetary reward at the end of every week. The rewards were offered in the form of a raffle, where the credits that had been accrued by the user qualified them for specified reward levels and win probabilities (higher rewards and better odds were possible for those with more points). The experiment in Bangalore resulted in an
approximate doubling in the number of people commuting during off peak times and a 17-minute reduction in average commute times for all commuters (Merugu et al., 2010).
Following on the success of INSTANT, the same group of researchers conducted a similar study in Singapore entitled INSINC. INSINC relied on the belief that "commuters respond more to 'higher payout raffles' than to 'lower payouts' made with certainty". That is a reflection of the concept that decision makers overweight small probabilities. Furthermore, the researchers hoped to capitalize on social norms by leveraging social motivation to increase the impact of financial rewards. INSINC differs from INSTANT in that points earned through commuting during off-peak periods could be exchanged for a fixed exchange rate, or the opportunity to win larger prizes by playing a game. Approximately 88% of participants elected the raffle option over the
fixed exchange rate, clearly demonstrating user's likelihood to overvalue small probabilities of winning. Researchers witnessed an approximate seven percent shift in peak to off-peak
commuting times overall, with marked differences in groups based on whether individuals had friends participating, distance lived from the office, and whether or not the user chose the deterministic prize or the lottery prize (Pluntke & Prabhakar, 2013).
A similar incentive program was introduced at Stanford University. The program at Stanford, entitled Capri, offered prizes similar to those offered in INSINC. Points awarded for preferred off-peak commuting behavior were exchangeable for deterministic amounts of money or for participation in a self-directed lottery through the playing of a game. Similar to the findings of INSINC, researchers observed approximately 87% of participants choosing the raffle/game mechanism for prizes. Through this, among other TDM offerings, Stanford was able to reduce its peak commuting significantly (Zhu, et al., 2015).
Finally, in the Netherlands, a similar experiment entitled "Spitsmijden" or the peak avoidance project, attempted to offer commuters either set amounts of cash or points towards a smart phone at the end of the experiment in an effort to encourage off-peak commutes. The findings from the experiment suggest that incentives can be used to shift commute times (approximately 60% of commuters shifted their commute times), but that the behavior shift was not lasting and most commuters returned to peak hour commutes when rewards were removed (Ettema et al., 2010). In an effort to avoid this return shift, Ettema et al cite the work of Geller suggesting that smaller incentives are more effective than larger incentives at creating lasting behavior shift as the behavior change is more likely to be internalized and less directly connected to the financial incentive provided (Geller, 2001).
2.5 Use of Lotteries as Incentive Mechanisms
Many of the studies discussed in section 2.4 employ both deterministic financial incentives and a lottery or raffle for potential larger prizes. Absent behavioral economic theory, it would be expected that individuals would consider the expected value of the deterministic prize as compared to the expected value of a lottery and respond with behavior change dependent upon those expected values. Incorporating behavioral economics concepts, however, it may be expected that individuals would overweight their chances of winning a lottery, not value
probabilities linearly and value the present very highly leading to a propensity for participation in a lottery even when the odds are apparently not in the participant's favor or the expected value of the lottery is significantly lower than the deterministic payout. In fact, in those studies presented that offered both a deterministic cash prize as well as a lottery option, participants strongly preferred the lottery option at a ratio of approximately four or five to one.
For a more thorough discussion of why lotteries tend to attract higher participation levels than set value prizes as well as recommendations for the use of lotteries as incentive mechanisms see Fangping Lu's master's thesis "Framework for a Lottery Based Incentive Scheme and its Influence on Commuting Behaviors -an MIT Case Study" (Lu, 2015). Lu uses a number of studies to demonstrate the attractiveness of lotteries as an incentive mechanism, and general preference of a lottery scheme to deterministic rewards. The reason for this, as Lu points out, is likely the propensity of individuals to believe that they are luckier than they are when presented with small odds of winning. Furthermore, the lottery scheme offers a significantly larger hedonic benefit to participants through the possibility of winning large amounts of money. She further presents insights and guidelines regarding the design of a lottery incentive scheme for encouraging commuter mode shift including: (1) ensuring that the desired behavior is also
beneficial to the well-being of the participant in order to encourage participation and increase the likelihood of lasting shifts, (2) appealing to the hedonic tendencies of individuals, and (3)
focusing on input behaviors as opposed to output behaviors (Lu, 2015). 2.6 Summary of Literature Review
This chapter presented a review of relevant literature on website design and usability, behavioral economics, and incentive mechanisms -non-monetary, financial, and lottery based. Some key takeaways from this chapter include:
* Usability is a critical part of perception and reception of a functional website; * Understanding and use of contextual behavioral heuristics are critical to design of
incentive scheme to encourage a behavior shift;
* Non-monetary and financial incentives can both be utilized effectively to shift individual behavior; and
* Individuals generally prefer lottery schemes to set-value cash rewards because of overweighting of chances of winning and hedonic benefit provided by lotteries.
Chapter 3: Dashboard Design and Review
3.1 Dashboard DesignThe stated research objectives of this thesis, to encourage mode shift in commuting among MIT employees necessitated the development of an interface that would offer commuters tools to understand their commute, provide real time information for trip planning, and allow them to earn prizes for making better commutes. As a first step, the research team created a list of features that were desired in a dashboard. The initial list consisted of:
" High level summary of user's travel behavior, as well as accessibility of more detailed information;
" Ability to communicate, introduce, and conduct incentive schemes including a deterministic cash-out as well as gamification for lottery participation;
" Ability to assign points based on distance user lives from campus and ease of switch to alternative modes;
" Automated commute trip "tracking" -to create a user interface that is as easy to use as possible, the team wanted to automate trip tracking, rather than require self-reporting. This encourages participation by reducing activation energy;
* Editable user interface - the team wanted users to be able to adjust the interface to make it more relevant to their personal commuting habits;
* Preferential treatment of contributors or individuals that log-in to the application frequently; and
* A leaderboard or other method of comparing users to their peers or specified peer groups; Based on research conducted by Emily Gates in support of her master's thesis regarding
available platforms currently on the market, the research team narrowed the list and highlighted key features desired by the research team, and in some cases strongly desired by the parking and transportation committee at MIT (Gates, 2015). The consolidated list of key features were: (1) a trip planning tool, (2) carpool facilitation, (3) automated commuter tracking and trip information, and (4) a lottery and rewards platform.
3.1.1. Automated commute tracking and trip records
Perhaps the most common feature of a dashboard is recording and display of information pertinent to the user. This "commuting" dashboard needed to reflect commuting behavior by
showing users details of their commutes including, at a minimum, the number of commutes made by mode. Additional desired information that could be provided was distance traveled, calories burned for alternative modes, and money spent or saved commuting by alternative modes. Beyond that, the team wanted the dashboard to offer small tokens or acknowledgement