HAL Id: halshs-01703170
https://halshs.archives-ouvertes.fr/halshs-01703170v2
Preprint submitted on 29 Jun 2018
HAL is a multi-disciplinary open access
archive for the deposit and dissemination of
sci-entific research documents, whether they are
pub-lished or not. The documents may come from
L’archive ouverte pluridisciplinaire HAL, est
destinée au dépôt et à la diffusion de documents
scientifiques de niveau recherche, publiés ou non,
émanant des établissements d’enseignement et de
Social Capital or Education: What Matters Most to Cut
Time to Diagnosis?
Setti Rais Ali, Paul Dourgnon, Lise Rochaix
To cite this version:
Setti Rais Ali, Paul Dourgnon, Lise Rochaix. Social Capital or Education: What Matters Most to
Cut Time to Diagnosis?. 2018. �halshs-01703170v2�
WORKING PAPER N° 2018 – 01
Social Capital or Education: What Matters Most
to Cut Time to Diagnosis?
Setti Rais Ali
Paul Dourgnon
Lise Rochaix
JEL Codes:
Keywords : Chronic disease, Diagnosis, Education, Health inequalities, Social
capital
P
ARIS
-
JOURDAN
S
CIENCES
E
CONOMIQUES
48, BD JOURDAN – E.N.S. – 75014 PARIS TÉL. : 33(0) 1 80 52 16 00=
www.pse.ens.fr
Social Capital or Education: What Matters Most to
Cut Time to Diagnosis?
Setti Rais Alia,b,∗, Paul Dourgnonc, Lise Rochaixa
aHospinnomics (PSE Paris School of Economics, Assistance Publique Hˆopitaux de Paris
-AP-HP), 1, place du parvis de Notre-Dame, 75004 Paris, France
bImagine, Institute for genetic diseases, 24 boulevard du Montparnasse, 75015 Paris, France cIRDES Institut de Recherche et Documentation en Economie de la Sant, 117 bis rue
Manin, 75019 Paris, France
Abstract
Time to diagnosis, defined as the time span from first symptoms to final diagnosis, has received little if no attention, although it is perceived as highly variable across conditions, patients and countries and as a key determinant of health prognoses and outcomes. In this paper, we offer one of the first measures of time to diagnosis for four chronic conditions (bipolar trouble, Crohn disease, multiple sclerosis and psoriasis), and analyze the role played by patients education and social networks in explaining time to diagnosis. Adopting a patient’s perspective, we use self-reported data from an online open access questionnaire administered to a large French social network of patients with chronic conditions. Duration models are used to explain variations in time to diagnosis. Our findings suggest that social participation and social support indeed reduce the probability of experiencing longer time spans to diagnosis. But contrary to expectations, higher levels of education have the reverse effect. We further analyze these results by identifying differences in patients’ health care-seeking behavior: more educated patients tend to consult specialists first, which leads to longer time spans to diagnosis as they are less prone than GPs to referring patients to hospitals for additional tests, when needed. While our social networks findings support WHOs recommendations to enhance individual social capital, results on education provide support for reforms aimed at implementing GP referral systems.
Keywords: Chronic disease, Diagnosis, Education, Health inequalities, Social capital
∗Corresponding author. Hospinnomics, 1, place du parvis de Notre-Dame, 75004 Paris.
1. Introduction
Delays in diagnosis may have detrimental outcomes in terms of health and avoidable health expenditures. Despite innovative diagnostic technologies, and the standardization of diagnosis and treatment protocols, the time elapsed be-tween first symptoms and final diagnosis varies substantially across patients. The French survey Erradiag, conducted in 2016, showed that 25% of patients treated for a rare disease assessed time to diagnosis to be over 5 years1. Nearly 60% of patients declared that lack of diagnosis led to physical harm, psycholog-ical distress, and avoidable medpsycholog-ical treatments. Beyond rare diseases, several medical studies conducted on cancer patients have shown that time to diagnosis is negatively correlated to survival time [1, 2, 3]. The pre-diagnosis period has important consequences on prognosis and disease progression and if linked to social status, may play an important role in the construction of social health inequalities. However, it has so far received very little, if no attention in health economics and in public health studies, due to lack of data. In this paper, we study the pre-diagnosis stage of illness, from the patients perspective. Our main variable of interest is time to diagnosis defined as the time elapsed between first symptoms appearance and final diagnosis. Variations in time to diagnosis may reflect supply side effects (the health care systems responsiveness to symptoms’ onset), as well as demand side effects, driven by patients characteristics and health care seeking behavior. We describe time to diagnosis among patients treated for four chronic diseases, bipolar trouble, Crohn disease, multiple scle-rosis and psoriasis, to then explore socioeconomic factors that may explain dif-ferences in time to diagnosis, with an emphasis on individual social capital and education, as these variables have been shown to have important causal effects
1Erradiag survey conducted by Alliance Maladies rares in 2016. Report available online
on health status, health behaviors, and health utilization behaviors [4,5, 6]. We base our research on an online survey administered to patients belonging to a chronic conditions social network. The results show that individual charac-teristics, among which social capital and education, have strong and significant impacts on time to diagnosis, shedding a new light on the construction of so-cial health inequalities. The paper is organized as follows. Section 2 reviews the literature on diagnosis work-up, and on the channels through which social capital and education may influence time to diagnosis. Section 3 introduces the questionnaire and the data. Section 4 presents the statistical methods, section 5 presents our main results which we are discussed in section 6.
2. Literature Review
This study aims at investigating how education, social capital and individual preferences may affect time to diagnosis and how the pre-diagnosis period can contribute to the construction of social inequalities in health. In this section, we review the existing literature on time to diagnosis and the links between health and health care utilization.
The time elapsed between first symptoms and first medical encounter varies with symptoms specificity and illness severity. If the symptoms are nonspecific
2, the patient may interpret them as transient episodes of tiredness or
anxi-ety. On the contrary, severe symptoms, sometimes combined with disabilities, will spur patients’ decision to seek care, thereby reducing time to first contact with a health care professional[7]. After the patients first medical encounter, a thorough examination is critical in obtaining a full diagnosis. Health care professionals must choose the optimal diagnosis strategy, weighing the benefits
2A nonspecific symptom does not allow a unique disease identification, because it either
and costs associated with additional tests, in particular patients’ costs (invasive procedures, anxiety) [8]. The time elapsed from the first medical encounter to the full diagnosis will also vary according with the nature of the symptom (spe-cific or not) and the disease stage and form: illnesses such as multiple sclerosis or lupus, are characterized by relapsing-remitting forms, for which symptoms may suddenly disappear. In complex or rare diseases, diagnosis is harder to obtain and errors are more frequent. In cases where symptoms are common to more than one disease, health professional may fail to identify the proper illness. From the results of the survey conducted in 2012 by the French Observatory for rare diseases3, 90% of health care professionals lack knowledge on rare diseases.
Moreover, due to increasing specialization, health care professionals, when faced with multiple conditions, may fail to adopt a global approach to patients health. Indeed, while increased specialization may have positive effects on health care and health outcomes for diseases within the area of specialty, it has been shown to lead to coordination failure when multiple medical disciplines are involved [9].
Patients characteristics have been shown to influence health care seeking behaviour. An extensive literature has established the link between education and health, often referred to as the health education gradient. Results indicate that more educated people have healthier lifestyles, a better health status, and a higher life expectancy [10,11,12]. They show higher competencies to gain ac-cess, understand and use information in ways that promote and maintain good health often referred to as health literacy [13, 14]. The more educated tend to adopt healthier life styles, adhere and comply to medical decision and treat-ment, and reap the benefits of improved medical technology [15,16] and health
3Survey conducted by the French Observatory for rare diseases in 2012. Report available
online at:
campaigns [17, 18].Education is associated with better access to both health services and financial support [19, 20]. Furthermore, education is associated with better health related behavior such as lower cigarette consumption and higher levels of physical exercise [21]. An additional year of schooling appears to reduce average daily cigarette consumption by 1.6 for men and 1.1 for women and to increase physical exercise on average by 17 minutes [22,23].
Moreover, socio-anthropological studies show that more educated individuals also have different perceptions of their body and their health care needs and they seem to experience and report pain differently [24]. These results explain why less educated people may underuse health care services, even when provided freely [25].
Studies on patient-doctor interaction suggest that the social proximity be-tween patients and doctors influence diagnosis process, health care provision and information sharing [26,27,28]. Balsa and McGuire analyzed the way in which interactions between doctors and patients may contribute to social disparities and suggested that patients relative positions affect doctors interpretations and decisions during the diagnosis process. Besides, studies conducted before acute coronary crises showed that more investigations had been undertaken for better educated patients [29, 30, 31]. Patients education therefore appears to affect both health care seeking behaviors and health care professionals responses. The pre-diagnosis time span hence appears crucial in the construction of social health inequalities.
Beyond education, social relationships and networks may also play an im-portant role in time to diagnosis inequalities. Social capital, developed by [32, 33, 34], the definition of which has evolved over time, is of growing in-terest for different fields, from sociology to political science to economics and epidemiology. In the health economics literature, social capital is either assessed
at the collective level (society, communities) as “features of the social organi-zations such as trust, norms, and networks that can improve the efficiency of society by facilitating coordinated actions” [34], or at the individual level.
In this paper, we refer to individual social capital: “individuals social char-acteristics that enable private returns via interaction with others that can be accumulated or transmitted across generations” [35, 36, 37]. Intensive inter-actions offer patients privileged channels of information transmission, the op-portunity to share past experiences on health facilities, health services, health professionals, and this may both reduce patients informational costs [38] and provide social/financial support [39]. Rocco et al. presented 4 different mecha-nisms that may account for the link between social capital and health: (1) Social capital may provide easier access to health relevant information as a result of more intense social interaction. (2) Social capital may facilitate the provision of informal health care and psychological support. (3) Social capital may fa-cilitate peoples lobbying efforts to obtain health-enhancing goods and services. (4) Social capital may induce rational people to reduce their risky behavior by increasing the expected value of life [36]. In the time span to diagnosis, returns to social capital may enhance patients’ health-seeking behavior and facilitate interactions within health care professionals.
The role of individual preferences in decision-making has been widely investi-gated in economics [40,41]. Attitudes toward risk [42], and time preferences, i.e. the preference for immediate over delayed satisfaction [43], capture part of indi-vidual heterogeneity and are useful concepts for understanding and predicting economic behavior. Various approaches have been suggested to elicit individual preferences but relatively little attention has been paid to their contribution to health and health care seeking disparities. Studies suggest that individuals with lower time preferences or less risk adverse individuals are more likely to
undergo screening [44, 45] and provide evidence that time preferences and risk aversion are correlated with risky behaviors such as smoking. Their results also show a reduction of the educational gradient in smoking after controlling for these characteristics, supporting their role as partial mediators. Regarding ac-cess to health care, results from [44] suggest that individuals with lower time preferences tend to delay care seeking, and be less proactive during the diagno-sis making period because they underestimate the future losses associated with delayed access. Similarly, risk averse individuals may fear the diagnosis and be less proactive during the diagnosis making period, and experience longer time span to diagnosis. None of these hypotheses have been empirically tested, to the best of our knowledge, and such is the aim of our paper.
While many studies examined the isolated effect of education, social capital and individual preferences on health and health behavior, very few have consid-ered these variables together. Yet, the literature provides evidence that these social characteristics exhibit strong associations. Verba et al. [46] show that more educated people engage more often in collective activities while Putnam and Helliwell [47] show that education levels increase levels of trust, one of the commonly used proxy for social capital. Regarding individual preferences, the less educated are more likely to engage in riskier behaviors [48].
3. Data and Methods
3.1. Data
To understand the role of patients’ preferences in explaining time to di-agnosis, we must adopt a patient’s perspective and rely on patients’ reported outcomes. Although a growing field of interest, no information is jointly col-lected on patients’ reported outcomes (PROMs) and patients’ characteristics. Our study is therefore the first to link these two dimensions. It is based on
pa-tients’ assessments of time elapsed from first symptoms to final diagnosis. This information was collected from an online survey conducted on a French social network dedicated to chronic patients called Carenity4), between May and July 2015. The response rate was estimated to 23%, with no significant differences between diseases. This response rate should be considered as a lower bound as the questionnaire was sent to all patients included in the whole database, including those who were not active for more than six months, which overes-timates the pool of potential respondents. As individual health characteristics are not systematically recorded in Carenity, it was not possible to explore which factors determined individual participation.
Data collected are self-reported and retrospective. We checked patients’ response consistency by comparing values for age, age of symptoms’ onset, date of first symptoms and final diagnosis date. 659 (78%) completed questionnaires passed the aforementioned coherence tests. Since the study focus is the impact of education and social capital on time to diagnosis, patients aged less than 18 years old at the time of first symptoms were excluded. While reducing the sample size to 503 patients, this enables us to concentrate on patients with autonomous behavior in health management and to exclude patients diagnosed at birth or in their childhood.
The questionnaire draws from the main French health and insurance inter-view survey5. Questions on the pre-diagnosis period were designed to describe patients experience from symptoms appearance to final diagnosis. The ques-tionnaire was piloted on a sub-sample of 21 patients.
The sample is not designed to be nationally representative and suffers from
4Carenity is a social network dedicated to patients with chronic conditions (see the UK’s
version at https://www.carenity.co.uk/who-we-are
5The French health, health care and insurance surveys were conducted by the Institute for
Research and Information in Health Economics from 1988 till 2014 and they now form the basis of the European Health Interview Survey.
the usual selection biases to be expected from with patients’ participation to social networks, both in terms of social and health characteristics. Previous work conducted on the Carenity patients’ database to explore its representa-tivity suggests that compared to nationally representative patients, Carenity’s sample has less seniors and more women, but displays no significant differences in geographical representativity [49]. Besides, the survey being administered online, with an open access and no control on respondents environment, we sus-pect patients with expanded pre-diagnostic periods to be more prone to share their experience online. The verbatim collected in the open question “What has been your experience of the health care system from symptoms appearance to final diagnosis?” shows that those who responded were likely to have experience poorly integrated care.
Regarding memory bias, the literature suggests that the period preceding final diagnosis is usually well remembered by patients [50, 51], all the more if the illness entails a substantial and durable change in social and professional life. Such should be the case for patients suffering chronic conditions, particularly those selected for our analysis: multiple sclerosis, bipolar disorder, psoriasis, and Crohns disease. Our choice favoured heterogeneous conditions, both in terms of severity and progression, for which clinical diagnoses are difficult to establish, given the non specificity of symptoms. Another key criterion was the fact that these conditions had severe impacts on functional health and patients daily lives, as well as their relative importance in the database, to ensure a large enough sample size.
Multiple sclerosis is an inflammatory disease of the central nervous system characterized by sensation disorders and mobility impairments. The diagnosis is based on imaging analysis such as MRI scan. Prognosis is unpredictable, with long remission periods [52].
Bipolar disorders are characterized by maniac phases or recurring hypo-mania and major depressive episodes. Addictions, isolation, divorce or unem-ployment are commonly associated with bipolar disorders. The risk of suicide is 15 times higher than in general population in France[53]. There is a ten-year lag, on average, between first symptoms and treatment initiation [54].
Psoriasis is a long-lasting autoimmune disease characterized by patches of abnormal skin. Diagnosis is typically based on the signs and symptoms and difficult to establish. Psoriasis is associated with an increased risk of psoriatic arthritis, lymphomas, cardiovascular disease, Crohns disease, and depression. Psoriatic arthritis affects up to 30% of individuals with psoriasis [55].
Crohns disease is a type of inflammatory bowel disease (IBD) characterized by inflammatory and remission phases. Symptoms include abdominal pain, di-arrhea, fever and weight loss. Diagnosis is based on the addition of several tests including biopsy and bowel wall examination. Delayed diagnosis may lead to severe complications [56].
Variables used in the analysis
The variable Time To Diagnosis (in months) captures the time elapsed be-tween first symptoms to final diagnosis. It is calculated from respondents’ as-sessment of first symptoms and final diagnosis dates.
The variable Education is based on the highest educational attainment re-ported by patients, grouped into 3 categories: no diploma or technical degree, baccalaureate (corresponding to the high school final degree in France), and undergraduate level or more.
We used two variables to proxy the level of social capital: Social Partici-pation is a dummy variable that measures patients particiPartici-pation to collective
activities such as voluntary-charity work, training courses, sport-social clubs, religious organizations, and political-community organizations. It is one of the most commonly used variable to capture individual social capital [57,58]. Social Support is a dummy variable stating if the respondent was able to rely on sup-port from family or friends during the pre-diagnostic period. This question was tailored to the particular context of the pre-diagnostic period and to the mea-surement of the pre-diagnostic social capital level. Information on symptoms severity was also collected to control for clinical symptoms using a categorical variable Symptoms Severity corresponding to mild, moderate or severe symp-toms.
Individual preferences were collected using standardized questions developed and validated by IRDES for the French Health Healthcare and Insurance Survey 2008. The Time Preference and Risk Aversion variables were derived from scores assessed by respondents on a 0 to 10 scale. These scales were defined in the INSEE-DELTA survey [59,60] which aimed at measuring time and risk preference measures [61, 62]. From the scores, we constructed dichotomous variables (0,1,2/3-10 for time preference and 0-7/8-10 for risk aversion, following Jusot and Khlat [45].
The F irst medical encounter may either be a GP, a specialist outside hos-pital, a hospital specialist, and A & E Departments, since the French system still allows patients to freely choose between these four entry points, despite the 2004 reform, aimed at introducing GP referral.
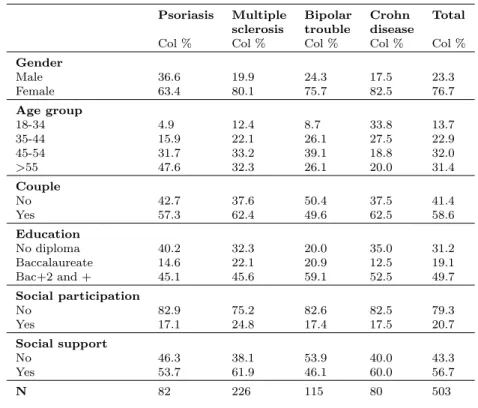
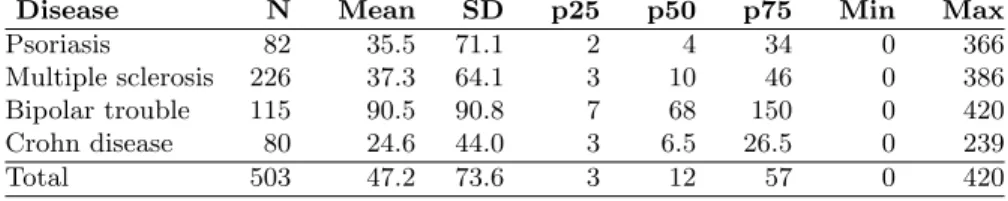
Table 1 displays respondents socioeconomic characteristics by type of dis-ease. Table 2 reports the distribution of time to diagnosis by disease and dis-plays large discrepancies between and within illnesses. As shown in table 1, women represent the majority of the sample (77%): this feature is consistent with the over-representation of women in online social networks ([63]), and the
higher incidence of multiple sclerosis [64] and bipolar trouble [65] among women. Carenity respondents were on average more educated and younger than the gen-eral population [63,49], which corresponds to general findings on social media participation rates. Looking at the distribution of time to diagnosis, we observe very skewed distributions toward 0 (less than 1 month of time to diagnosis) with very large extreme values (with a maximum value of 20 years of time to diagno-sis for psoriadiagno-sis and 35 years for bipolar trouble). We do observe large variations in time to diagnosis within and between each of the four chronic conditions.
Table 1: Patients’ sociodemographic characteristics
Medical conditions
Psoriasis Multiple Bipolar Crohn Total sclerosis trouble disease
Col % Col % Col % Col % Col % Gender Male 36.6 19.9 24.3 17.5 23.3 Female 63.4 80.1 75.7 82.5 76.7 Age group 18-34 4.9 12.4 8.7 33.8 13.7 35-44 15.9 22.1 26.1 27.5 22.9 45-54 31.7 33.2 39.1 18.8 32.0 >55 47.6 32.3 26.1 20.0 31.4 Couple No 42.7 37.6 50.4 37.5 41.4 Yes 57.3 62.4 49.6 62.5 58.6 Education No diploma 40.2 32.3 20.0 35.0 31.2 Baccalaureate 14.6 22.1 20.9 12.5 19.1 Bac+2 and + 45.1 45.6 59.1 52.5 49.7 Social participation No 82.9 75.2 82.6 82.5 79.3 Yes 17.1 24.8 17.4 17.5 20.7 Social support No 46.3 38.1 53.9 40.0 43.3 Yes 53.7 61.9 46.1 60.0 56.7 N 82 226 115 80 503
Table 2: time to diagnostic work-up by disease (in months)
Disease N Mean SD p25 p50 p75 Min Max
Psoriasis 82 35.5 71.1 2 4 34 0 366
Multiple sclerosis 226 37.3 64.1 3 10 46 0 386
Bipolar trouble 115 90.5 90.8 7 68 150 0 420
Crohn disease 80 24.6 44.0 3 6.5 26.5 0 239
Total 503 47.2 73.6 3 12 57 0 420
Source: Authors data.
Table legend: Time to diagnostic is defined as the time span between symptoms appearance and final diagnostic, expressed in months. Statistics displayed are respectively: (1) Number of observations; (2) Mean ; (3) Standard deviation; (4) First quartile; (5) Median; (6) Third quartile; (7) Minimum; (8) Maximum.
3.2. Methods
We studied the links between time to diagnosis (in months) and our two main variables of interest (education, social capital) accounting for demographics, risk and time preferences, and severity differences between respondents. We used a Cox proportional hazard model [66] to analyze time to diagnosis, using Breslow method for ties. Time to diagnosis was used as our time scale (in months). This semi-parametrical procedure enabled us to compute the baseline hazard function h(t) which is the failure probability - here, the diagnosis in the next step, given that diagnosis was not available at time t, without any restrictive distributional assumptions. The Cox model assumes that covariates are multi-plicatively related to the hazard (ie. proportional hazard assumption) but this hypothesis appears to be refuted for Age Class, as young patients experienced on average shorter time spans to diagnosis compared to older patients in our sample.
We therefore used an extension of the Cox model to deal with non propor-tional hazards by stratifying over the covariate Age Class that does not satisfy the proportional hazard assumption. The extension allows for multiple strata with distinct baseline hazard function but common values for the coefficient vec-tor. Our model specifies 4 strata corresponding to the 4 categories of Age Class
(18-34 years old; 35-44 years old; 45-54 years old; >55 years old) as displayed in Table1.
The model for each strata is written:
hg(t) = h0g(t)exp[β1X1+ ... + βpXp]
with g ∈ {1, 2, 3, 4}, strata defined from Age Class
Using this specification, we measure the effect of both education and social capital on the probability of survival, which here represents the probability to remain without diagnosis (the event of the survival analysis being ’obtaining the final diagnosis’). The fully adjusted models include controls for gender, marital status and symptoms severity. We added controls and clustered errors for medical conditions to account for heterogeneity across diseases. The vector X hence includes the following variables: Education, Social Participation, So-cial Support and the aforementioned control variables: gender, marital status, symptoms severity and medical condition.
4. Results
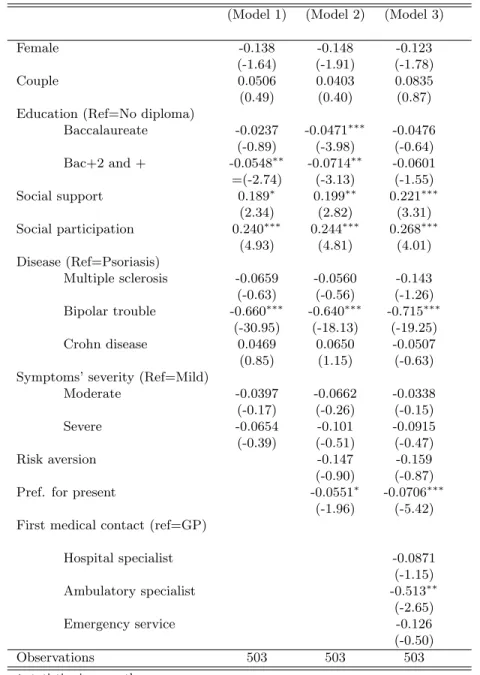
Table3reports estimates for the models (1), (2), (3). The results from Cox stratified models show that social capital, as measured by social participation and social support, is significantly associated with shorter time to diagnosis. Patients reporting social support or social participation exhibit hazard ratios superior to 1, meaning that social support significantly reduces the probability to have a longer time to diagnosis (Table 3 Model (1), HR respectively 1.21, p<0.05 and 1.27, p<0.000). This finding is robust to the inclusion of control variables accounting for time and risk preferences (Table3Model (2) and Model (3)).
Table 3: Estimated coefficients and 95% confidence intervals for covariates’ inci-dence on time to diagnostic work-up using Cox model stratified by Age Class.
(Model 1) (Model 2) (Model 3)
Female -0.138 -0.148 -0.123
(-1.64) (-1.91) (-1.78)
Couple 0.0506 0.0403 0.0835
(0.49) (0.40) (0.87) Education (Ref=No diploma)
Baccalaureate -0.0237 -0.0471∗∗∗ -0.0476 (-0.89) (-3.98) (-0.64) Bac+2 and + -0.0548∗∗ -0.0714∗∗ -0.0601 =(-2.74) (-3.13) (-1.55) Social support 0.189∗ 0.199∗∗ 0.221∗∗∗ (2.34) (2.82) (3.31) Social participation 0.240∗∗∗ 0.244∗∗∗ 0.268∗∗∗ (4.93) (4.81) (4.01) Disease (Ref=Psoriasis) Multiple sclerosis -0.0659 -0.0560 -0.143 (-0.63) (-0.56) (-1.26) Bipolar trouble -0.660∗∗∗ -0.640∗∗∗ -0.715∗∗∗ (-30.95) (-18.13) (-19.25) Crohn disease 0.0469 0.0650 -0.0507 (0.85) (1.15) (-0.63) Symptoms’ severity (Ref=Mild)
Moderate -0.0397 -0.0662 -0.0338 (-0.17) (-0.26) (-0.15) Severe -0.0654 -0.101 -0.0915 (-0.39) (-0.51) (-0.47) Risk aversion -0.147 -0.159 (-0.90) (-0.87)
Pref. for present -0.0551∗ -0.0706∗∗∗
(-1.96) (-5.42) First medical contact (ref=GP)
Hospital specialist -0.0871 (-1.15) Ambulatory specialist -0.513∗∗ (-2.65) Emergency service -0.126 (-0.50) Observations 503 503 503 t statistics in parentheses ∗p < 0.05,∗∗p < 0.01,∗∗∗p < 0.001
to diagnosis compared to patients without diploma (Table 3, Model (1), HR 0.95 for individuals with a College degree, p<0.01). After controlling for in-dividuals risk aversion and time preferences (Table3, Model (2)), coefficients for Education remain constant and significant. Preference for the present ap-pears to significantly increase the probability of longer time to diagnosis. Table 3, Model (2), HR 0.95, p<0.05), while the coefficient for risk aversion remains insignificant.
Consulting a specialist first, rather than a GP, increases significantly the probability of having a longer time to diagnosis (Table3, Model (3), HR 0.60, p<0.01). Moreover, after controlling for type of first medical encounter, the co-efficient for Education becomes insignificant, providing evidence that education was previously impacting the probability of having a longer time to diagnosis when choosing specialists as first medical encounter.
This result is robust to the inclusion of control variables accounting for individual risk and time preferences. It is also robust to the exclusion of the 3% extremes values of our sample, which reduces the maximum value of time to diagnosis from 420 months to 262 months (see table4in Appendix, Model (4)). We also remove from the sample recently diagnosed individuals, respectively in the last year or the last 2 years, to avoid the risk of wrong diagnoses. The results are robust to this robustness check (see table 4 in appendix, Model (5)). Finally, we test the hypothesis of proportional hazard for our stratified Cox model: proportionality of hazard was not rejected significantly (p>0.67), supporting our chosen specification.
Stronger social participation and social support significantly reduce time to diagnosis (Table 3, Model (3): HR respectively 1.25, p<0.001; 1.31, p<0.000). Social interactions may allow patients to gather health information as well as information from other patients, thereby reducing time to diagnosis. Social
capital also facilitates access to social and financial support.
Regarding individual preferences, only strong preferences for the present were associated with a higher probability of longer time to diagnosis (Table 3, Model (3): HR 1.25, p<0.001). This result on time preferences is in line with previous findings [44]: patients with a stronger preference for the present are substantially more focused on current well-being and may be less proactive in the diagnosis-seeking process. Such patients may undervalue future losses associated with postponing a medical consultation or a less proactive behavior during the pre-diagnosis period. They may also favor procrastination, i.e. value ignorance over awareness, postponing examinations they fear may reveal an unknown pathology [67].
Higher levels of education increase the probability of longer time to diagnosis (Table3, Model (1), HR on college degree: 0.95, p<0.01). Even after control-ling for risk aversion and preference for the present (Table 3, Model (2)), the coefficients for Education remain constant and significant. We identify three possible channels to account for this result:
1- More educated patients tend to challenge medical doctors assessments [68,69], and may seek second opinions. Besides, doctors may behave differently when patients are more educated, knowing that they are more proactive and may challenge their diagnosis [70]. Recent evidence indeed shows that doctors have implicit biases which influence their response to patients’ demands [71]. As a result, doctors may attempt to gather more evidence before giving their final diagnosis, to further reduce the probability of diagnosis errors.
2- Educated patients may retrospectively assess symptoms appearance ear-lier, and differences in biases regarding self-reported dates may partly drive the results on education. More educated patients have been shown to have higher expectations about their health status [72,73] and socioeconomic variations in
pain tolerance have also been established [24]
3- In France, patients have the freedom to choose between GPs and spe-cialists, who are both paid on a fee-for-service basis. Although gate keeping was implemented in 2004, it is not binding [74], and some patients continue accessing specialist care directly, despite higher out-of-pocket expenditures. As more educated patients consult specialists more readily than GPs, this free-dom of choice may have induced social disparities in diagnostic trajectories, due to differences in individual preferences, health literacy, and economic resources [75,76]. Ambulatory care specialists, unlike GPs, tend to delay patients refer-ring to hospitals or emergency services [77,78, 79], which can in turn increase time to final diagnosis.
No information was collected on patients or doctors actual behavior during the study period, which does not allow further investigations channels 1 and 2. But based on the available data, we can further document the third hypothesis. Results suggest differences in health care-seeking behavior as the coefficient on Education looses significance (Table3, Model (3): HR respectively 0.94, p>0.1) while the coefficient associated with specialists becomes significant (Table 3, Model (3) : HR 0.60, p<0.01): the more educated patients tend to first consult specialists, which is correlated with a longer time to diagnosis, since specialists are less likely than GPs to refer patients to hospitals for additional tests, when needed.
Our study suffers from several limitations, First, since questionnaires were kept reasonably short to ensure good response rates and avoid excessive bur-den for responbur-dents, we did not include questions on disease history as well as symptoms evolution. As a result, controls for disease severity lack precision as it is based on patients perception of symptoms severity in the disease early phase, to measure time to diagnosis. Moreover, beyond education, no other
socio-economic characteristics of patients were collected, such as incomes. To address possible reverse causality issue, we chose to remove patients with symptoms occurring before 18 years old, which ensures inclusion of patients with autonomous behavior in health decisions. Yet, this method only partially answers the endogeneity issue since the time to diagnosis may have implications on educational achievements. Finally, we lacked data to model and estimate the determinants of patients decision to consult, which would contribute towards understanding patients decisions to seek care and their disease management strategies.
5. Conclusion
The full time span to diagnosis, from first symptoms to final diagnosis, has received very little attention since most of the data collection starts after the first medical encounter. Only anecdotal evidence has been gathered on variations in time to diagnosis, indicating that more educated patients or those with strong social networks have benefited from shorter time to diagnosis. What is well documented, on the other hand, is that delays in obtaining the final diagnosis have a detrimental impact on health prognoses, outcomes and more generally on quality of life. Using a patients’ network for our data collection, and adopting a patient’s perspective, we consider four diverse chronic conditions (bipolar trouble, Crohn disease, multiple sclerosis and psoriasis), and offer a first measure of this time to diagnosis. Despite data restrictions, we are able to document large variations between patients and between conditions.
Our results provide evidence that the first medical encounter plays an im-portant role in explaining time to diagnosis. Patients seeking GPs first have shorter time spans, compared to those seeking specialists for their first medical
encounter. This may be due to the fact that specialists are less prone than GPs to referring patients to hospitals for additional tests, when needed. These re-sults provide support for public policies aimed at establishing coordinated and streamlined health care pathways, with GPs as gatekeepers.
Regarding social networks (social participation and social support), we find that they reduce the probability of experiencing longer time spans to diagnosis and support WHOs recommendations to enhance individual social capital.
Higher levels of education, for their part, seem to increase the probability of longer time spans. We further analyze this unexpected result by identifying differences in patients’ health care-seeking behavior and find that it is the more educated patients who tend to consult specialists first, leading to longer time spans. Two alternative channels are offered for this result on education, based on 1) specialists’ implicit biases regarding educated patients or 2) differences in patients’ ability to identify and report dates of first symptoms. None of these two alternative channels can be identified using our data, but they are plausible and partly contribute to our education result.
While our results on social networks are likely to apply to most developed coun-tries’ health care systems, those on education may not hold for health care sys-tems where gate keeping is fully implemented. Carrying out similar studies in countries where higher education or stronger social networks may influence time to diagnosis through other channels would shed light on these issues. Our results point to the important role of the pre-diagnosis period in the construction of differentiated access to diagnosis. Yet delays in time to diagnosis, not solely pa-tients responsibility, are an under-documented aspect of the fight against health inequalities. Potential leverage for their reduction must be further explored in academic research to refine health care practices and health care system’s reforms.
Acknowledgements
All authors would like to thank the team members of Carenity who pro-vided access to their patients community as well as technical support with the design of the questionnaire and data collection. Authors are grateful to Nicolas Sirven, Florence Jusot, Sandy Tubeuf, Izabela Jelovac, Lontine Goldzhal, Hos-pinnomics team members as well as participants to LIRAES seminar, Journes Maurice Marchand, International Health Economics Association (IHEA) Con-ference, AUHE seminar, EuHEA PhD-Supervisor ConCon-ference, Journes de Mi-croconomie Applique for their useful comments and suggestions. Any remaining errors are the responsibility of the authors.
Appendices
Table 4: Robustness checks: Model (4): coefficients for model (3) without 3% top values and Model (5) displays coefficients for Model (3) restricting for patients diagnosed within the 2 previous years
(Model 4) (Model 5)
Female -0.0976 (-1.53) -0.158 (-1.93)
Couple 0.101 (0.88) 0.0606 (0.64)
Education (Ref=No diploma)
Baccalaureate -0.0946 (-1.17) -0.0504 (-0.47) Bac+2 and + -0.0587 (-0.85) -0.0520 (-1.07) Social support 0.154∗∗∗ (4.74) 0.248∗∗∗ (4.05) Social participation 0.174∗ (2.52) 0.278∗∗∗ (3.87) Disease (Ref=Psoriasis) Multiple sclerosis -0.355∗∗∗ (-5.17) -0.135 (-1.11) Bipolar trouble -1.037∗∗∗ (-11.01) -0.695∗∗∗ (-18.67) Crohn disease -0.374∗∗∗ (-4.13) -0.0562 (-0.66)
Symptoms’ severity (Ref=Mild)
Moderate -0.0149 (-0.09) -0.0821 (-0.35)
Severe 0.000401 (0.00) -0.139 (-0.75)
Risk aversion -0.0877 (-0.51) -0.219 (-1.27)
Pref. for present -0.236∗∗∗ (-3.42) -0.0420∗ (-2.43)
First medical contact=1 0 (.) 0 (.)
Hospital specialist -0.0672 (-0.83) -0.120 (-1.38) Ambulatory specialist -0.413∗ (-2.55) -0.536∗∗ (-2.95) Emergency service -0.000556 (-0.00) -0.148 (-0.54) Observations 489 474 t statistics in parentheses ∗p < 0.05,∗∗p < 0.01,∗∗∗p < 0.001
References
[1] M. A. Richard, J. J. Grob, M. F. Avril, M. Delaunay, J. Gouvernet, P. Wolkenstein, P. Souteyrand, B. Dreno, J. Bonefrandi, S. Dalac, et al., “Delays in diagnosis and melanoma prognosis (i): the role of patients,” International journal of cancer, vol. 89, no. 3, pp. 271–279, 2000.
[2] N. C. Facione, “Delay versus help seeking for breast cancer symptoms: a critical review of the literature on patient and provider delay,” Social science & medicine, vol. 36, no. 12, pp. 1521–1534, 1993.
[3] M. Ramos, M. Esteva, E. Cabeza, C. Campillo, J. Llobera, and A. Aguil´o, “Relationship of diagnostic and therapeutic delay with survival in colorectal cancer: a review,” European journal of cancer, vol. 43, no. 17, pp. 2467– 2478, 2007.
[4] J. Li and N. Powdthavee, “Does more education lead to better health habits? evidence from the school reforms in australia,” Social Science & Medicine, vol. 127, pp. 83–91, 2015.
[5] R. A. Hummer and J. T. Lariscy, “Educational attainment and adult mor-tality,” in International handbook of adult mortality, pp. 241–261, Springer, 2011.
[6] I. Kawachi, S. V. Subramanian, and D. Kim, “Social capital and health,” Social capital and health, pp. 1–26, 2008.
[7] I. Fajardy and H. Michel, “Difficult´es diagnostiques de lh´emochromatose g´en´etique hfe (retard, exc`es, absence): point de vue du malade,” in Annales de Biologie Clinique, vol. 70, pp. 492–495, 2012.
[8] A. Fuat, A. P. S. Hungin, and J. J. Murphy, “Barriers to accurate diagno-sis and effective management of heart failure in primary care: qualitative study,” Bmj, vol. 326, no. 7382, p. 196, 2003.
[9] K. Baicker and A. Chandra, “The productivity of physician specialization: Evidence from the medicare program,” American Economic Review, vol. 94, no. 2, pp. 357–361, 2004.
[10] M. Grossman, “On the concept of health capital and the demand for health,” Journal of Political economy, vol. 80, no. 2, pp. 223–255, 1972. [11] D. M. Cutler and A. Lleras-Muney, “Understanding differences in health
behaviors by education,” Journal of health economics, vol. 29, no. 1, pp. 1– 28, 2010.
[12] D. W. Johnston, G. Lordan, M. A. Shields, and A. Suziedelyte, “Education and health knowledge: Evidence from uk compulsory schooling reform,” Social Science & Medicine, vol. 127, pp. 92–100, 2015.
[13] D. Nutbeam and I. Kickbusch, “Advancing health literacy: a global chal-lenge for the 21st century,” 2000.
[14] D. Nutbeam, “The evolving concept of health literacy,” Social science & medicine, vol. 67, no. 12, pp. 2072–2078, 2008.
[15] D. P. Goldman and J. P. Smith, “Can patient self-management help explain the ses health gradient?,” Proceedings of the National Academy of Sciences, vol. 99, no. 16, pp. 10929–10934, 2002.
[16] D. Goldman and J. P. Smith, “The increasing value of education to health,” Social science & medicine, vol. 72, no. 10, pp. 1728–1737, 2011.
[17] H. Cooper, K. Booth, and G. Gill, “Patients perspectives on diabetes health care education,” Health education research, vol. 18, no. 2, pp. 191–206, 2003.
[18] R. Gordon, L. McDermott, M. Stead, and K. Angus, “The effectiveness of social marketing interventions for health improvement: what’s the evi-dence?,” Public health, vol. 120, no. 12, pp. 1133–1139, 2006.
[19] P. Oreopoulos, “Estimating average and local average treatment effects of education when compulsory schooling laws really matter,” The American Economic Review, vol. 96, no. 1, pp. 152–175, 2006.
[20] P. J. Devereux and R. A. Hart, “Forced to be rich? returns to compulsory schooling in britain,” The Economic Journal, vol. 120, no. 549, pp. 1345– 1364, 2010.
[21] D. De Walque, “Does education affect smoking behaviors?: Evidence using the vietnam draft as an instrument for college education,” Journal of health economics, vol. 26, no. 5, pp. 877–895, 2007.
[22] B. L. Wolfe, R. H. Haveman, et al., “Social and nonmarket benefits from education in an advanced economy,” in Conference series-federal reserve bank of boston, vol. 47, pp. 97–131, Federal Reserve Bank of Boston; 1998, 2002.
[23] D. S. Kenkel, “Health behavior, health knowledge, and schooling,” Journal of Political Economy, vol. 99, no. 2, pp. 287–305, 1991.
[24] V. L. Bonham, “Race, ethnicity, and pain treatment: Striving to under-stand the causes and solutions to the disparities in pain treatment,” The Journal of Law, Medicine & Ethics, vol. 28, no. 4 suppl, pp. 52–68, 2001. [25] C. Despr´es, P. Dourgnon, R. Fantin, and F. Jusot, “Le renoncement aux
soins pour raisons financi`eres: une approche ´econom´etrique,” Irdes, Ques-tions d´economie de la sant´e, vol. 170, 2011.
[26] A. I. Balsa and T. G. McGuire, “Prejudice, clinical uncertainty and stereo-typing as sources of health disparities,” Journal of health economics, vol. 22, no. 1, pp. 89–116, 2003.
[27] A. I. Balsa, T. G. McGuire, and L. S. Meredith, “Testing for statisti-cal discrimination in health care,” Health services research, vol. 40, no. 1, pp. 227–252, 2005.
[28] M. Kelly-Irving, C. Delpierre, A.-C. Schieber, B. Lepage, C. Rolland, A. Afrit´e, J. Pascal, C. Cases, P. Lombrail, and T. Lang, “Do general prac-titioners overestimate the health of their patients with lower education?,” Social science & medicine, vol. 73, no. 9, pp. 1416–1421, 2011.
[29] T. Lang, P. Ducimeti`ere, D. Arveiler, P. Amouyel, J. Ferri`eres, J. B. Rui-davets, M. Montaye, B. Haas, and A. Bingham, “Is hospital care involved in inequalities in coronary heart disease mortality? results from the french who-monica project in men aged 30-64.,” Journal of Epidemiology & Com-munity Health, vol. 52, no. 10, pp. 665–671, 1998.
[30] T. Lang, B. Lepage, A.-C. Schieber, S. Lamy, and M. Kelly-Irving, “Social determinants of cardiovascular diseases,” Public Health Reviews, vol. 33, no. 2, p. 601, 2011.
[31] Y. Gerber, Y. Benyamini, U. Goldbourt, Y. Drory, et al., “Neighborhood socioeconomic context and long-term survival after myocardial infarction,” Circulation, vol. 121, no. 3, pp. 375–383, 2010.
[32] J. S. Coleman, “Social capital in the creation of human capital,” American journal of sociology, vol. 94, pp. S95–S120, 1988.
[33] P. Bourdieu, “Le capital social,” Actes de la recherche en sciences sociales, vol. 31, no. 1, pp. 2–3, 1980.
[34] R. D. Putnam, “Bowling alone: America’s declining social capital,” Journal of democracy, vol. 6, no. 1, pp. 65–78, 1995.
[35] E. L. Glaeser, D. Laibson, and B. Sacerdote, “An economic approach to social capital,” The Economic Journal, vol. 112, no. 483, 2002.
[36] L. Rocco, E. Fumagalli, and M. Suhrcke, “From social capital to health–and back,” Health economics, vol. 23, no. 5, pp. 586–605, 2014.
[37] L. Rocco and E. Fumagalli, “The empirics of social capital and health,” The Economics of Social Capital and Health: A Conceptual and Empirical Roadmap, 2014.
[38] B. d’Hombres, L. Rocco, M. Suhrcke, and M. McKee, “Does social cap-ital determine health? evidence from eight transition countries,” Health economics, vol. 19, no. 1, pp. 56–74, 2010.
[39] P. Hawe and A. Shiell, “Social capital and health promotion: a review,” Social science & medicine, vol. 51, no. 6, pp. 871–885, 2000.
[40] L. R. Anderson and J. M. Mellor, “Predicting health behaviors with an ex-perimental measure of risk preference,” Journal of health economics, vol. 27, no. 5, pp. 1260–1274, 2008.
[41] A. Gafni and G. W. Torrance, “Risk attitude and time preference in health,” Management Science, vol. 30, no. 4, pp. 440–451, 1984.
[42] G. Charness, U. Gneezy, and A. Imas, “Experimental methods: Eliciting risk preferences,” Journal of Economic Behavior & Organization, vol. 87, pp. 43–51, 2013.
[43] D. Kahneman and S. Frederick, “Representativeness revisited: Attribute substitution in intuitive judgment,” Heuristics and biases: The psychology of intuitive judgment, vol. 49, pp. 49–81, 2002.
[44] G. Picone, F. Sloan, and D. Taylor, “Effects of risk and time preference and expected longevity on demand for medical tests,” Journal of Risk and Uncertainty, vol. 28, no. 1, pp. 39–53, 2004.
[45] F. Jusot and M. Khlat, “The role of time and risk preferences in smoking inequalities: a population-based study,” Addictive behaviors, vol. 38, no. 5, pp. 2167–2173, 2013.
[46] S. Verba, K. L. Schlozman, and H. E. Brady, Voice and equality: Civic voluntarism in American politics. Harvard University Press, 1995.
[47] R. D. Putnam and J. F. Helliwell, Education and social capital. National Bureau of Economic Research, 1999.
[48] K. M. Murphy and R. H. Topel, “The value of health and longevity,” Jour-nal of political Economy, vol. 114, no. 5, pp. 871–904, 2006.
[49] S. Ra¨ıs, L. Radoszycki, P. Dourgnon, L. Rochaix, and M. Chekroun, “Ac-curate representation of patients opinions for decision-making: are online health communities good candidates?,” Diabetes, vol. 2, pp. 12–775, 2017. [50] J. M. Talarico, K. S. LaBar, and D. C. Rubin, “Emotional intensity predicts autobiographical memory experience,” Memory & cognition, vol. 32, no. 7, pp. 1118–1132, 2004.
[51] L. R. Berney and D. B. Blane, “Collecting retrospective data: accuracy of recall after 50 years judged against historical records,” Social science & medicine, vol. 45, no. 10, pp. 1519–1525, 1997.
[52] W. I. McDonald, A. Compston, G. Edan, D. Goodkin, H.-P. Hartung, F. D. Lublin, H. F. McFarland, D. W. Paty, C. H. Polman, S. C. Reingold, et al., “Recommended diagnostic criteria for multiple sclerosis: guidelines from
the international panel on the diagnosis of multiple sclerosis,” Annals of neurology, vol. 50, no. 1, pp. 121–127, 2001.
[53] F. K. Goodwin and K. R. Jamison, Manic-depressive illness: bipolar dis-orders and recurrent depression, vol. 1. Oxford University Press, 2007. [54] J. H¨attenschwilera, P. H¨ocka, R. Luthera, J. Modestina, and E. Seifritzb,
“Bipolar disorder: diagnosis,” in Swiss Medical Forum/Schweizerisches Medizin-Forum 2009; 9 (42): 750, vol. 754, 2009.
[55] J. M. Gelfand, R. Weinstein, S. B. Porter, A. L. Neimann, J. A. Berlin, and D. J. Margolis, “Prevalence and treatment of psoriasis in the united kingdom: a population-based study,” Archives of dermatology, vol. 141, no. 12, pp. 1537–1541, 2005.
[56] G. Van Assche, A. Dignass, W. Reinisch, C. J. van der Woude, A. Sturm, M. De Vos, M. Guslandi, B. Oldenburg, I. Dotan, P. Marteau, et al., “The second european evidence-based consensus on the diagnosis and manage-ment of crohn’s disease: Special situations,” Journal of Crohn’s and Colitis, vol. 4, no. 1, pp. 63–101, 2010.
[57] R. M. Scheffler, T. T. Brown, and J. K. Rice, “The role of social capital in reducing non-specific psychological distress: The importance of control-ling for omitted variable bias,” Social Science & Medicine, vol. 65, no. 4, pp. 842–854, 2007.
[58] K. M. Olsen and S.-˚A. Dahl, “Health differences between european coun-tries,” Social science & medicine, vol. 64, no. 8, pp. 1665–1678, 2007. [59] L. Arrondel, A. Masson, and D. Verger, “Pr´ef´erences de l´epargnant et
[60] L. Arrondel, A. Masson, et al., “In´egalit´es patrimoniales et choix individu-els: des goˆuts et des richesses,” tech. rep., 2007.
[61] L. Arrondel, A. Masson, and D. Verger, “Mesurer les pr´ef´erences individu-elles `a l’´egard du risque,” ´Economie et statistique, vol. 374, no. 1, pp. 53–85, 2004.
[62] L. Arrondel and A. Masson, “Mesurer les pr´ef´erences des ´epargnants: com-ment et pourquoi (en temps de crise)?,” Economie et statistique, vol. 467, no. 1, pp. 5–49, 2014.
[63] T. Correa, A. W. Hinsley, and H. G. De Zuniga, “Who interacts on the web?: The intersection of users personality and social media use,” Com-puters in Human Behavior, vol. 26, no. 2, pp. 247–253, 2010.
[64] L. Chwastiak, D. M. Ehde, L. E. Gibbons, M. Sullivan, J. D. Bowen, and G. H. Kraft, “Depressive symptoms and severity of illness in multiple sclero-sis: epidemiologic study of a large community sample,” American Journal of Psychiatry, vol. 159, no. 11, pp. 1862–1868, 2002.
[65] P.-M. Llorca, V. Camus, P. Courtet, D. Gourion, M. Lukasiewicz, and S. Coulomb, “Caract´eristiques et modalit´es de prise en charge des patients pr´esentant un trouble bipolaire en france: enquˆete montra,” L’Enc´ephale, vol. 39, no. 3, pp. 212–223, 2013.
[66] D. R. Cox, “Regression models and life-tables,” in Breakthroughs in statis-tics, pp. 527–541, Springer, 1992.
[67] T. Rapp, “Patients’ diagnosis decisions in alzheimer’s disease: the influence of family factors,” Social Science & Medicine, vol. 118, pp. 9–16, 2014. [68] D. Lupton, “Consumerism, reflexivity and the medical encounter,” Social
[69] S. K. Smith, A. Dixon, L. Trevena, D. Nutbeam, and K. J. McCaffery, “Exploring patient involvement in healthcare decision making across dif-ferent education and functional health literacy groups,” Social science & medicine, vol. 69, no. 12, pp. 1805–1812, 2009.
[70] S. Willems, S. De Maesschalck, M. Deveugele, A. Derese, and J. De Mae-seneer, “Socio-economic status of the patient and doctor–patient commu-nication: does it make a difference?,” Patient education and counseling, vol. 56, no. 2, pp. 139–146, 2005.
[71] E. N. Chapman, A. Kaatz, and M. Carnes, “Physicians and implicit bias: how doctors may unwittingly perpetuate health care disparities,” Journal of general internal medicine, vol. 28, no. 11, pp. 1504–1510, 2013.
[72] S. Allin, M. Grignon, and J. Le Grand, “Subjective unmet need and utiliza-tion of health care services in canada: what are the equity implicautiliza-tions?,” Social science & medicine, vol. 70, no. 3, pp. 465–472, 2010.
[73] A. D’Houtaud and M. G. Field, “The image of health: variations in percep-tion by social class in a french populapercep-tion,” Sociology of Health & Illness, vol. 6, no. 1, pp. 30–60, 1984.
[74] P. P. Groenewegen, P. Dourgnon, S. Greß, A. Jurgutis, and S. Willems, “Strengthening weak primary care systems: steps towards stronger primary care in selected western and eastern european countries,” Health Policy, vol. 113, no. 1, pp. 170–179, 2013.
[75] P. Le Fur and E. Yilmaz, “Modes d’acc`es aux sp´ecialistes en 2006 et ´
evolution depuis la r´eforme de l’assurance maladie: Enquˆetes sant´e pro-tection sociale 2004 et 2006,” Questions d’´economie de la sant´e, no. 134, pp. 1–8, 2008.
[76] M. Gouyon, “Lenquˆete sur le recours au sp´ecialiste en m´edecine de ville en 2007,” DREES, document de travail, pp. 1–173, 2010.
[77] M. W. Friedberg, P. S. Hussey, and E. C. Schneider, “Primary care: a critical review of the evidence on quality and costs of health care,” Health Affairs, vol. 29, no. 5, pp. 766–772, 2010.
[78] C. Foot, C. Naylor, and C. Imison, “The quality of gp diagnosis and refer-ral,” 2010.
[79] G. Johnson, G. Smith, A. Dramis, and R. Grimer, “Delays in referral of soft tissue sarcomas,” Sarcoma, vol. 2008, 2008.