HAL Id: cea-01630103
https://hal-cea.archives-ouvertes.fr/cea-01630103
Submitted on 7 Nov 2017
HAL is a multi-disciplinary open access
archive for the deposit and dissemination of
sci-entific research documents, whether they are
pub-lished or not. The documents may come from
teaching and research institutions in France or
abroad, or from public or private research centers.
L’archive ouverte pluridisciplinaire HAL, est
destinée au dépôt et à la diffusion de documents
scientifiques de niveau recherche, publiés ou non,
émanant des établissements d’enseignement et de
recherche français ou étrangers, des laboratoires
publics ou privés.
Bimodal Fluorescence/129Xe NMR Probe for Molecular
Imaging and Biological Inhibition of EGFR in
Non-Small Cell Lung Cancer
Gaëlle Milanole, Bo Gao, Audrey Paoletti, Grégory Pieters, Christophe
Dugave, Eric Deutsch, Sofia Rivera, Fredéric Law, Jean-Luc Perfettini, Emilie
Mari, et al.
To cite this version:
Gaëlle Milanole, Bo Gao, Audrey Paoletti, Grégory Pieters, Christophe Dugave, et al.. Bimodal
Fluorescence/129Xe NMR Probe for Molecular Imaging and Biological Inhibition of EGFR in
Non-Small Cell Lung Cancer. Bioorganic and Medicinal Chemistry, Elsevier, 2017, 25, pp.6653-6660.
�10.1016/j.bmc.2017.11.002�. �cea-01630103�
Bimodal Fluorescence/
129Xe NMR Probe for Molecular Imaging and Biological
Inhibition of EGFR in Non-Small Cell Lung Cancer
Gaëlle Milanole
a, Bo Gao
a, Audrey Paoletti
b, Grégory Pieters
a, Christophe Dugave
a, Eric Deutsch
b,c,d,
Sofia Rivera
b,c,d,, Frédéric Law
c, Jean-Luc Perfettini
c, Emilie Mari
e, Estelle Léonce
e, Céline Boutin
e,
Patrick Berthault
e,, Hervé Volland
f, François Fenaille
f, Thierry Brotin
gand Bernard Rousseau
a,a SCBM, CEA, Université Paris-Saclay, F-91191, Gif-sur-Yvette, France b INSERM 1030 Molecular Radiotherapy, Villejuif, France
c Department of Radiation Oncology, Gustave-Roussy Cancer Campus, Villejuif, France d Faculté de Médecine, Université Paris-Sud, Université Paris-Saclay, Le Kremlin-Bicêtre, France e NIMBE, CEA, CNRS, Université Paris-Saclay, CEA Saclay F-91191 Gif-sur-Yvette, France f SPI, CEA, Université Paris-Saclay, F-91191, Gif-sur-Yvette, France
g Ecole Normale Supérieure de Lyon, 46, Allée D’Italie, 69364 Lyon cedex 07, France
ABSTRACT
Although Non-Small Cell Lung Cancer (NSCLC) is one of the main causes of cancer death, very little improvement has been made in the last decades regarding diagnosis and outcomes. In this study, a bimodal fluorescence/129Xe NMR probe containing a xenon host, a fluorescent moiety and a therapeutic antibody has been designed to target the Epidermal Growth Factor Receptors (EGFR) overexpressed in cancer cells. This biosensor shows high selectivity for the EGFR, and a biological activity similar to that of the antibody. It is detected with high specificity and high sensitivity (sub-nanomolar range) through hyperpolarized 129Xe NMR. This promising system should find important applications for theranostic use.
———
Corresponding author. Tel.: +33 1 42 11 49 31; e-mail: sofia.rivera@gustaveroussy.fr Corresponding author. Tel.: +33 1 69 08 42 45; e-mail: patrick.berthault@cea.fr Corresponding author. Tel.: +33 1 69 08 54 93; e-mail: bernard.rousseau@cea.fr
1. Introduction
Fine detection and monitoring of tumor response to therapy through imaging techniques is critically important in the treat-ment of cancer, in particular non-small cell lung cancer (NSCLC) which is the leading cause of cancer-related mortality (14 to 20% of 5-year overall survival).1 To date, the high mortality rate of
NSCLC is mainly owed to its detection at late stages of development. Hence, the limited knowledge and improvement in characterization of NSCLC predictive biomarkers highlights the unmet medical need for a more efficient and a highly sensitive non-invasive imaging technique.
Among the diagnostic and follow up imaging methods clinically available, magnetic resonance imaging (MRI) appears as a powerful and attractive tool for providing in-depth anatomical and physiological information on tissues. Indeed, MRI offers several advantages owing to its low invasiveness, its harmlessness and its spatial in-depth resolution. However, this technique suffers from inherently poor detection sensitivity, rendering difficult its use for imaging molecular targets in lungs. Two reasons are responsible for that: i) the low energies involved
in this technique, ii) the low density of spin carriers in anatomic regions such as the lungs. In this context, laser-polarized 129Xe
NMR spectroscopy becomes an unavoidable strategy to improve the detection threshold for in vitro and in vivo MRI entering the radiomic era. The use of xenon is of increasing interest for sensitive MRI, owing to its exogenous nature (no background noise), its innocuousness and the large polarizability of its electron cloud inducing significant modification of NMR parameters even for slight changes in its local environment. Moreover, thanks to the large nuclear spin hyperpolarization afforded by optical pumping,2 the NMR signal can be enhanced
by several orders of magnitude (104 to 105) and small amounts of
gas dissolved in biological tissues (blood, lungs) can be detected with an excellent signal-to-noise ratio. In addition, xenon is a diffusive tracer crossing the cell membrane in some tens of milliseconds without polarization loss.3 The non-specificity of
the xenon gas towards biological targets can be overcome by the design of molecular systems reversibly encapsulating the noble gas and bearing a suitable functionality designed to target specific receptors.
Ideal candidates as 129Xe MRI-based biosensors are
cryptophanes, cage-molecules made of cyclotriveratrylene units,4
for which xenon exhibits a high affinity.5 Other outstanding
properties of cryptophanes can be highlighted such as observation of a specific 129Xe NMR frequency when xenon is
encapsulated inside their cavity and permanent in-out exchange ensuring a continuous replenishment of the cage by
hyperpolarized xenon. Thus, over the past decade,
cryptophane-xenon assemblies have been a subject of particular interest and have proven to be powerful biosensing systems for 129Xe NMR
applications.6 Herein, we introduce a biosensor that constitutes a
powerful theranostic tool and molecular imaging agent, based on a therapeutic antibody. It enables highly sensitive detection and follow-up of NSCLC by 129Xe NMR and fluorescence.
2. Results and discussion
Although other constructions for antibody-based xenon biosensors have been proposed in the literature,6d,6l the driving
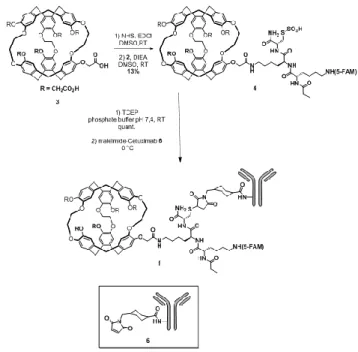
force of our work was to use an antibody daily used for patient treatment in order to build a theranostic tool. The bimodal biosensor 1 is constructed by bioconjugation of a cryptophane-fluorescein adduct to the therapeutic anti-EGFR monoclonal antibody cetuximab, as depicted in Figure 1.
2.1. Synthesis of the biosensor.
The 129Xe NMR-based biosensor (compound 1) has been
designed with three functional components. The first one is cetuximab, a FDA approved chimeric mouse-human IgG1 monoclonal antibody for cancer treatment. Indeed, the antibody is directed toward the EGFR overexpressed in many cancer cells with a high affinity and specificity along with a low biological clearance (half-life 168 h).7 The second one is the water-soluble
hexacarboxylic acid cryptophane-222,8 successfully employed in Figure 1. Concept of the bimodal fluorescence-129Xe NMR biosensor.
Scheme 1. Synthesis of the biosensor 1.
the past as a platform for 129Xe NMR-based biosensors by our
consortium.9
The hydrophilicity of this cryptophane is crucial to prevent anchoring of the biosensor into cell membranes10 and formation
of self-organized systems in biological media.6h The third part is
a fluorescein moiety, essential to confirm interaction of compound 1 with cells overexpressing EGFR and to quantify the biosensor uptake by fluorescence spectroscopy or microscopy. Finally, we have decided to bind these three essential units through a peptide linker. This peptide has to bear two different functionalities: 1) an amine group to allow the connection with the cryptophane core via a chemically stable amide linkage; 2) a thiol unit for bioconjugation to an antibody through thiol/maleimide addition, a protocol well documented.11 To meet
these essential conditions, we have designed peptide 2 constituted by three amino acids: a lysine incorporating the fluorescein moiety (5-FAM), a lysine with a free side chain providing the amine unit and a cysteine affording the thiol functionality (Figure 2).
Peptide 2 has been synthesized by standard Fmoc-based solid-phase peptide synthesis (see Supp. Info.). Subsequent coupling of the freshly generated primary amine on one carboxylic acid moiety attached to the cryptophane 3 has afforded the cryptophane-linker adduct 4 in 13% yield after purification by reverse-phase HPLC (Scheme 1). Next, deprotection of the cysteine using immobilized Tris(2-carboxyethyl)phosphine hydrochloride (TCEP) has occurred properly to give the expected intermediate 5. Finally, coupling 5 with cetuximab has been performed using heterobifunctional cross-linking reagent (see intermediate 6) to generate the biosensor 1.12
2.2. Characterization of compounds 4 and 1.
The compounds 4 and 1 have been characterized by MALDI-TOF spectrometry (see Supp. Info. Figures S2 and S4). The cetuximab concentration has been measured by UV absorbance. The degree of labelling has been estimated using the concentration ratio [compound 6]/[cetuximab]. A ratio of 4 cryptophane moieties per antibody has been measured using mass spectrometry.
Also, for compound 4, before the multi-grafting on the antibody, we have checked through hyperpolarized 129Xe NMR
experiments that the xenon exchange in and out of the cryptophane cavity is preserved. Precisely, direct detection
methods13 and indirect detection methods of the HyperCEST
type14 have been successfully employed (see Supp. Info. Fig. S8).
As expected, the presence of a racemic cryptophane moiety and asymmetrical sites on the peptidic linker gives rise to two major signals in the Xe@cryptophane spectral region (distinguishable with the direct detection method).
Hyperpolarized 129Xe NMR experiments have then been
performed to ensure that the grafting of the cryptophane scaffold on the antibody did not affect the xenon encapsulation properties. Fig. 3 displays the hyperpolarized 129Xe NMR spectrum of
biosensor 1 in PBS.
While the signals of the gas and of dissolved xenon appear at 0 ppm and 196 ppm, respectively, the signal of Xe caged in biosensor 1 resonates at 63 ppm. This signal is broad (FWMH ca. 200 Hz) because the flexibility of the spacer between the cage and the antibody is not enough to obtain a thin signal.6j But this
signal is unique, although the racemic cryptophane moiety has been used.
2.3. Biological activity assays.
We have first analyzed the binding of biosensor 1 – hereafter denoted C1 - into HCC827 and A549 cells lines. We have chosen these two NSCLC cell lines as they express intermediate (A549) and high (HCC827) level of EGFR and they display inhibited proliferation in response to the cetuximab treatment (See Supp. Info. Figure S5 where H1975 cells were used as a negative control as they express very low levels of EGFR). Both HCC827 and A549 cells have been treated with C1 at various serial dilutions: 1/100th, 1/1000th and 1/10000th of 1.82 µM (Figure 4). We have found significant fluorescence intensity arising from the fluorescein moiety for the HCC827 (Figure 4A) and A549 (Figure 4B) cells upon treatment with C1 in dose-related manner which correlated with EGFR expression level. These data confirm that the fixation of C1 is correlated with EGFR expression. Moreover, immunofluorescence performed at 4°C, in conditions that limit EGFR internalization showed C1 fixation on HCC827 cell compatible with membrane localization of EGFR (Figure 4C).
Figure 3. Hyperpolarized 129Xe NMR spectrum of biosensor 1 at 3
µM in PBS obtained in one scan. Insert: sub-spectrum obtained by 64 fast repetitions of the sequence soft 90° - Gaussian pulse centered at 60 ppm - acquisition (inter-scan delay: 93 ms).
Figure 4. Flow cytometry experiments on HCC827 cells (A) and
A549 cells (B) incubated with C1, and immunofluorescence experiments on HCC827 cells (C) incubated with C1. See Supp. Info. Figure S5 bis for corresponding A549 cells immunofluorescence experiments.
Cetuximab prevents binding of ligands to the EGFR and thereby inhibits the subsequent activation of downstream signal transduction pathways.15
To further evaluate the specificity of C1 to EGFR, we have treated first HCC827 cells with 34 nM of cetuximab and then with dilution 1/100th; 1/1000th and 1/10000th of 1.82 µM of C1 and our data suggest that the competition with cetuximab inhibits the fixation of C1 in dose-dependent manner (Figure 5A-C). Together, these findings suggest that C1 treatment is specific to EGFR.
HCC827 cells have been transfected using Lipofectamine RNAIMax during 48h with Silencer pre-designed SiRNA against EGFR or scramble. Then cells have been stained with C1 (serial dilution 1/100th; 1/1000th and 1/10000th of 1.82 µM) and analyzed by flow cytometry (Fig. 5D-E). Expression of EGFR has been determined by Western blot for validation of transfection on HCC827 cells (Fig. 5F). For details on this Figure, see Experimental Section.
EGFR is an oncogenic receptor tyrosine kinase. In normal cells, EGFR signaling is triggered by the binding of growth factors (such as epidermal growth factor (EGF)),16 leading to
homodimerization or heterodimerization with other EGFR family members and autophosphorylation of the intracellular domain. The phosphotyrosines serve as a docking site of adaptor molecules, which results in the activation of the RAS/MAPK signaling pathway, the PI3K/Akt pathway and the STAT pathway.17
As the standard treatment of locally advanced NSCLC involves radiotherapy and as cetuximab has a potential radiosen-sitizing effect,18-19 to evaluate whether cetuximab or C1 +/-
irradiation affects EGFR phosphorylation that leads to inhibition of the RAS/MAPK signaling pathway, we have used HCC827 cell line and evaluated by western blot the level of EGFR phosphorylation and MAPK pathway (Supp. Info. Figure S7). HCC827 cells, which express high level of EGFR, show after irradiation an increase of EGFR phosphorylation and p44/42 MAPK-p38MAPK phosphorylation (Supp. Info. Figure S7A).
We have found that incubation of HCC827 cells with cetuximab or C1 before irradiation reduces receptor phosphoryla-tion and leads to down-regulaphosphoryla-tion and decreased activity of EGFR. Moreover, these treatments result in decreased phosphorylation of the downstream signaling MAPK (Supp. Info. Figure S7B).
We conclude that both cetuximab and C1 prevent binding of ligands to the EGFR and thereby inhibit the subsequent activation of downstream signal transduction pathways.
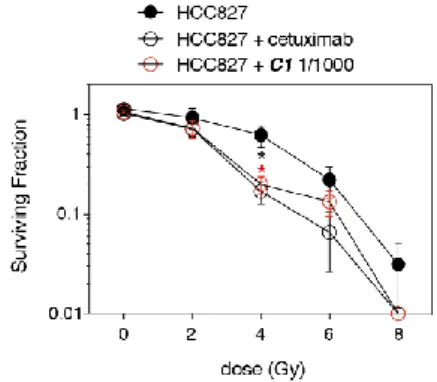
EGFR plays an important role on proliferation in cancer cells.20 We have determined proliferation by clonogenic cell
survival assay in HCC827 cell line, as shown in Figure 6. When we have combined with irradiation a 34 nM dose of cetuximab or 1.82 nM of C1, cell survival has been reduced. These data demonstrate the same enhancement of radiosensitivity for HCC827 cells pretreated with cetuximab or biosensor 1.
2.4. 129Xe NMR-based detection of biosensor 1 in cell samples.
0.16 µM of biosensor C1 has been incubated in parallel with HCC827 cells or A549 cells. A protocol similar to the one developed for a precedent transferrin 129Xe NMR-based
biosensor10 has been employed, enabling separation of the cell
clot and the supernatant (see Experimental Section). Before the NMR experiments on the samples of re-suspended cells in PBS, the fluorescence has been measured at 496 nm in order to estimate the intra-cellular concentration of the biosensor. The concentrations of biosensor in HCC827 cells over-expressing EGFR has been estimated to 12 nM and in A549 cells to 3 nM (see Supp. Info. Table S1).
Immediately after introduction of laser-polarized xenon into the NMR tubes, several experiments taking benefit of the fast in-out xenon exchange have been performed. Succession of frequency-selective pulses at the Xe@C1 chemical shift (around 70 ppm), each of them followed by acquisition, has the advantage
Figure 5. Dose dependent inhibition of C1 binding by cetuximab.
HCC827 have been pretreated with cetuximab, then with C1 and analyzed by flow cytometry (A: profiles; B: quantification) and immunofluorescence (C). HCC827 cells have been transfected using Lipofectamine RNAIMax during 48h with Silencer pre-designed SiRNA against EGFR or scramble, then stained with C1 and analyzed by flow cytometry (D: profiles; E: quantification). Expression of EGFR has been determined by Western blot for validation of transfection on HCC827 cells (F). See Supp. Info. Figure S6 for corresponding A549 cells
experiments
Figure 6. Clonogenic cell survival of HCC827. Cells have been
pretreated with cetuximab or C1 and exposed to radiation (0-8 Gy) as described in the Experimental Section. Data shown are representative of 2 independent experiments (mean ± SEM).
of providing direct detection of the biosensor, but the drawback of accumulating noise at each scan. Indeed, as displayed in Supp. Info. (Fig. S9), for the two cell lines we have been able to detect the biosensor in the supernatants, but not in the cell suspensions. We then turned to indirect direction, through NMR sequences of the HyperCEST-type, which have been proved in the past to be powerful and have lowered the hyperpolarized xenon detection threshold. The recent ultra-fast Z-spectroscopy method that has been shown to get rid of the xenon magnetization fluctuations by providing in only two scans the Z-spectrum21 was
in this case inefficient, probably due to a too broad dip on the Z-spectrum and the fact that saturation at the Xe@biosensor frequency occurs only in a minor part of the NMR tube, which means that only a small part of the biosensor present in the tube can be detected. Finally, we have used HyperCEST depolarization monitoring (see Fig. S10). This was employed principally by the Dmochowski’s group to identify xenon biosensor at low concentration.6a,22
Figure 7 compares for each cell line (A: HCC827 cells; B: A549 cells) the loss of polarization of the main 129Xe signal as a
function of the saturation time when saturation is applied on-resonance (at 67 ppm, i. e. 18 kHz upfield to this signal) or off-resonance (at 327 ppm, i. e. 18 kHz downfield to this signal). Clearly, in contrast to the A549 cells (see Fig. S11), a significant difference in the depolarization curves appears for the HCC827 cells. In order to comfort this result, the sequence was applied at different frequencies around 67 ppm, giving rise to the Z-subspectrum displayed in Figure 7C. Note that a 4 ppm downfield chemical shift with respect to the signal of Xe@C1 in PBS (Fig. 3) is observed, likely due to a different local environment.
Detection of the biosensor 1 in cells over-expressing EGFR through 129Xe NMR is thus successful.
3. Conclusion
This study aimed at evaluating the use of hyperpolarized 129Xe
NMR to detect non-small cell lung cancer. In this purpose, a biosensor made by the grafting of xenon hosts onto an antibody targeting the EGFR present on NSCLC cells has been conceived. It has been successfully synthesized with a clever chemical pathway and a yield compatible with larger quantities that will be further needed for in vivo studies.
Flow cytometry and immunofluorescence experiments with cells overexpressing or not the EGFR have shown that the biosensor reaches the receptors, and that the biological and therapeutic activities are maintained. The chemical modification of the antibody does not affect its recognition properties.
In cellulo 129Xe NMR detection of the biosensor has been
successfully performed. The xenon in-out exchange properties are maintained upon binding of the biosensor to the EGFR, enabling sensitive NMR detection at realistic concentration, and using a moderate rf power used during saturation. However, many avenues have to be pursued to improve the detection capability of such a biosensor in order to envision in vivo applications: grafting of more xenon hosts per antibody, use of a more flexible linker between the xenon host and the antibody.
This approach is likely to represent a theranostic tool to detect and treat NSCLC cells; further in vivo studies will now be undertaken to evaluate its performance on rodents.
4. Experimental section
4.1. Cells and culture conditions
Human NSCLC HCC827 and H1975 cells were cultured at 37°C and 5% CO2 in Roswell Park Memorial Institute medium
(RPMI-1640-Glutamax ThermoFisher Scientific) and human lung adenocarcinoma cells A549, were cultured in Kaighn’s modification of Ham’s F-12 medium (F-K12 ATCC). Media was supplemented with 10% Fetal Bovine Serum, 1% penicillin-streptomycin (Invitrogen), 1% HEPES (ThermoFisher Scientific) and 1% sodium pyruvate (ThermoFisher Scientific). For EGFR inhibition, we used cetuximab (Merck) at 32 nM, biosensor 1 (serial dilution 1/100, 1/1000 and 1/10000 of 1.82 µM) monoclonal antibodies.
Cells irradiation was performed using an X-Ray machine (X-RAD 320). X-Ray tube voltage was set to 320 kV, current of 4mA and dose rate of 1 Gy/min ± 5%. Cells were exposed to irradiations from 2 Gy to 8 Gy.
4.2. Chemical synthesis
See details in the Supp. Info.
4.3. Mass spectrometry, UV analysis
The compounds 4 and 1 have been characterized by MALDI-TOF spectrometry (see Supp. Info. Figs. S2 and S4). In order to calculate the cetuximab concentration and its degree of labelling, we first measured the absorbance of a precise amount of intermediate compound 6 at 280 nm and at its maximal absorbance λmax. We used these values to calculate the extinction
coefficient (ε) and the ratio R=A280 /Amax of 6. Then we measured
the absorbance of the biosensor 1 at λ280 and at λmax. To calculate
the cetuximab concentration we needed to subtract the absorbance contribution of 6 at 280 nm from the absorbance of the biosensor, and then divided by 2.1 108 (ε value of cetuximab). Figure 7. HyperCEST depolarization curves for (A) C1 in HCC827
cells, (B) C1 in A549 cells. Filled symbols: on-resonance saturation, empty symbols: off-resonance saturation. In (C), Z-spectrum obtained for the sample of C1 in HCC827 cells (the abscissa indicates the frequency offset from the free xenon signal).
4.4. Western blot analysis
Cell lysates were collected at 24h post-irradiation after twice wash with PBS 1X and lysed in appropriate buffer (250 mM NaCl, 0.1% NP-40, 5 mM EDTA, 10 mM Na3VO4, 10 mM NaF,
5 mM DTT, 3 mM Na4P2O7, and the protease and phosphatase
inhibitor (Roche)). Protein concentration was quantified using a BCA protein Kit (Thermo Fisher Scientific), according to manufacturer instruction. 10 μg of protein extracts were run on 4–12% SDS-PAGE and transferred at 4°C onto a nitrocellulose membrane (0.25 Micron). After incubation for 2 h at room temperature with BSA in Tris-buffered saline and 0.1% Tween 20 (TBS-Tween), membranes were incubated with primary antibody at 4°C overnight.
The primary antibodies—anti-EGFR (Tyr1068), anti-EGFR, p44/42 MAPK (Tyr202/Tyr204), p44/p42 MAPK, anti-p38 MAPK (Tyr180/Tyr182), anti-anti-p38 MAPK—were all from Cell Signaling. The primary antibody anti-GAPDH was from Millipore.
Horseradish peroxidase–conjugated goat anti–mouse or anti– rabbit (SouthernBiotech) antibodies were then incubated for 1 h 30 and revealed with the enhanced chemiluminescent (ECL) detection system.
4.5. Cytometry and immunofluorescence analysis
For cytometry, A549 and HCC827 (100 000 cells/ml) were harvested using Accutase cell dissociation reagent (ThermoFisher Scientific). For biosensor 1 staining, cells were saturated at 4°C for 15min with PBS-BSA 3% and incubated with cetuximab first for EGFR competition (32 nM) at 4°C for 30 min and washed twice with PBS-BSA 3%. Then cells were incubated with biosensor 1 (serial dilution 1/100, 1/1000 and 1/10000 of 1.82 µM at 4°C for 30min and washed twice with PBS-BSA 3%. Cells were then fixed in 4% paraformaldehyde-PBS at 4°C for 10 min and analyzed by cytometry with a Guava easyCyte Flow cytometer (Merck Millipore).
For immunofluorescence, A549 and HCC827 (100 000 cells/ml) were seeded on 12-well plate with coverslip (13 mm Ø). After 24 hour, cells were saturated at 4°C for 15 min with PBS-BSA 3% and incubated with cetuximab first for EGFR competition (32 nM) at 4°C for 30 min and washed twice with PBS-BSA 3%. Then cells were incubated with biosensor 1 (serial dilution 1/100; 1/1000 and 1/10000 of 1.82 µM), at 4°C for 30 min and washed twice with PBS-BSA 3%. Cells were then fixed in 4% paraformaldehyde-PBS at 4°C for 10 min, washed 3 times with PBS 1X, stained with Hoechst 33342 (ThermoFisher Scientific) and mounted with Fluoromount-G (SouthernBiotech). Fluorescence images were captured with a Leica DMi8 microscope.
4.6. Transient knockdown
Transient knockdowns of EGFR mediated by small interfering RNAs (siRNAs) were all synthesized and purchased from ThermoFisher Scientific (Silencer pre-designed SiRNA). In addition, a nonspecific scramble siRNA was purchased and used as a control. The siRNA transfection was performed according to the manufacturer’s instruction. Briefly, 2×10⁵ cells were seeded
in 24-well plates. After 24 hours of culture, cells were transfected with EGFR or control siRNA (100 nM final concentration) with Lipofectamine RNAiMAX reagent (ThermoFisher Scientific) according to the manufacture’s protocol. Western blot analysis and experiences were performed 48 h after transfection. For Figure 5, profiles (D), quantification (E) (mean ± SEM) and
western blot (F) are representative of 3 independent experiments. *p<0.05. **p<0.01. ***p<0.005. ****p<0.001.
4.7. Clonogenic survival
Cells were seeded in a 6-well plate (1.5×10² cells/well). After
24 hour of culture cells were pretreated with cetuximab (32 nM) or with biosensor 1 (1.82 nM) for 1 hour before irradiation. Cells were irradiated with increasing doses (0-8 Gy) and cultured until colonies appeared (10 days).
The cells colonies were visualized by Crystal Violet staining and colonies with 50 cells or more were counted, after removing the dye by washing. The surviving fraction was determined by dividing the number of colonies by the number of cells plates. Data was plotted on semi-log graphs on Prism 7.
4.8. Statistical analysis
All values were expressed as the mean ± SEM of individual samples. Samples were analyzed using Student’s t-test for two groups or ANOVA for multiple. (GraphPad Prism version 7.0; GraphPad Software). P values less than 0.05 were assigned significance.
4.9. Cell culture for 129Xe NMR
HCC827 cells were grown in RPMI 1640 Glutamax complemented with 10% fetal bovine serum, 1 mM sodium pyruvate, essential amino acids, 10 mM HEPES, 100U/mL penicillin/streptomycin. A549 cells were grown in DMEM Glutamax complemented with 10% fetal bovine serum and 100U/mL penicillin/streptomycin.
4.10. Incubation with the biosensor and preparation of the cells
for 129Xe NMR
80 million HCC827 cells and 80 million A549 cells were detached by incubating cells with Accutase during 5 minutes at 37°C in order to preserve EGF receptors. Cells were washed with complete medium and incubated with 0.16 µM of biosensor 1 in complete medium during 2h at 37°C. After centrifugation, the supernatant was separated from the cell pallet. Cells were washed twice in phosphate buffer saline (PBS, pH 7.4) and finally re-suspended in 600 µL of PBS and 50 µL of D2O. Viability of the
cells was controlled by trypan blue exclusion. Prior to the NMR experiments, the cell suspensions were introduced into NMR tubes equipped with J. Young valves and were degassed through helium bubbling during 2 minutes. The gas was removed using static pumping.
The quantity of biosensor internalized in each cell line was evaluated by measuring the fluorescence emission at 496 nm on a plate reader.
4.11. Production of hyperpolarized xenon
Xenon enriched at 83% in 129Xe isotope was polarized in the
batch mode using a home built spin exchange optical pumping setup based on laser diodes, previously described.23 Succinctly,
laser diodes providing 2 x 30 W circularly polarized light at 795 nm (DUO FAP from Coherent) illuminated a cylindrical 81 cm3
glass cell containing 2% of Xe, 10% of N2, 88% of He and some
droplets of rubidium as alkali metal. The glass cell was warmed at 380K through airflow in an external glass envelope. Four coils surrounding the cell delivered a 100 G magnetic field collinear to the laser beam. After some minutes, the gas mixture passed through a solenoid maintained in liquid nitrogen and under a 3
kG magnetic field in order to separate hyperpolarized Xe from N2
and He without significant loss of polarization.
4.12. NMR experiments
Laser-polarized xenon was introduced in the NMR tube through a vacuum line in the fringe field of the 11.7 T spectrometer magnet. The use of a hollow NMR spinner enabled us to condensate the noble gas on top of the solution (the latter staying at room temperature). After gentle shaking the tube was placed in the magnet and the NMR experiment itself started.
All the NMR spectrum were recorded on Topspin 3.0 at 293 K in a narrow bore 11.7 T Bruker magnet equipped with a dual
129Xe-1H 5 mm probe.
For the 129Xe NMR depolarization experiments, the pulse
sequence enabled us to obtain in one 2D experiment the depo-larization curve for a given saturation frequency (see Supp. Info. Fig. S9). Frequency-selective saturation was performed via a series of 100 D-Snob pulses of 10 ms duration and 12.3 µT peak power. Then a read pulse with small flip angle preceded the acquisition. Thanks to a small magnetic field gradient (0.2 G/cm) applied during the acquisition, we could record each spectrum in 24.6 ms. The same operation was repeated 16 times (another gradient of 1 ms with random strength value enabled us to chain without further delay the experiments) and the result stored under the form of a 2D matrix.
The Z-spectrum displayed in Fig. 7C was obtained with one xenon batch and the succession of the saturation offsets was randomly chosen. For sake of completeness, we checked that for off-resonance saturation offsets, at frequencies symmet-rical to the free xenon signal, a flat response profile was obtained.
Acknowledgments
The authors acknowledge financial support from ITMO Cancer AVIESAN (French Alliance for Life Sciences and Health) within the framework of the Cancer Plan. E. M. is supported by a public grant overseen by the French National research Agency (ANR) as part of the "Investissement d’Avenir" program, through the "IDI 2017" project funded by the IDEX Paris-Saclay, ANR-11-IDEX-0003-02.
References
1. a) Torre, L.A.; Bray, F.; Siegel, R. L.; Ferlay, J.; Lortet-Tieulent, J.; Jemal, A. CA Cancer J. Clin. 2015, 65, 87-108. b) Noone, A. M.; Cronin, K. A.; Altekruse, S. F.; Howlader, N.; Lewis, D. R.; Petkov, V. I.; Penberthy, L. Cancer Epidemiol. Biomarkers Prev.
2016, doi: 10.1158/1055-9965.EPI-16-0520.
2. Walker, T.G. and Happer, W. Rev. Mod. Phys. 1997, 69, 629-642. 3. Boutin, C.; Desvaux, H.; Carrière, M.; Leteurtre, F.; Jamin, N.;
Boulard, Y.; Berthault, P. NMR Biomed. 2011, 24, 1264-1269. 4. Brotin, T.; Dutasta, J.-P. Chem. Rev. 2009, 109, 88-130. 5. a) Jacobson, D. R.; Khana, N. S.; Collé, R.; Fitzgerald, R.;
Laureano-Pérez, L.; Bai, Y.; Dmochowski, I. J. Proc. Natl. Acad. Sci. U.S.A. 2011, 108, 10969- 10973. b) Hill, P. A.; Wei, Q.; Troxler, T.; Dmochowski, I. J J. Am. Chem. Soc. 2009, 131, 3069-3077. c) Fogarty, H. A.; Berthault, P.; Brotin, T.; Huber, G.; Desvaux H.; Dutasta, J.-P. J. Am. Chem. Soc. 2007, 129, 10332- 10333.
6. a) Riggle, B. A.; Wang, Y.; Dmochowski, I. J. J. Am. Chem. Soc.
2015, 137, 5542-5548. b) Witte, C.; Martos, V.H.; Rose, H. M.;
Reinke, S.; Klippel, S.; Schröder, L.; Hackenberger, C. P. R. Angew. Chem. Int. Ed. 2015, 54, 2806-2810. c) Khan, N. S.; Riggle, B. A.; Seward, G.; Bai, Y.; Dmochowski, I. J.
Bioconjugate Chem. 2015, 26, 101-109. d) Rose, H. M.; Witte, C.; Rossella, F.; Klippel, S.; Freund, C.; Schröder, L. Proc. Natl. Acad. Sci. U.S.A. 2014, 111, 11697-11702. e) Stevens, T. K.; Palaniappan, K. K.; Ramirez, R. M.; Francis, M. B.; Wemmer, D.
E.; Pines, A. Magn. Reson. Med. 2013, 69, 1245-1252. f) Seward, G. K.; Bai, Y.; Khan, N. S.; Dmochowski, I. J. Chem. Sci. 2011, 2, 1103-1110. g) Meldrum, T.; Seim, K. L.; Bajaj, V. S.;
Palaniappan, K. K.; Wu, W.; Francis, M. B.; Wemmer, D. E.; Pines, A. J. Am. Chem. Soc. 2010, 132, 5936-5937. h) Roy, V.; Brotin, T.; Dutasta, J.-P.; Charles, M.-H.; Delair, T.; Mallet, F.; Huber, G.; Desvaux, H.; Boulard, Y.; Berthault, P.
ChemPhysChem 2007, 8, 2082-2085. i) Hilty, C.; Lowery, T. J.; Wemmer, D. Pines, A. Angew. Chem. Int. Ed. 2006, 45, 70-73. j) Lowery, T. J.; Garcia, S.; Chavez, L.; Ruiz, E. J.; Wu, T.; Brotin, T.; Dutasta, J.-P.; King, D. S.; Schultz, P. G.; Pines, A.; Wemmer, D. E. ChemBioChem 2006, 7, 65-73. k) Spence, M. M.; Ruiz, E. J.; Rubin, S. M.; Lowery, T. J.; Winssinger, N.; Schultz, P. G.; Wemmer, D. E.; Pines, A. J. Am. Chem. Soc. 2004, 126, 15287- 15294. l) Palaniappan, K. K.; Ramirez, R. M.; Bajaj, V. S.; Wemmer, D. E.; Pines, A.; Francis, M. B. Angew. Chem. Int. Ed.,
2013, 52, 4849. m) Yang, S.; Yuan Y. ; Jiang, W.; Ren, L.; Deng,
H.; Bouchard, L.S.; Zhou, X., Liu, M. Chem.-Eur. J. 2017 23, 7648-7652. n) Zeng, Q.; Guo, Q.; Yuan, Y.; Yang, Y.; Zhang, B.; Ren, L.; Zhang, X.; Luo, Q.; Liu, M.; Bouchard, L.S.; Zhou, X. Anal. Chem. 2017, 89, 2288-2295.
7. a) Ciardello, F.; Tortora, G. Eur. J. Cancer 2003, 39, 1348-54. b) Zimmerman, M.; Zouhair, A.; Azria, D.; Ozsahin, M. Radiation Oncol. 2006, 1, 11-16. c) Milenic, D. E.; Wong, K. J.; Baidoo, K. E.; Ray, G. L.; Garmestani, K.; Williams, M.; Brechbiel, M. W. Cancer Biother. Radiopharm. 2008, 23, 619-631. d) Baselga, J.; Pfister, D.; Cooper, M. R.; Cohen, R.; Burtness, B.; Bos, M.; D'Andrea, G.; Seidman, A.; Norton, L.; Gunnett, K.; Falcey, J.; Anderson, V.; Waksal, H.; Mendelsohn, J. J. Clin. Oncol. 2000, 18, 904-914.
8. Huber, G.; Brotin, T.; Dubois, L.; Desvaux, H.; Dutasta, J.-P.; Berthault, P. J. Am. Chem. Soc. 2006, 128, 6239-6246. 9. a) Kotera, N.; Dubost, E.; Milanole, G.; Doris, E.; Gravel, E.;
Arhel, N.; Brotin, T.; Dutasta, J.-P.; Cochrane, J.; Mari, E.; Boutin, C.; Léonce, E.; Berthault, P.; Rousseau, B. Chem. Commun. 2015, 51, 11482-11484. b) Tassali, N.; Kotera, N.; Boutin, C.; Léonce, E.; Boulard, Y.; Rousseau, B.; Dubost, E.; Taran, F.; Brotin, T.; Dutasta, J.-P.; Berthault, P. Anal. Chem.
2014, 86, 1783-1788. c) Kotera, N.; Tassali, N.; Léonce, E.;
Boutin, C.; Berthault, P.; Brotin, T.; Dutasta, J.-P.; Delacour, L.; Traoré, T.; Buisson, D.-A.; Taran, F.; Coudert, S.; Rousseau, B. Angew. Chem. Int. Ed. 2012, 51, 4100-4103.
10. Boutin, C.; Stopin, A.; Lenda, F.; Brotin, T.; Dutasta, J.-P.; Jamin, N.; Sanson, A.; Boulard, Y.; Leteurtre, F.; Huber, G. ; Bogaert-Buchmann, A.; Tassali, N.; Desvaux, H.; Carrière, M.; Berthault, P. Bioorg. Med. Chem. 2011, 19, 4135-43.
11. Brinkley, M. A. Bioconjugate Chem. 1992, 3, 2-13.
12. Lee, J.; Choi, Y.; Kim, K.; Hong, S.; Park, H.-Y.; Lee, T.; Cheon, G. J.; Song, R. Bioconjugate Chem. 2010, 21, 940-946.
13. Berthault, P.; Bogaert-Buchmann, A.; Desvaux, H.; Huber, G.; Boulard, Y. J. Am. Chem. Soc. 2008, 130, 16456-16457. 14. Schröder, L.; Lowery, T. J.; Hilty, C.; Wemmer, D. E.; Pines, A.
Science 2006, 314, 446-449.
15. Li, S.; Ferguson, K. M. Cancer Cell 2005, 7, 301-311. 16. Wei, Y.; Levine, B. Cell 2013, 154, 1269-1284.
17. Lemmon, M. A.; Schlessinger, J. Cell 2010, 141, 1117-1134. 18. Aupérin, A.; Le Péchoux, C.; Rolland, E.; Curran, W. J.; Furuse,
K.; Fournel, P.; Belderbos, J.; Clamon, G.; Ulutin, H. C.; Paulus, R.; Yamanaka, T.; Bozonnat, M. C.; Uitterhoeve, A.; Wang, X.; Stewart, L.; Arriagada, R.; Burdett, S.; Pignon, J.-P. J. Clin. Oncol. 2010, 28, 2181-2190.
19. Bonner, J. A.; Harari, P. M.; Giralt, J.; Azarnia, N.; Shin, D. M.; Cohen, R. B.; Jones, C. U.; Sur, R.; Raben, D.; Jassem, J.; Ove, R.; Kies, M. S.; Baselga, J.; Youssoufian, H.; Amellal, N.; Rowinsky, E. K.; Ang, K. K. N. Engl. J. Med. 2006, 354, 567-578. 20. Tsiambas, E.; Syrigos, K. Res. Pract. 2016, 212, 672-677. 21. a) Boutin, C.; Léonce, E.; Brotin, T.; Jerschow, A.; Berthault, P. J.
Phys. Chem. Lett., 2013, 4, 4172-4176. b) Döpfert, J.; Witte, C.; Schröder, L. ChemPhysChem 2014, 15, 261-264.
22. Wang, Y.; Dmochowski, I. J. Chem. Comm. 2015, 51, 8982-8985. 23. Chauvin, C.; Liagre, L.; Boutin, C.; Mari, E.; Léonce, E., Carret,
G.; Coltrinari, B.; Berthault, P. Rev. Sci. Instrum. 2016, 016105.