HAL Id: cea-03125779
https://hal-cea.archives-ouvertes.fr/cea-03125779
Submitted on 29 Jan 2021HAL is a multi-disciplinary open access archive for the deposit and dissemination of sci-entific research documents, whether they are pub-lished or not. The documents may come from teaching and research institutions in France or abroad, or from public or private research centers.
L’archive ouverte pluridisciplinaire HAL, est destinée au dépôt et à la diffusion de documents scientifiques de niveau recherche, publiés ou non, émanant des établissements d’enseignement et de recherche français ou étrangers, des laboratoires publics ou privés.
Confined water radiolysis in aluminosilicate nanotubes:
The importance of charge separation effects
Marie-Claire Pignie, Viacheslav Shcherbakov, Thibault Charpentier, Mélanie
Moskura, Cedric Carteret, Sergey Denisov, Mehran Mostafavi, Antoine Thill,
Sophie Le Caer
To cite this version:
Marie-Claire Pignie, Viacheslav Shcherbakov, Thibault Charpentier, Mélanie Moskura, Cedric Carteret, et al.. Confined water radiolysis in aluminosilicate nanotubes: The importance of charge separation effects. Nanoscale, Royal Society of Chemistry, In press, 13, pp.3092-3105. �10.1039/D0NR08948F�. �cea-03125779�
1
Confined Water Radiolysis in Aluminosilicate Nanotubes:
The Importance of Charge Separation Effects
Marie-Claire Pignié,a Viacheslav Shcherbakov,b Thibault Charpentier,a Mélanie Moskura,a Cédric Carteret,c Sergey Denisov,b Mehran Mostafavi,b Antoine Thill*a and Sophie Le Caër*a
aNIMBE, UMR 3685 CEA, CNRS, Université Paris-Saclay, CEA Saclay 91191 Gif-sur-Yvette
Cedex, France
emails: antoine.thill@cea.fr and sophie.le-caer@cea.fr
bInstitut de Chimie Physique, CNRS–Université Paris Saclay, Bâtiment 349, 91405 Orsay,
France
cUniversité de Lorraine, CNRS, LCPME, 54000 Nancy, France
Abstract
Imogolite nanotubes are potentially promising co-photocatalysts because they are predicted to have curvature-induced, efficient electron-hole pair separation. This prediction has however not yet been experimentally proven. Here, we investigated the behavior upon irradiation of these inorganic nanotubes as a function of their water content to understand the fate of the generated electrons and holes. Two types of aluminosilicate nanotubes were studied: one was hydrophilic on its external and internal surfaces (IMO-OH) and the other had a hydrophobic internal cavity due to Si-CH3 bonds (IMO-CH3), with the external surface remaining
hydrophilic. Picosecond pulse radiolysis experiments demonstrated that the electrons are efficiently driven outward. For imogolite samples with very few external water molecules (around 1% of the total mass), quasi-free electrons were formed. They were able to attach to a water molecule, generating a water radical anion, which ultimately led to dihydrogen. When more external water molecules were present, solvated electrons, precursors of dihydrogen, were formed. In contrast, holes moved towards the internal surface of the tubes. They mainly led to the formation of dihydrogen and of methane in irradiated IMO-CH3. The attachment of
the quasi-free electron to water was a very efficient process and accounted for the high dihydrogen production at low relative humidity values. When the water content increased,
2
electron solvation dominated over attachment to water molecules. Electron solvation led to dihydrogen production, albeit to a lesser extent than quasi-free electrons. Our experiments demonstrated the spontaneous curvature-induced charge separation in these inorganic nanotubes, making them very interesting potential co-photocatalysts.
Introduction
The climate crisis and the increase in human-driven pollution urge the development of sustainable energy solutions1. Among the possible technologies, semiconductor heterogeneous photocatalysis, which uses low-cost and environmentally benign compounds, is particularly appealing for the treatment of organic and inorganic pollutants.2 Photocatalysis involves three different steps:3 (i) absorption of photons with energies higher than the bandgap of the photocatalyst, creating electron-hole pairs; (ii) separation and migration of electron-hole pairs; (iii) reactions of these charge carriers at the surface of the photocatalyst. If the recombination of electrons and holes in the bulk or on the surface of the material is fast, then the charge separation efficiency is low, and the photocatalyst is not effective. Different strategies (surface defect engineering, decoration with metal particles, etc.) have been pursued to address this issue. However, although these strategies are helpful in preventing charge recombination on the surface, they are not efficient within the bulk of the material itself. In this context, polarization (piezoelectric, ferroelectric, surface polarization, etc.) may help increase the separation of charge carriers, both within the material or on its surface.4 Another
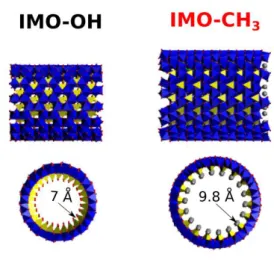
original strategy consists in using a material whose curvature is large enough to induce wall polarization.5-6 Of course, photocatalyst made with abundant and benign elements is an asset for sustainability. Imogolite is a natural nanotube (NT) that may fulfill all these requirements. Imogolite (IMO-OH) is a single-walled aluminosilicate NT having the chemical formula (OH)3Al2O3Si(OH) (Fig. 1). It possesses a monodisperse diameter of around 2-3 nm
controlled by a size mismatch between the Al and Si sheets, and also by water-wall interactions.7 In its standard form (IMO-OH), the tube wall consists of a gibbsite-like (Al(OH)3) sheet, which is linked through three Si-O-Al bonds to isolated four-coordinated
silicon atoms on the internal surface. Imogolite has a tubular structure with hydroxyl groups paving the internal (Si-OH) and external (Al2-µOH) surfaces. Moreover, the possibility to
chemically modify its functions paves the way for various and tunable inorganic NTs. Noteworthily, imogolite has only a few atomic layers in its wall structure and is thus sensitive
3
to harsh chemical modifications. Some external surface modifications can cause the nanotubular structure to be lost.8 However, many internal and external surface modifications
have proven to be possible9 while maintaining a well-defined tubular geometry.10 It is
possible to prepare hybrid imogolite with a modified internal surface.11 In the hybrid form (IMO-CH3) (Fig. 1), hydrophobic Si-CH3 groups cover the internal surface of the NT, but the
external surface is not modified. IMO-CH3 has a slightly larger diameter (3.5 nm) than
IMO-OH and possesses a strongly hydrophobic internal cavity.12-13 The band gap of these imogolite materials is calculated to be in the 4-5 eV range.14 Imogolite is thus a semiconductor. Moreover, recent theoretical predictions have shown that the very high curvature of the 6 Å thick imogolite wall induces a deformation of the electronic density distribution and gives rise to an intra-wall electric field that may generate a static force that promotes the separation of electron-hole pairs.6, 14 According to these predictions, there may be an electric field potential difference as large as 1 V between the inside and the outside of the imogolite wall driving photo-generated electrons outside of the tube, and driving holes inward.6 This enhancement of electron-hole charge separation makes it thus a good potential (cheap, sustainable and safe) co-photocatalyst.6, 14 One study has confirmed the presence of a surface polarization using the encapsulation of a solvatochromic dye (Nile red) inside IMO-CH3.15 Furthermore, internal
surface modifications can control this polarization.16 Nevertheless, to date, no studies have yet
experimentally confirmed that charge separation takes place in imogolite.
Fig. 1 Structures of standard (IMO-OH) (left) and hybrid (IMO-CH3) imogolites (right). The
oxygen atoms (red) assume an octahedral orientation around Al (blue) with three oxygen atoms shared by Si tetrahedra (SiO4, yellow). In the case of IMO-CH3, internal methyl groups
are represented with a grey color. The internal radius of the nanotubes is given. The nanotubes can be up to a few micrometers long.
4
A convenient way to generate charges (electrons and holes) in materials and to study their fate consists in using ionizing radiation17, which can penetrate the depth of the material,
thereby generating charge carriers. These charge carriers lead to the release of stable molecules (such as dihydrogen (H2)) that can be used as probes of reactivity.18-19 Moreover,
pulse radiolysis makes it possible to obtain time-resolved information on the behavior and fate of chemical species, such as the solvated electron, which will be investigated here.19 From a fundamental point of view, the understanding of the impact of a nanoporous medium on radiolytic events and on the resulting produced species is important. For instance, small wall sizes (< few nm) favors charge separation18-19 whereas larger walls lead to an excitonic chemistry.20-22 Therefore, with regard to imogolite, an ionic chemistry is expected under ionizing radiation. It is also interesting to determine how the geometry of the confining system affects the subsequent chemical processes. Radiation chemistry induced in 1D confining samples (i.e., NTs) has to date never been elucidated, contrary to 3D20-21 and 2D18-19 confining samples, although charge separation effects have been predicted to be efficient.6 The aim of the present study was to use radiation chemistry to determine the charge separation effects in these inorganic nanotubes.
Water adsorption in both IMO-OH and IMO-CH3 has already been studied in detail in
previous works23-25, demonstrating the sequential filling of pores. Comparison of both imogolite types makes it possible to determine the contribution of water present inside or outside the tubes.24 If a significant charge separation occurs, then water inside and outside the
NT should exhibit contrasting behavior towards irradiation. Here, we irradiated IMO-OH and IMO-CH3 at several relative humidities to understand the effect of water localization on H2
production. Picosecond pulse radiolysis experiments help better understand the role dihydrogen-precursor electrons play. The ultimate goal is to obtain information on the fate of electrons and holes generated in these inorganic NTs and to address charge separation effects experimentally, to assess the potential of imogolite NTs as co-photocatalysts.
1. Results
1.1. Characterization of the imogolite nanotubes using small-angle X-ray scattering
Imogolite NT powder presents three different types of pores.23-24 The first type is the internal cavity of the NT. This micropore is relatively independent of the packing structure, except for
5
possible induced deformations of the NTs.13 The other two types of pores are defined by the
external surface of imogolite. When the NTs are closely-packed in a 2D hexagonal phase, micropores – smaller than the internal micropore – are formed between the NTs assembled in bundles. The extent of this microporous volume depends on the average size of the imogolite NT bundles. Between the bundles, mesopores of various sizes are formed. The size distribution of these mesopores probably depends strongly on the powder production process and history (presence of salt, grinding, compression).26
Imogolite NT powders equilibrated with the ambient atmosphere were measured using small-angle X-ray scattering (SAXS). Fig. 2 shows the curves obtained for both imogolite types. In the large angle region, IMO-CH3 exhibits clear oscillations characteristic of a well-defined
cylindrical shape. The angular position of these oscillations is consistent with an internal radius of 9.8 Å and a wall thickness of 5.5 Å. In the low angle region, the scattered intensity has a slope of q-3. For IMO-OH powder, oscillations are also present, but strongly attenuated compared with those of IMO-CH3, with a slope of q-4in the low angle region. This pattern
corresponds to a Porod regime for a homogeneous material. In the intermediate angle region between 0.08 and 0.2 Å-1, the slope departs from the q-4 trend. This departure can be interpreted as the presence of inhomogeneity in the size range between 1 and 10 nm. Both IMO-OH and IMO-CH3 contain synthesis side-products in minor quantities (allophane,
proto-imogolite)27, which contribute to the attenuation of the oscillations of the scattered intensity.
The difference in attenuation of the scattered intensity between IMO-OH and IMO-CH3 can
also be explained by water interfacial tension. Imogolite NTs are flexible, as illustrated in an experimental deformation of germanium imogolite NTs when packed in bundles.13 In the case
of normal (silicon) imogolite, water is present on both sides of the NT wall. Therefore, no net contribution of interfacial tension can contribute to the modification of their cylindrical shape and the IMO-OH NTs in powder form are likely deformed. This may account for the weak large-angle oscillations and the q-4 trend in the low-angle region. The texture of the powder can be visualized as well-cooked hollow spaghettis packed together. In such a powder, there are micro- and meso-pores between flexible bundles. On the contrary, in the case of IMO-CH3, water is present only on the external surface of the NTs.24 Therefore, interfacial tension
applies only to the outside of the NT. This force is perpendicular to the tube surface and has an amplitude F ~ 2πrσ, with r being the external radius and σ the interfacial tension. This force helps maintain the cylindrical shape, and is consistent with the clear oscillations observed using SAXS (Fig. 2). The energy associated with this asymmetric interfacial tension
6
was estimated at more than 10 meV·atom-1. This contribution appears to be very strong
compared with the magnitude of energy involved in NT deformation (~1 meV·atom-1)28. This
energy may also improve the rigidity of the NTs and explain the different textures of the two samples. Therefore, the texture of this powder can be visualized as barely cooked hollow spaghettis packed together. IMO-CH3 is thus more porous and has a broader distribution of
mesopores than IMO-OH.
Fig.2 Small-angle x-ray scattering curves of natural imogolite (IMO-OH, black curve) and hybrid imogolite (IMO-CH3, red curve).
1.2. Behavior of imogolite nanotubes with water
The water uptake in natural and hybrid imogolites was described in previous studies using thin films.23-24, 29 Here, we measured the water sorption isotherms on freeze-dried powders,
which were manually ground before complete drying (Fig. 3a). For IMO-CH3, the interior of
the tubes remained globally free from liquid water, containing only low amounts of gas-phase water molecules.24 This was also the case for IMO-CH3 NTs fully immersed in water.12 Water
adsorption thus mainly occurs on the outer surface of the NTs where Al2-µOH groups are
present. Fig. 3a shows that water progressively fills the pores of increasing size with increasing relative humidity (RH), as illustrated by the progressive mass uptake (Fig. 3a). In contrast, water adsorption in the IMO-OH NTs powder is steeper and occurs at the lowest RH
7
values (RH < 10%, see the modeling in Fig. 3b25, 30). This part of the curve is mainly
explained by the filling of the internal cavity,24 whereas the pores between the tubes or the
bundles are progressively filled when RH increases, as observed for IMO-CH3. However, the
different slopes for IMO-OH and IMO-CH3 mass uptake at high RH values reveal the
different powder textures, as already observed using SAXS (Fig. 2).
Fig. 3 (a) Experimental water vapor adsorption isotherms for imogolite (IMO-OH, black squares) and for hybrid imogolite (IMO-CH3, red triangles). The experiments were performed
at 298 K. (b) Modeling of water adsorption in IMO-OH (green curve), with the contributions of internal and external water. The experimental data for IMO-OH are the same as in Fig. 3a and 3b. The black squares are experimental points recorded at 298 K.
The water content inside and outside the NTs is easily obtained for IMO-CH3 because it can
be considered that all water molecules are adsorbed on the outside of the NTs. Thus, the external water content is directly obtained from the adsorption curve. In the case of IMO-OH, it is more difficult to discriminate between internal and external water as a function of RH, requiring modeling the adsorption isotherm (Fig. 3b).25, 30 Modeling the water adsorption has
been described in a previous study.25 Briefly, the method proposed by Or and Tuller31 has been adapted to predict the amount of water adsorbed in a random 2D arrangement of nanotubes. The model has two regimes and considers distinct affinities for the internal and external surfaces of the nanotubes. In the low RH values region, when less than a water monolayer is adsorbed, the BET equation is used. At higher RH values, when a continuous water layer exists and capillary condensation starts, the Or and Tuller31 equation is used. We
have ensured the consistency between the BET parameters and the Hamaker constant used in the Or and Tuller equation31 at the RH value corresponding to the presence of a water
8
monolayer (see the ESI of reference 25 for more details). The internal and external water
content can thus be assessed for both imogolite types and are shown in Table 1.
Table 1. Internal, external and total water content (w%, with respect to the whole imogolite-water system) for normal and hybrid imogolite types at relative humidity (RH) values of interest. The water content shown for IMO-OH are based on the sorption isotherm and on modeling,25 whereas the isotherm gives directly the external water content for IMO-CH
3 (the
internal water content being very close to 0 in this case). Temperature is 298 K.
IMO-OH IMO-CH3 RH (%) Internal water (w%) External water (w%) Total water (w%) Internal water (w%) External water (w%) Total water (w%) 3 8.8 1.4 10.2 0 5.0 5.0 11 11.8 2.2 14.0 0 8.3 8.3 43 11.8 5.1 16.9 0 14.3 14.3 74 11.8 7.0 18.8 0 20.0 20.0 97 11.8 10.3 22.1 0 28.4 28.4 1.3. NMR experiments
Both imogolite types before and after irradiation at a dose of 520 kGy (1 Gy = 1 J.kg-1, see the Experimental Section) were characterized using solid-state nuclear magnetic resonance (NMR) (Fig. 4). This dose is roughly four times higher than the maximum cumulative dose received during the gas production experiments. Lower doses (100 kGy) did not enable detecting modifications upon irradiation on the NMR spectra, as NMR is less sensitive than gas production measurements.
The 27Al magic-angle spinning (MAS) NMR spectra of IMO-OH and IMO-CH3 (Fig. 4a, 4c)
are dominated by a broad asymmetric peak at 5 ppm characteristic of six-coordinated aluminum atoms present on the outer surface of the NTs.32 For IMO-OH, two small peaks are also present. The peaks at 30 ppm and 58 ppm are attributed respectively to five-coordinated and four-coordinated aluminum atoms.33 They are characteristic of defects, but can also correspond to aluminum atoms present in synthesis side-products.34 The broad contribution ranging from -83 to -100 ppm in the 29Si cross-polarization (CP)-MAS spectrum reflects either species on the edge of NTs or the formation of a secondary amorphous phase (Fig. 4b).
9
The deconvolution of the 27Al MAS NMR spectra of IMO-OH before and after irradiation at
520 kGy is given in Figs. S1 and S2 in ESI, respectively. The 29Si CP-MAS {1H} spectrum of
IMO-OH (Fig. 4b) is dominated by a sharp peak at -78 ppm, which is characteristic of Si-OH groups present inside the NTs.35 For IMO-CH3, this sharp peak is shifted to -43 ppm (Fig. 4d).
Furthermore, no component around -78 ppm (Si-OH) was detected in the spectrum before irradiation, indicating that all (or almost all) Si sites are initially occupied by Si-CH3 moieties.
Fig. 4 27Al MAS spectra of IMO-OH (a) and IMO-CH3 (c) equilibrated at 43% relative
humidity (RH) before and after irradiation at a dose of 520 kGy. 29Si CP-MAS {1H} spectra of IMO-OH (b) and IMO-CH3 (d) equilibrated at 43% RH before and after irradiation at a
dose of 520 kGy. All spectra were normalized to the same peak area and to the sample weight.
After irradiation at a dose of 520 kGy, a slight broadening of the six-coordinated aluminum signal was observed for IMO-OH NTs only. The intensity of the two other small peaks at 30 ppm and 58 ppm also increased slightly. The broadening of the main peak and the increase of
10
the 30 and 58 ppm peaks can be attributed to the presence of less ordered six-coordinated aluminum environments and the formation of new defects upon irradiation.34 It may also be
due to a change in relaxation time upon irradiation. Similar trends were observed on the 29Si
CP-MAS {1H} spectrum after irradiation with an increase of the broad peaks ranging from -83 to -100 ppm (Fig. S3 in ESI). The spectrum recorded for irradiated IMO-OH is in line with the fact that irradiation increased the number of defects and the disorder in the powder. For IMO-CH3, the 27Al MAS NMR spectrum recorded after a 520 kGy irradiation is similar to the
spectrum of the nonirradiated sample. For this sample, however, a new small contribution at -78 ppm was observed on the 29Si CP-MAS {1H} spectrum of the irradiated sample. This new peak suggests that a few Si-CH3 bonds have been replaced by Si-OH bonds, implying the
release of carbonaceous species, and hence, after cleavage of the Si-C bonds, the reaction of the silicon atom with internal water vapor generating Si-OH bonds upon irradiation.
The IMO-OH and IMO-CH3 NTs appeared only slightly affected by the 520 kGy irradiation.
The gas production observed in the presence of adsorbed water for doses lower than 200 kGy cannot therefore be meaningfully explained by reactivity with modified NT structures.
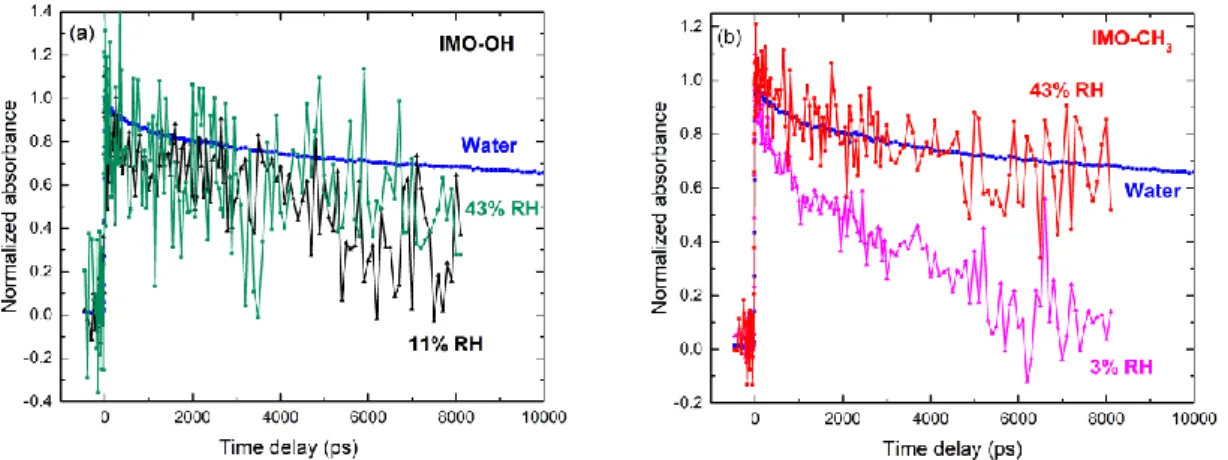
1.4. Picosecond pulse radiolysis experiments
Time-resolved experiments on imogolite films were performed to better understand the first stages of the ionizing radiation-matter interaction. The prerequisite to such an experiment is the production of relatively thick, but transparent films (see the Experimental Section). Because these experiments are difficult due to the low thickness of the samples (< 300 µm) and low light transmission, only strong absorbing species can be followed over time.36-37 The
solvated electron (or wet electron) was thus the best candidate, because it absorbs considerably in the red part of the visible range. Moreover, it is known to be a precursor of H2
whose yield will be measured as a function of RH (see next section).17
The spectra measured in IMO-CH3 equilibrated at 3 and 43% RH are shown in Fig. 5. Clearly,
and in comparison with the well-known signal measured in water (lines in Fig. 5), the spectra can be attributed to the formation of the hydrated electron.36-37 Similar signals were measured in IMO-OH, but their absorbance is low, and also the signal to noise ratio. They are given in Fig. S4 in ESI. Note that no signal could be measured for the driest IMO-OH samples (RH < 10%). For the same dose and for a similar surface mass of all samples (around 200 g.m-2), the absorbance, recorded just after the 7 ps electron pulse at 680 nm, was 0.016 and 0.026 in
11
IMO-CH3 at 3 and 43% RH, and 0.007 and 0.009 for IMO-OH equilibrated at 11 and 43%
RH, respectively. In IMO-CH3, with the increase in RH from 3 to 43%, corresponding to an
increase in external water content from 5.0 to 14.3% (see Table 1), the absorbance increased. In contrast, no signal was detected in IMO-OH equilibrated at 3% RH. In this case, the internal water content was even larger than the external water content in IMO-CH3 (8.8% vs
5.0%, see Table 1), but the external water content in IMO-OH was low (1.4%, see Table 1). This comparison strongly suggests that the electrons were effectively driven out of the NTs, which is in agreement with previous theoretical predictions.6 For IMO-OH equilibrated at 11 and 43% RH, external water content was less than 5.1% (Table 1), and solvated electrons were detected (Fig. S4 in ESI).
Fig. 5 Spectra (symbols) measured in hybrid imogolite (IMO-CH3), at two different RH
values: 3 and 43%. The spectra correspond to an average performed between 7 ps and 4 ns, but were scaled to the value measured 7 ps after the electron pulse for the sake of clarity. The normalized data measured in water (lines) are also given for comparison. The irradiation dose was 115 Gy.
The corresponding kinetics detected in IMO-OH and IMO-CH3 equilibrated at two different
RH values are shown in Fig. 6. The kinetics measured at time shorter than 10 ns correspond to non-homogeneous reactions within the spurs. In all cases except for IMO-CH3 at 43% RH, the
12
decay of the solvated electron is accelerated with respect to the decay of the hydrated electron in bulk water. Although the decay of the solvated electron was difficult to assess in the IMO-OH sample due to very low absorbance, it clearly became slower when RH increased in the IMO-CH3 sample (Fig. 6b). Confinement effects, favoring reactions between species, as well
as reactions between solvated electrons and surface species, were efficient at low RH values. An increase in RH led water molecules to progressively fill pores of larger diameter, resulting in a slowing down of the decay of the solvated electron in IMO-CH3. Interestingly, the decay
of the solvated electron in IMO-CH3 equilibrated at 43% RH is the same as in bulk water,
suggesting that these solvated electrons are located in big mesopores. In contrast, the decay of the solvated electron equilibrated in IMO-OH at 43% RH is slower. This is explained by the fact that there are more big mesopores in IMO-CH3 than in IMO-OH.25
Fig. 6 Normalized kinetics measured in imogolite (IMO-OH, a) and in hybrid imogolite (IMO-CH3, b), at two different RH values: 11 and 43% for OH; 3 and 43% for
IMO-CH3. The kinetics correspond to averages performed in the 670-690 nm wavelength range.
The normalized data measured in water are also given for comparison. The irradiation dose was 115 Gy.
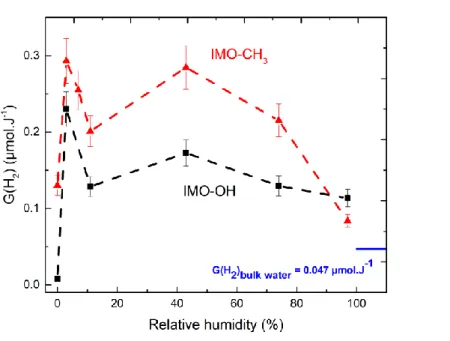
1.5. Gas produced upon irradiation
To better understand the behavior of both imogolites under irradiation, we carried out a gas analysis. From the linear relationship between the amount of gas produced per sample mass unit and irradiation dose (Figs. S5 and S6 in ESI for IMO-OH and IMO-CH3, respectively),
the value of the radiolytic yield (expressed in µmol·J-1), calculated from the energy absorbed by the whole imogolite-water system, can be determined. The change in H2 radiolytic yields
13
Without water (0% RH), the H2 radiolytic yield measured for the dry IMO-OH sample was
very low (< 0.01 µmol·J-1). In the dry IMO-OH sample, only OH groups on the outer surfaces
and silanol groups inside the tubes can contribute to H2 production. These chemical groups
are known to have a weak reactivity under irradiation.38 Noteworthily, the radiolysis of external Al2-µOH groups led to a very negligible H2 yield. For example, their contribution has
been reported to be around 0.001µmol·J-1 in the radiolysis of dry nanostructured aluminum hydroxides.39
The case of dry IMO-CH3 was very different. We measured a significant H2 yield of 0.13
µmol·J-1 at 0% RH. The H2 production measured at this RH value was thus attributed to the
radiolysis of CH3 groups inside the cavity. This difference of about 0.1 µmol·J-1 between the
H2 radiolytic yields measured in IMO-CH3 and in IMO-OH appeared to be maintained across
all the investigated RH values (see the difference curve in Fig. 8). Although the use of a limited number of saturated salt solutions prevents us from describing the exact shape of the H2 yields, Fig. 7 clearly shows that the H2 yield across RH values followed a similar pattern
for both imogolites. The maximum H2 yield was measured at 3% RH, and the yield measured
at 43% RH was significantly higher than those reported for 11 and 74% RH. Except for dry IMO-OH, the H2 yield was efficient, and much larger than that observed in bulk water (Fig.
7). When the dihydrogen radiolytic yields are calculated from energy absorbed by water only (Figs. S7 and S8 in the ESI), they are always significantly larger than the value measured in bulk water (0.047 µmol.J-1), which implies that the energy absorbed by imogolite contributes
to water decomposition, and that it is converted more efficiently into dihydrogen than the energy absorbed by bulk water. Moreover, the values of the dihydrogen radiolytic yields calculated from energy absorbed by water only (Figs. S7 and S8 in the ESI) decrease when the water content increases, hence, the energy transfer efficiency decreases, which is consistent with observations performed in other studies40. This change in efficiency is governed by the interaction between surface –OH groups of imogolite and sorbed water molecules, which varies with the water content.41
In the case of IMO-CH3, other gases were identified using gas chromatography coupled to
mass spectrometry (CH4, C2H4,C2H6 and C3H8). This is in line with the presence of a -78 ppm
peak in the 29Si CP-MAS {1H} spectrum, which revealed the radiolysis of the Si-C bond and thus the release of carbonaceous species (Fig. 4d). The change in radiolytic yield of CH4 as a
function of RH is shown in Fig. 8. The yield was stable with a value around 0.1 µmol·J-1 and decreased at the highest RH values. Noteworthily, the methane yield showed a value similar
14
to that of the H2 yield difference between IMO-CH3 and IMO-OH (Fig. 8). Regarding the
other gases, the respective radiolytic yields were estimated using mass spectrometry at about 0.03 µmol·J-1 for C
2H6, 0.005 µmol.J-1 for C2H4 and 0.003 µmol·J-1 for C3H8 across the whole
RH range. Clearly, the value of the radiolytic yields decreased with the increase in the number of carbon atoms in the formed hydrocarbon. When subjected to accelerated electrons, radiolysis of methane forms H2 with a radiolytic yield of 0.66 µmol·J-1, C2H6 with a yield of
0.22 µmol·J-1, C2H4 with a yield of 0.013 µmol·J-1, C3H8 with a yield of 0.027 µmol·J-1 and
also, in smaller amounts, other hydrocarbons with a higher number of carbon atoms.42 This pattern is similar to the trend that we observed, with a global decrease in yields accompanying an increase in the number of carbons in the compounds formed.
Fig. 7 The H2 radiolytic yield measured in imogolite (IMO-OH, black curve) and in hybrid
imogolite (IMO-CH3, red curve) equilibrated at various relative humidity values. The H2
radiolytic yield measured in bulk water is given for comparison. The error bars are estimated to be about 10%.
15
Fig. 8 CH4 radiolytic yield measured in hybrid imogolite (IMO-CH3)as a function of RH. The
error bars are estimated to be about 10%. The difference between the H2 radiolytic yield in
IMO-CH3 and in imogolite (IMO-OH) is shown in green.
2. Discussion
Irradiation of imogolite leads to the formation of electrons and holes (R1): ImogoliteIonizing radiation→ e−+ h+ (R1).
Following reaction (R1), two precursors, generated outside the NT according to our pulse radiolysis experiments, can account for H2 production: the quasi-free electron and the solvated
electron. In water, it takes roughly 250 fs for the quasi-free electron to become a fully solvated electron.43 The quasi-free electron could not be detected under our experimental
conditions, due to its very short lifetime and to its absorption located in the near-infrared spectral range.44 On the contrary, the solvated electron displayed strong absorption at 680 nm with a molar absorption coefficient ε680nm = 1.902 × 10⁴ L·mol-1·cm-1.37, 45
Absorbance A can be written as
A = ε l c = ε G D l ρ, with ε being the molar absorption coefficient of the solvated electron (here at 680 nm); G, the radiolytic yield of the solvated electron; D, the dose received by the sample (115 Gy); l, the optical path and ρ, the density of the sample. From this equation, the
16 radiolytic yield can be expressed as: 𝐺 = 𝐴
𝜀𝐷𝜎, with σ (equal to l ρ) the surface mass of the
films. The surface mass of the films was equal to 204, 206 and 218 g.m-2 for IMO-OH equilibrated at RH values of 3, 11 and 43%, respectively, and 206, 214 and 225 g.m-2 for IMO-CH3 equilibrated at RH values of 3, 11 and 43%, respectively. Knowing the absorbance
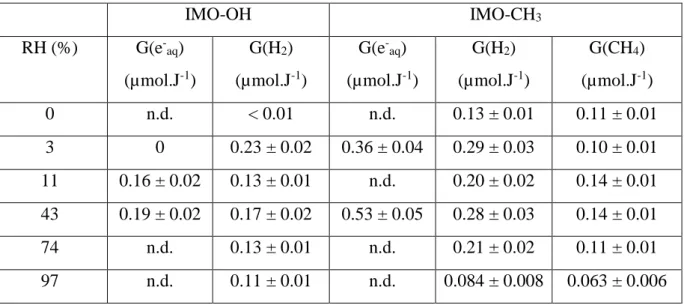
of the irradiated film (see above) and assuming that the molar absorption coefficient of the solvated electron has a similar value in water and in the imogolite films (justified by the fact that the corresponding spectra have the same shape, Fig. 5), it is thus possible to estimate the radiolytic yield of solvated electrons G(e-aq)7 ps 7 ps after the electron pulse. For IMO-OH, this
yield was estimated at (0.16 ± 0.02) µmol.J-1 and (0.19 ± 0.02) µmol.J-1 for RH values of 11 and 43%, respectively. It is of the same order of magnitude as G(H2) (Fig. 7), albeit slightly
higher. For IMO-CH3, this yield significantly increased when RH increased from 3 to 43%. At
3% RH, G(e
-aq)7 ps = (0.36 ± 0.04) µmol.J-1 and G(H2) = (0.29 ± 0.03) µmol.J-1. At 43% RH,
G(e-aq)7 ps = (0.53 ± 0.05) µmol.J-1 and G(H2) = (0.28 ± 0.03) µmol.J-1. The ratio between the
yields of the solvated electron and the dihydrogen production is very different in both types of imogolites from the bulk water situation where G(e-aq)7 ps = 0.44 µmol.J-1 and G(H2) = 0.047
µmol.J-1.42, 45 From this difference, we conclude that the reaction mechanisms accounting for H2 production in the case of hydrated imogolite and in water are markedly different. The
various radiolytic yields measured for both imogolites at various RH values are shown in Table 2.
Table 2. Values of the measured radiolytic yields, expressed in µmol.J-1, as a function of the nature of imogolite and of the RH value. n.d. stands for “not determined”.
IMO-OH IMO-CH3 RH (%) G(e-aq) (µmol.J-1) G(H2) (µmol.J-1) G(e-aq) (µmol.J-1) G(H2) (µmol.J-1) G(CH4) (µmol.J-1) 0 n.d. < 0.01 n.d. 0.13 ± 0.01 0.11 ± 0.01 3 0 0.23 ± 0.02 0.36 ± 0.04 0.29 ± 0.03 0.10 ± 0.01 11 0.16 ± 0.02 0.13 ± 0.01 n.d. 0.20 ± 0.02 0.14 ± 0.01 43 0.19 ± 0.02 0.17 ± 0.02 0.53 ± 0.05 0.28 ± 0.03 0.14 ± 0.01 74 n.d. 0.13 ± 0.01 n.d. 0.21 ± 0.02 0.11 ± 0.01 97 n.d. 0.11 ± 0.01 n.d. 0.084 ± 0.008 0.063 ± 0.006
17
Noteworthily, the H2 production of IMO-OH equilibrated at 3% RH was significant (0.23
µmol.J-1), although no solvated electron was detected. This difference implies that, due to the
limited number of external water molecules, another precursor, i.e. the quasi-free electron, is responsible for the H2 production. The quasi-free electron is indeed known to be an important
precursor of H2.46 In the competition between solvation of the quasi-free electron (leading to
the solvated electron) and water attachment (reaction R2), this latter reaction channel is preferred due to the limited number of water molecules available. Once transferred to water molecules present outside the tubes, a molecular anion is formed (R2).47
e- + H2O H2O●- (R2)
This anion will decompose into the hydride anion, which will quickly react with another water molecule, leading to the formation of H2:47-49
H2O●- H- + ●OH (R3)
H- + H2O H2 + OH- (R4)
Reactions (R3-R4) are proposed in the gas phase and in water ice.47-48 In our case (low RH values), most water molecules are in micropores or adsorbed on the walls of imogolite. Therefore, their behavior is expected to be markedly different from that in bulk water and the corresponding H2 production may thus be very efficient. Note that (R3) leads to the formation
of a hydroxyl radical that may then react with H2. However, the hydroxyl radical may react
preferentially with the external imogolite surface.
It has been also suggested that the water molecular anion can decompose directly to give H2
(together with O●-).50
Another dissociative attachment reaction can also be considered: H2O●- H● + OH- (R5).
However, this channel is reportedly minor in the gas phase.51 The hydrogen atoms will then dimerize giving H2:
H● + H● H2 (R6).
Interestingly, the formation of hydrogen atoms has already been reported in the radiolysis of confining oxides.18, 52 Here, preliminary electron spin resonance (ESR) experiments did not reveal the formation of any hydrogen atoms, regardless of the type of imogolite and the RH value, at irradiation of a dose <10 kGy and for experiments performed at 95 K. However, we cannot conclude that hydrogen atoms were not formed.
When the external water content increases, in the competition between water reduction and solvation, solvation dominates and the quasi-free electron becomes solvated. These solvated electrons are known to lead to the formation of H2:
18 2e
-aq H2 + 2OH- (R7).
When the quasi-free electron attaches to a water molecule, one quasi-free electron leads to the formation of one H2 molecule (reactions R2-R4). On the contrary, two solvated electrons are
required to release one H2 molecule (reaction R7). This contrasting behavior accounts for the
high H2 yield measured at 3% RH value (reactions R2-R4 preferred), whereas the contribution
of the solvated electron to the H2 production increases with RH. In the case of water confined
in micropores formed between nanotubes arranged in a 2D hexagonal phase, the formation of the quasi free electron is of course expected.
In IMO-CH3, the measured absorbance increases by a factor of 1.6 when RH increases from
3% to 43% (Fig. 5). This is in line with the fact that, for a given RH value, more water molecules are present outside the NTs in IMO-CH3 than in IMO-OH and that bigger pores are
filled with water, favoring the formation of solvated electrons rather than reaction (R2) or the reaction of quasi-free electrons with surface species. For a given dose, the initial number of ionizing events was the same regardless of the sample. However, the amount of solvated electrons formed obviously depended on the nature of the imogolite and on the RH value (Table 2). This difference can be explained by reactions involving the precursor of the solvated electron, such as (R2), or reactions of the quasi-free electron with surface species.
With an efficient charge separation, if electrons are transferred outwards, then the holes are driven towards the inside of the NTs. The first effect of charge separation in IMO-OH may be reduced reactivity of the internally confined water molecules due to the recombination of electrons generated in internal water and transferred holes. Note that in this imogolite, direct radiolysis of internal water can also take place, leading to the formation of H2. However, because internal water represents at most 11.8% of the sample mass (see Table
1), its contribution to the total H2 production can be considered minor. More generally, a
discussion about energy partitioning between water and imogolite can be found in the ESI. For IMO-OH, reaction (R8) takes place after the transfer of the holes towards the internal surface of the tube. Note that the Si-O bond is very difficult to cleave. This reaction pathway is therefore not considered here.
SiOH + h+ SiO● + H+ (R8)
To produce H2, the H+ ion must be reduced by an electron. The thus-formed hydrogen atoms
can then dimerize (reaction R6), implying the diffusion of H+ ions outside the tubes. The following equilibrium may then lead to the formation of the hydroxyl radical:53 SiO● + H2O SiOH + HO● (R9).
19
Another reaction, pointed out in zeolites, with a hole transfer process,54 can be invoked to
account for the formation of hydroxyl radicals. h+ + (H
2O)n HO● + (H2O)n-1H+ (R10).
These hydroxyl radicals can recombine to form hydrogen peroxide (H2O2).
For IMO-CH3, H2 is also formed inside the tubes due to the radiolysis of the methyl groups. If
we assume that the H2 production due to water is the same in IMO-OH and IMO-CH3, then
the difference between the H2 production in IMO-CH3 and in IMO-OH gives an insight into
the production due to the radiolysis of the methyl groups inside the tubes (Fig. 8, difference curve). Obviously, the H2 yield produced inside the tubes is very similar to that of CH4 (Fig.
8). This latter yield was almost constant with increasing RH and then decreased at the highest RH values. The energy transferred by the hole can induce two radiolytic bond cleavages on the internal surface of the tube, the Si-C bond or the C-H bond. The following reactions can be proposed after cleavage of the C-H bond:42
h+ + Si-CH
3 Si-CH2+● +H● (R11).
After passivation with water vapor present in the tubes, this reaction mechanism generates Si-CH2OH, H+ and H●.
In the case of the cleavage of the Si-C bond, the following reaction can be proposed: h+ + Si-CH3 Si+● +CH3● (R12).
After passivation with water vapor, Si-OH, H+ and CH
3● are formed.
All the proposed reaction mechanisms are summarized in Fig. 9.
Noteworthily, the formation of Si-OH groups by water vapor passivation after irradiation of IMO-CH3 was demonstrated in the NMR experiments (Fig. 4d). Therefore, upon irradiation,
the hydrophobic surface became slightly hydrophilic. Nevertheless, this conversion was low. Indeed, for 520 kGy irradiation and considering a methane production yield of 0.14 µmol·J-1,
roughly 1.4 % of –SiCH3 groups were replaced by –SiOH groups. In Fig. 4d, the ratio of the
area of the –SiOH species to that of –SiCH3 is equal to 6.7%. However, the 29Si NMR
experiments were performed using the cross-polarization mode and were thus not quantitative. Regarding Si-CH2OH, the formation of these groups was not clearly observed in
the 29Si NMR experiments. However, its chemical shift is not expected to be very different from that of Si-CH3 and changes in the main peak at –43 ppm are noticeable (Fig. 4d).
20
Fig. 9 Schematic of the reaction mechanisms at play in both types of imogolites. Water radiolysis was omitted for clarity. ΔV schematically represents the intra-wall electric field, which is the driving force for charge separation.
Because there are three C-H bonds and one Si-C bond, random bond cleavage would lead on average to one CH3● for three H●. This would result in exactly the same production of CH4
and H2 inside the NTs. This is in line with our radiolytic yield measurements (Fig. 8, see the
CH4 yield and the difference curve). In fact, because the bond energy of the C-H bond (~410
kJ.mol-1) is higher than that of Si-C (~360 kJ.mol-1), a slight excess of CH3● may form. This
may explain the formation of the other gases, such as C2H6, by dimerization of two methyl
radicals.
By considering an average CH4 yield of about 0.14 µmol.J-1 (Fig. 8) and a dose
per-pulse of 27 Gy (used for the gas phase measurements), then a methyl production of 3.8 10-6 mol.kg-1 can be calculated for this dose. Imogolite is a 1D material characterized by M = 7.370 kg.mol-1.nm-1. Each electron pulse leads therefore to the production of ~2.8 10-5 CH3●
per nanometer; in other words, each NT (having a length of a few hundreds of nanometers) produces less than one methyl radical per pulse. This means that for this reaction and also for those involved in the H2 production, the diffusion of the radicals in the gas phase between the
21
available for the gas phase is blocked. This lack of free space accounts for the fact that the gas production yield globally decreased at the highest RH values (Figs. 7 and 8). Moreover, as evidenced on Figs. S7 and S8 in the ESI, the energy transfer efficiency decreases when the water content increases due to a change in the interaction between surface –OH groups and adsorbed water molecules. Lastly, at the highest relative humidity values, radiolysis of water in the big mesopores leads to dihydrogen radiolytic values close to that of bulk water. A salient feature of Fig. 7 arises from the high H2 production for imogolite samples equilibrated
at 3% RH. This high H2 production is explained above as being due to reactions involving the
quasi-free electron (reactions R2-R4). The further the water molecules are from the imogolite walls, the more their behavior becomes similar to that of bulk water: solvated electrons are formed, leading to less H2 than the quasi-free electrons (reactions R2-R4 vs. R7). Clearly,
these explanations do not account for the detection of the secondary H2 production maximum
observed for imogolite equilibrated at 43% RH (Fig. 7). Among other explanations, the diffusion of H+ ions outside the NTs and their subsequent reduction by electrons, leading then to H2 formation, may be favored in this RH value range. Lastly, in the case of IMO-OH, the
highest H2 yield value measured was (0.23 ± 0.02) µmol·J-1 (sample equilibrated at 3% RH).
Interestingly, this value is the same as the maximum possible value in water: 0.22 µmol·J-1.20 In addition to the reaction involving the quasi-free electron, H2 can be very efficiently
protected from its reaction with the ●OH radical, as already observed in heterogeneous materials containing water and nanostructured oxides.18, 20-21 These reasons account for the
particular behavior of this imogolite.
3. Conclusions
Electrons and holes were generated by irradiation in two types of inorganic NTs: IMO-OH, for which hydroxyl groups pave the internal and external surfaces of the tubes, and hybrid IMO-CH3 for which internal groups consist of Si-CH3 bonds, making the internal cavity
hydrophobic, while the external surface remains hydrophilic. As soon as a few water molecules are present in IMO-OH, the H2 production is significant (> 0.1 µmol.J-1). This H2
production is due to electrons that are driven outside the tubes. When the external water content is very low ( 1%), the solvation of electrons is not possible. The quasi-free electron attaches to a water molecule, thereby generating the water radical anion. This anion releases
22
the hydride anion, which forms H2 after reaction with a water molecule. When the external
water content is higher, solvated electrons can be formed and then lead to the release of H2.
The H2 production is higher (by roughly 0.1 µmol.J-1) in IMO-CH3 than in IMO-OH. This
difference is attributed to the fate of the holes which are driven to the inside of the NT cavity. Their reaction with Si-CH3 groups leads to H2 and methane production. All these experiments
indicate that electrons and holes are efficiently separated in imogolites, with electrons (resp. holes) being driven to the outside (resp. inside) of the NT. Our results experimentally confirm the curvature-induced wall polarization of imogolite and call for more investigations on their efficiency as a photocatalyst.
4. Experimental section
a. Sample preparation
Natural imogolite (IMO-OH) was synthesized following methods inspired by Farmer et al.
55-56 All chemicals were used as received. AlCl
3 (Alfa Aesar, 99%) was dissolved in MilliQ
water at a concentration of 2 mM together with tetraethoxysilane (TEOS, Aldrich, 98%) at a Si/Al molar ratio of 0.55. A slightly higher ratio than the stoichiometric Si/Al ratio (0.5) was used to prevent the formation of undesired hydroxyaluminum (gibbsite). Under continuous stirring, NaOH (Sigma-Aldrich, ≥ 97%) was slowly introduced in the solution at a rate of 0.5 mM·min-1 until a OH/Al molar ratio of 2.0 was reached. The suspension was stirred for 1 h after NaOH injection until the solution was completely clear. The suspension was then placed in an oven for 5 days at a temperature of 90°C. After heating, the suspension was concentrated by tangential ultrafiltration using 8 kDa membranes. The concentrated suspension was then dialyzed against MilliQ water.
Hybrid imogolite (IMO-CH3) was prepared using a protocol inspired by Bottero et al.11
Aluminum-tri-sec-butoxide (ASB, Aldrich, 97%) was added to 800 mL of an HClaq solution
(40 mM, Sigma-Aldrich, ACS reagent, 37%) with an HCl/Al molar ratio of 0.5 and stirred for 1 h. Trimethoxymethylsilane (Aldrich, 99%) was slowly added to obtain a Si/Al molar ratio of 0.6. As for IMO-OH, this molar ratio is higher than the stoichiometric ratio of 0.5 to avoid the production of hydroxyaluminum by-products.57 The dispersion was then heated in an oven for 5 days at 90°C. Lastly, the dispersion was dialyzed against Milli-Q water using an 8 kDa membrane.
23
To obtain a powder, both types of imogolite dispersions were freeze-dried at –57°C under vacuum (0.035 mbar) using a Christ BETA 1-8 LDplus freeze-dryer. Samples were frozen either with liquid nitrogen or in a freezer overnight.
Films of imogolites were produced from a concentrated dispersion of imogolite using a Büchner set-up with a 0.22 µm filter. Films of 202 g·m-2 for IMO-OH and 195 g·m-2 for IMO-CH3 were obtained.
For dry samples (relative humidity, RH = 0%), the imogolite powder was heated under vacuum (1.5 mbar) at 220°C for IMO-OH and at 110°C for IMO-CH3 for 12 h. In the other
cases, to control the water content within imogolites, and after the drying treatment, we used desiccators containing saturated salt solutions, which determine the RH value (silica gel: 3%, LiBr saturated solution: 7%, LiCl saturated solution: 11%, K2CO3 saturated solution: 43%,
NaNO3 saturated solution: 74%, and K2SO4 saturated solution: 97%). Both powders and films
were stored until the equilibrium was reached. Sample weight stability for at least 3 weeks attested to the equilibrium state in the desiccators.
Regarding the films, the thickness of the film, measured with a caliper, was 280 and 290 µm for IMO-CH3 equilibrated at 3 and 43% RH, respectively, while it was 150 µm for IMO-OH
equilibrated at 11 and 43% RH. However, the surface mass of all films was rather similar in all cases (around 200 g.m-2).
b. Small-angle X-ray scattering experiments
Small-angle X-ray scattering (SAXS) curves were acquired at a wavelength of 1.542 Å (Cu Kα) under vacuum with a Xeuss 2.0 apparatus (Xenocs). The intensity was plotted against the scattering vector q = 4π∙sin(θ)∙λ-1, with λ the wavelength and 2θ the scattering angle. The
displayed q range from 0.037 nm-1 to 11.0 nm-1 was attained with two sample-to-detector
distances. The latter was calibrated with tetradecanol and the detector count was normalized by direct beam measurements. Powders were placed between two Kapton sheets. Standard procedures were applied to subtract background scattering and to normalize the intensities.58
c. Water adsorption/desorption isotherms
Complete water vapor adsorption-desorption isotherms at 25°C were obtained using a MicrotracBEL Belsorp-Max volumetric adsorption analyzer equipped with three pressure sensors (133 kPa, 1.33 kPa and 13.3 Pa). In the case of the water vapor isotherm, a long acquisition time (7 days per isotherm) was required due to the slow equilibrium kinetics.
24
Isotherms were acquired for IMO-OH and IMO-CH3. Samples were initially outgassed at
100°C under vacuum (~3 x 10⁻⁶ Pa) for 20 h.
d. Magic-angle spinning nuclear magnetic resonance spectroscopy (MAS NMR)
NMR data were collected on a Bruker AVANCE II 500WB spectrometer operating at a magnetic field of 11.72 T using ZrO2 rotors (outer diameter 4 mm) and Bruker CPMAS
probes at a spinning frequency of 12 500 Hz. 27Al (I = 5/2) MAS NMR spectra were acquired using a short single-pulse excitation of 1 μs (tip angle ∼10°, to ensure the quantitativeness of the spectra due to the non-homogeneous excitation of all sites with respect to their quadrupolar interaction strength) and a recycle delay of 1 s. 29Si (I = 1/2) spectra were
acquired using 1H cross-polarization with a contact time of 2 ms. The data were processed using an in-house made code.
e. Irradiation experiments
Picosecond pulse radiolysis experiments at ELYSE
The ultrafast kinetics induced by irradiation in imogolite films was obtained by picosecond-pulse radiolysis with the laser-driven electron accelerator ELYSE.59-60 The pump-probe setup, the optical configuration and the data acquisition scheme can be found in references59-60. The electron pulses were delivered with a pulse duration of about 7 ps and an electron energy of 7.6 MeV at a repetition rate of 5 Hz.
Both probe and reference beams were coupled into an optical fiber, transmitted to an adapted spectrometer, and dispersed onto the specific line-scan detectors. The films were put in specially-designed and tightly-closed sample-holders having a saturated salt solution container allowing for the control of the RH during the experiments. The sample holders have two quartz glasses on both sides of the film with a thickness of 200 µm.
The dose per pulse was deduced from the absorbance of the hydrated electron in water, measured just before a series of experiments. The dose was then derived from the yield at 7 ps: G(e
-aq)7ps = 0.44 µmol·J-1 and from the molar absorption coefficient ε800nm = 1.5 x 10⁴
L·mol -1·cm-1.45 The dose per pulse in water was then around 115 Gy. In all irradiation
experiments, the dose received by the sample and by water was considered to be the same, within the experimental error bars.
25 Irradiation for gas phase measurements
To perform gas phase measurements, the samples (approximately 300 mg) were placed in a Pyrex glass ampoule (about 10 mL) and were subjected to the standard procedure described in reference61. Briefly, the ampoule was outgassed in liquid nitrogen to prevent water desorption. It was then quickly filled with 1.5 bar of ultra-pure argon (99.9999%). This operation was repeated three times to ensure the clean removal of air before the first irradiation step and then once between every irradiation step. Irradiation was performed using 10 MeV electron pulses of a Titan Beta, Inc. linear accelerator (LINAC).62 The duration of the pulse was 10 ns and the repetition rate was set to 2 Hz to avoid any macroscopic heating of the sample during irradiation. The dose per pulse (27 ± 3 Gy·pulse−1, with 1 Gy = 1 J·kg−1) was determined using the Fricke dosimetry.63 This dose was considered to be the same as the dose received by the imogolite samples according to the Fano theorem.64 For H2 production experiments, the
total dose received by the samples reached a maximum of 180 kGy.
f. Identification and quantification of the products formed in the gas phase
H2 and CH4 formed by irradiation were measured using gas phase chromatography
(μGC-R3000 SRA Instrument) with ultrahigh purity argon as the carrier gas. Prior to the analysis, the gas contained in the ampoule was diluted in argon at a total pressure of 1.5 bar for 5 min. The production of other gases was measured using a gas mass spectrometer working with an electron impact ionization source, a magnetic sector and a direct inlet. The detection limit was 1 ppm and the mass range went from 1 to 200 amu. More details can be found in 61.
Electronic supplementary information (ESI) available:
Fig. S1 (resp. Fig. S2) shows 27Al MAS spectra of IMO-OH before (after, resp.) irradiation together with the corresponding simulation. Fig. S3 shows 29Si MAS spectra of IMO-OH before and after irradiation, spectra measured in IMO-OH equilibrated at 43% RH. Fig. S4 (resp. Fig. S5) shows the evolution of the H2 production as a function of the irradiation dose
for IMO-OH (IMO-CH3, resp.) equilibrated at various RH values. Fig. S6 (resp. S7) shows
the evolution of the H2 radiolytic yield normalized by the proportion of water as a function of
the water content in IMO-OH (IMO-CH3, resp.). A discussion on the energy partitioning
26
Conflicts of interest
There are no conflicts to declare.
Acknowledgements
Ecole Doctorale 2MIB is gratefully acknowledged for the PhD grant, as well as RESPORE for the funding of the GRANITE project. We also acknowledge the French EMIR&A network for provision of irradiation beam time. Dr Jean Philippe Renault and Dr Luc Belloni are gratefully acknowledged for fruitful discussions.
References
1 M. R. Hoffmann, S. T. Martin, W. Choi and D. W. Bahnemann, Chem. Rev., 1995, 95, 69-96.
2 M. A. Fox and M. T. Dulay, Chem. Rev., 1993, 93, 341-357.
3 J. Schneider, M. Matsuoka, M. Takeuchi, J. Zhang, Y. Horiuchi, M. Anpo and D. W. Bahnemann, Chem. Rev., 2014, 114, 9919-9986.
4 F. Chen, H. Huang, L. Guo, Y. Zhang and T. Ma, Angew. Chem. Int. Ed., 2019, 58, 10061-10073.
5 D. Lu, Y. Li, S. V. Rotkin, U. Ravaioli and K. Schulten, Nano Lett., 2004, 4, 2383-2387.
6 E. Poli, J. D. Elliott, L. E. Ratcliff, L. Andrinopoulos, J. Dziedzic, N. D. M. Hine, A. A. Mostofi, C.-K. Skylaris, P. D. Haynes and G. Teobaldi, J. Phys. : Condens. Matter, 2016,
28, 074003.
7 S. U. Lee, Y. C. Choi, S. G. Youm and D. Sohn, J. Phys. Chem. C, 2011, 115, 5226-5231.
8 T. Lange, T. Charpentier, F. Gobeaux, S. Charton, F. Testard and A. Thill, Langmuir, 2019, 35, 4068-4076.
9 B. Bonelli, Surface Chemical Modifications of Imogolite. In Nanosized Tubular Clay Minerals. Halloysite and Imogolite, P. Yuanand A. B. Thill, F., Eds. Elsevier: Amsterdam, 2016; pp 279-330.
10 E. Paineau, App. Sci. - Basel, 2018, 8, 1921.
11 I. Bottero, B. Bonelli, S. E. Ashbrook, P. A. Wright, W. Zhou, M. Tagliabue, M. Armandi and E. Garrone, Phys. Chem. Chem. Phys., 2011, 13, 744-750.
12 M. Boyer, E. Paineau, M. Bacia-Verloop and A. Thill, Applied Clay Science, 2014, 96, 45-49.
13 M.-S. Amara, E. Paineau, S. Rouzière, B. Guiose, M.-E. M. Krapf, O. Tache, P. Launois and A. Thill, Chem. Mat., 2015, 27, 1488-1494.
14 E. Poli, J. D. Elliott, S. K. Chulkov, M. B. Watkins and G. Teobaldi, Front. Chem., 2019, 7, 210.
15 P. Picot, O. Tache, F. Malloggi, T. Coradin and A. Thill, Faraday Discussions, 2016,
27
16 P. Picot, F. Gobeaux, T. Coradin and A. Thill, Applied Clay Science, 2019, 178, 4. 17 S. Le Caër, Water, 2011, 3, 235-253.
18 M. Lainé, E. A. Balan, Th. , F. Martin, H.-J. von Bardeleben, J.-L. Robert and S. Le Caër, J. Phys. Chem. C, 2016, 120, 2087-2095.
19 M. Lainé, E. Balan, T. Allard, E. Paineau, P. Jeunesse, M. Mostafavi, J.-L. Robert and S. Le Caër, RSC Adv., 2017, 7, 526-534.
20 P. Rotureau, J. P. Renault, B. Lebeau, J. Patarin and J. C. Mialocq, ChemPhysChem, 2005, 6, 1316-1323.
21 S. Le Caër, P. Rotureau, F. Brunet, T. Charpentier, G. Blain, J. P. Renault and J.-C. Mialocq, ChemPhysChem, 2005, 6, 2585-2596.
22 J. K. Thomas, Chem. Rev., 2005, 105, 1683-1734.
23 Y. Liao, P. Picot, J.-B. Brubach, P. Roy, S. Le Caër and A. Thill, Appl. Clay. Sci., 2018, 164, 58-67.
24 Y. Liao, P. Picot, M. Lainé, J.-B. Brubach, P. Roy, A. Thill and S. Le Caër, Nano Res. , 2018, 11, 4759-4773.
25 S. Le Caër, M.-C. Pignié, Q. Berrod, V. Grzimek, M. Russina, C. Carteret, A. Thill, J.-M. Zanotti and J. Teixeira, Nanoscale Adv., 2021, https://doi.org/10.1039/D0NA00765J. 26 E. Paineau, M. S. Amara, G. Monet, V. Peyre, S. Rouzière and P. Launois, J. Phys. Chem. C, 2017, 121, 21740-21749.
27 P. Picot, Y. Y. Liao, E. Barruet, F. Gobeaux, T. Coradin and A. Thill, Langmuir, 2018,
34, 13225-13234.
28 A. Thill, P. Picot and L. Belloni, Appl. Clay Sci., 2017, 141, 308-315.
29 Y. Y. Liao, P. Picot, J. B. Brubach, P. Roy, A. Thill and S. Le Caer, J. Phys. Chem. C, 2019, 123, 19768-19777.
30 S. Konduri, H. M. Tong, S. Chempath and S. Nair, J. Phys. Chem. C, 2008, 112, 15367-15374.
31 D. Or and M. Tuller, Water Resources Res., 1999, 35, 3591-3605.
32 B. A. Goodman, J. D. Russell, B. Montez, E. Oldfield and R. J. Kirkpatrick, Phys. Chem. Miner., 1985, 12, 342-346.
33 G. I. Yucelen, R. P. Choudhury, A. Vyalikh, U. Scheler, H. W. Beckham and S. Nair, J. Am. Chem. Soc., 2011, 133, 5397-5412.
34 G. I. Yucelen, D.-Y. Kang, R. C. Guerrero-Ferreira, E. R. Wright, H. W. Beckham and S. Nair, Nano Lett., 2012, 12, 827-832.
35 P. F. Barron, M. A. Wilson, A. S. Campbell and R. L. Frost, Nature, 1982, 299, 616-618.
36 Y. Kimura, J. C. Alfano, P. K. Walhout and P. F. Barbara, J. Phys. Chem., 1994, 98, 3450-3458.
37 F. Torche and J. L. Marignier, J. Phys. Chem. B, 2016, 120, 7201-7206.
38 N. Brodie-Linder, S. Le Caër, M. S. Alam, J. P. Renault and C. Alba-Simionesco, Phys. Chem. Chem. Phys., 2010, 12, 14188-14195.
39 J. A. Kaddissy, S. Esnouf, D. Durand, D. Saffre, E. Foy and J.-P. Renault, J. Phys. Chem. C, 2017, 121, 6365-6373.
40 J. A. LaVerne and L. Tandon, J. Phys. Chem. B, 2003, 107, 13623-13628. 41 M. Nakashima and E. Tachikawa, J. Nucl. Sci. Technol., 1987, 24, 41-46.
42 J. W. T. Spinks and R. J. Woods, An Introduction to Radiation Chemistry, 3rd ed.; Wiley-Interscience Publication: New York, USA, 1990, p 243-313.
43 A. Balcerzyk, U. Schmidhammer, F. R. Wang, A. de la Lande and M. Mostafavi, J. Phys. Chem. B, 2016, 120, 9060-9066.
28
45 F. Wang, U. Schmidhammer, J.-P. Larbre, Z. Zong, J.-L. Marignier and M. Mostafavi, Phys. Chem. Chem. Phys., 2018, 20, 15671-15679.
46 J. A. LaVerne and S. M. Pimblott, J. Phys. Chem. A, 2000, 104, 9820-9822.
47 G. A. Kimmel, T. M. Orlando, C. Vezina and L. Sanche, J. Chem. Phys., 1994, 101, 3282-3286.
48 P. Rowntree, L. Parenteau and L. Sanche, J. Chem. Phys., 1991, 94, 8570-8576.
49 V. Cobut, J. P. JayGerin, Y. Frongillo and J. P. Patau, Rad. Phys. Chem., 1996, 47, 247-250.
50 M. G. Curtis and I. C. Walker, J. Chem. Soc.-Faraday Trans, 1992, 88, 2805-2810. 51 C. E. Melton, J. Chem. Phys. , 1972, 57, 4218-4225.
52 S. C. Chemirisov and A. D. Trifunac, Chem. Phys. Lett., 2001, 347, 65-72. 53 J. Narayanasamy and J. D. Kubicki, J. Phys. Chem. B, 2005, 109, 21796-21807. 54 X. Liu, G. Zhang and J. K. Thomas, J. Phys. Chem. B, 1997, 101, 2182-2194.
55 V. C. Farmer, A. R. Fraser and J. M. Tait, J. Chem. Soc.-Chem. Comm., 1977, 13, 462-463.
56 V. C. Farmer, M. J. Adams, A. R. Fraser and F. Palmieri, Clay Miner., 1983, 18, 459-472.
57 P. Picot, Y. Liao, E. Barruet, F. Gobeaux, T. Coradin and A. Thill, Langmuir, 2018,
34, 13225-13234.
58 P. Lindner, Scattering Experiments: Experimental Aspects, Initial Data Reduction and Absolute Calibration. In Neutrons, X-Rays and Light: Scattering Methods Applied to Soft Condensed Matter, P. Lindnerand T. Zemb, Eds. Elsevier: Amsterdam, 2002; pp 23-48. 59 J. Belloni, H. Monard, F. Gobert, J. P. Larbre, A. Demarque, V. De Waele, I. Lampre, J. L. Marignier, M. Mostafavi, J. C. Bourdon, M. Bernard, H. Borie, T. Garvey, B. Jacquemard, B. Leblond, P. Lepercq, M. Omeich, M. Roch, J. Rodier and R. Roux, Nucl. Instrum. Methods Phys. Res. A, 2005, 539, 527-539.
60 U. Schmidhammer, A. K. El Omar, A. Balcerzyk and M. Mostafavi, Rad. Phys. Chem., 2012, 81, 1715-1719.
61 D. Ortiz, V. Steinmetz, D. Durand, S. Legand, V. Dauvois, P. Maître and S. Le Caër, Nature Comm., 2015, 6, 6950.
62 J. C. Mialocq, B. Hickel, G. Baldacchino and M. Juillard, J. Chim. Phys., 1999, 96, 35-43.
63 H. Fricke and E. J. Hart, Chemical Dosimetry. In Radiation Dosimetry, Second Edition ed.; F. H. Attixand W. C. Roesch, Eds. Academic press: New York and London, 1966; Vol. 2, pp 167-232.