HAL Id: hal-01795470
https://hal.archives-ouvertes.fr/hal-01795470
Submitted on 18 May 2018HAL is a multi-disciplinary open access
archive for the deposit and dissemination of sci-entific research documents, whether they are pub-lished or not. The documents may come from teaching and research institutions in France or abroad, or from public or private research centers.
L’archive ouverte pluridisciplinaire HAL, est destinée au dépôt et à la diffusion de documents scientifiques de niveau recherche, publiés ou non, émanant des établissements d’enseignement et de recherche français ou étrangers, des laboratoires publics ou privés.
Filipino case study
Joël Aubin, Aurèle Baruthio, Rattanawan Mungkung, Jérôme Lazard
To cite this version:
Joël Aubin, Aurèle Baruthio, Rattanawan Mungkung, Jérôme Lazard. Environmental performance of brackish water polyculture system from a life cycle perspective: A Filipino case study. Aquaculture, Elsevier, 2015, 435, pp.217 - 227. �10.1016/j.aquaculture.2014.09.019�. �hal-01795470�
Jo¨el Aubin, Aur`ele Baruthio, Rattanawan Mungkung, Jerome Lazard PII: S0044-8486(14)00468-2
DOI: doi:10.1016/j.aquaculture.2014.09.019
Reference: AQUA 631348 To appear in: Aquaculture
Received date: 28 June 2013 Revised date: 12 September 2014 Accepted date: 16 September 2014
Please cite this article as: Aubin, Jo¨el, Baruthio, Aur`ele, Mungkung, Rattanawan,
Lazard, Jerome, Environmental performance of brackish water polyculture system
from a life cycle perspective: A Filipino case study, Aquaculture (2014), doi:
10.1016/j.aquaculture.2014.09.019
This is a PDF file of an unedited manuscript that has been accepted for publication. As a service to our customers we are providing this early version of the manuscript. The manuscript will undergo copyediting, typesetting, and review of the resulting proof before it is published in its final form. Please note that during the production process errors may be discovered which could affect the content, and all legal disclaimers that apply to the journal pertain.
ACCEPTED MANUSCRIPT
Environmental performance of brackish water polyculture system from a life cycle
perspective: A Filipino case study.
Joël Aubin1,2, Aurèle Baruthio1,2,4, Rattanawan Mungkung3, Jerome Lazard4
1
INRA, UMR1069, Sol Agro et hydrosystème Spatialisation, F-35000 Rennes, France
2
AGROCAMPUS Ouest, UMR1069, Sol Agro et hydrosystème Spatialisation, F-35000 Rennes, France
3
Centre of Excellence on enVironmental strategy for GREEN business and Department of Environmental Technology and Management, Faculty of Environment, Kasetsart University, 50 Ngamwongwan Rd, Ladyao,Chatuchak, Bangkok 10903, Thailand
4
CIRAD, UPR « Aquaculture et gestion des ressources aquatiques », Département Persyst, TA B-20/01, Avenue Agropolis, F-34398 Montpellier, France
Corresponding author : Joël Aubin
e.mail : joel.aubin@rennes.inra.fr
Abstract
Life Cycle Assessment (LCA) was applied to assess the environmental performance of brackish water polyculture of black tiger prawn, mud crabs, tilapia and milkfish in a pond aquaculture system. The study was conducted on 15 production sites, located in Pampanga province of the Philippines. The scope of analysis covered the hatchery or capture of juveniles from the wild up to the delivery of products to auction markets. Impact categories included eutrophication, acidification, climate change, land occupation, net primary production use, total cumulative energy demand (TCED), and total human labour. Life cycle impact indicators were calculated for one tonne of product (total production or that of individual species) using both energy-based and economic allocations. The results indicated that the main impacts from farming operations were eutrophication, land occupation, acidification and human labour. Feed (molluscs harvested from aquatic ecosystems) mainly influenced net primary production use, TCED and climate change, and harvesting and delivery mainly influenced climate change and TCED. Differences in farm practices and yields induced high variability in impacts. Production site size had no significant effect; however, its distance from the sea appeared to affect its efficiency and, consequently, impacts. Changing the allocation method changed the ranking of species’ impacts within each impact category, milkfish having the highest impacts with energy-based allocation and prawn and crabs having the highest impacts with economic allocation. The lack of differences in impacts between intensive monocultures of prawn and tilapia recorded in the literature and the same species in Pampanga’s polyculture suggests that the degree of intensification is not a relevant concept for distinguishing impacts of aquaculture systems.
ACCEPTED MANUSCRIPT
1. IntroductionPolyculture is an approach of culturing multiple species in the same space (Milstein, 2005). Though it originated in agricultural systems, it also has been applied in aquaculture systems, mainly to efficiently increase utilization of natural foods in ponds with multiple trophic levels of cultured species. It is dominant mainly in Asia, especially for local communities, to provide a sustainable livelihood and sources of nutrition (FAO, 2012). The Philippines developed aquaculture along its coast more than 300 years ago. Aquaculture production in the Philippines reached 744,000 tonnes in 2010, ranking 9th in the Asiatic region (FAO, 2012), and plays a significant role in the country’s economy (BFAR, 2004). In the Philippines, Pampanga province is one of the main production areas for brackish water polyculture based on a pond aquaculture system. This brackish water polyculture system is located in an estuary that opens onto Manila Bay (Luzon Island) and occupies more than 16,000 ha of ponds in the province. Three to four species are associated with this system: tiger prawn (Penaeus monodon), mud crabs (Scylla serrata and S. olivacea), milkfish (Chanos chanos) and, in areas further from the sea, tilapia (Oreochromis niloticus). Native and introduced wild fish (detailed later) are also part of the polyculture. The rationale for this polyculture system is the combination of complementary species that use different habitats in the pond ecosystem, such as the bottom (tiger prawn and crabs) or the water column (milkfish and tilapia). These species, despite being opportunistic omnivores, also feed on different trophic levels, tiger prawn and crabs focus more on detritus and milkfish and tilapia focuses more on plankton. Moreover, these species meet different market demands: milkfish and tilapia supply the local market, while tiger prawns and crabs are marketed in large cities (mainly in the Philippines).
Performance of polyculture systems is debatable in terms of sustainability, particularly when compared to the results of monoculture. The Life Cycle Assessment (LCA) method has been previously applied to assess the environmental performance of intensive fish-production systems, especially for salmonids (Papatryphon et al., 2004a,b; Pelletier et al., 2007; Pelletier and Tyedmers, 2007; Aubin et al., 2009; d’Orbcastel et al., 2009; Boissy et al., 2011; Samuel-Fitwi et al., 2012). However, there are few available studies on pond systems (Mungkung et al., 2005; Pelletier and Tyedmers, 2010; Bosma et al., 2011; Cao et al., 2011; Cao et al., 2013) and even fewer on extensive polyculture systems (Casaca, 2008; Phong et al., 2011; Efole-Ewoukem et al., 2012). However, no studies have been performed on polyculture systems in Asia. Therefore, this study aims to: (1) estimate environmental impacts of this type of polyculture system, (2) define the principal sources of the impacts, (3) discuss their allocation among the species, and (4) compare impacts of this polyculture system to those of intensive fish farming systems.
2. Materials and methods 2.1 Production system
A sample of farms, representative of common practices, was surveyed to conduct the environmental study. Three tiger prawn hatcheries were studied in Zambales, Pangasinan and Quezon Provinces in the east, northeast and west of Luzon Island, respectively. The main difference among them concerns the feed, which is based either exclusively on diatoms (Skeletonema spp.) or on diatoms supplemented with concentrated feeds or brine shrimp (Artemia spp.). Broodstock are fished from the sea with small trawlers. Tiger prawn larvae in Pampanga come mainly from Luzon Island, but also from Mindanao and the Visayas islands. Two tilapia hatcheries were studied in Pampanga, the main production area for tilapia fingerlings on Luzon Island. Milkfish fingerlings are either fished from the sea or provided by Indonesian or Taiwanese hatcheries. When fished, they are caught by hand using a 15-meter-long net. The main fishing area is at Iba, Zambales Province. Once caught, they are transported to Bulacan Province (next to Pampanga Province) and are fed in pre-growing ponds for two months before being sent to Pampanga. About 50% of the fingerlings are fished and 50% are purchased from foreign hatcheries. For the LCA, capture of milkfish fingerlings from the sea was assumed. Crab larvae are collected by hand in the river and mangrove (using a landing net) in two main locations: Aparri Estuary (north of Luzon Island) for the orange mud crab (S. serrata) and Sorsogon Bay (southeast of Luzon Island) for the king mud crab (S. olivacea).
ACCEPTED MANUSCRIPT
Fifteen production sites were surveyed in Pampanga. Each production site is a pond with its surrounding area depending on a farm, which is defined by its surface area, location and production practices. The ponds range in size from 1-101 ha. In this area the mean pond size is 19.4 ha (Grandmougin, 2003). Depending on the size, one or more employees manage the production site and live on the dykes permanently. Several ponds can be operated by the same farmer. Since tiger prawn is the most profitable species in the polyculture, farm activity is mainly organised around its production cycle, which lasts 3-4 months (Fig. 1). Crabs, representing the second most valuable product, are produced in six months. The production cycles of tiger prawns and crabs are independent, as crabs can be harvested without draining ponds. Tilapia and milkfish are sorted at each tiger prawn harvest into large fish that can be sold and small fish that are transferred into another grow-out pond. Consequently, fish are produced in 3-9 months depending on their growth rate and farmers’ decisions. Infrastructure is generally limited to the wood or concrete house of the permanent caretaker, motorised boats (made of epoxy resin and fibreglass) and concrete water gates of the pond. The main tiger prawn feed consists of horn snails (Cerithium tenellum), considered a pest (Bagarinao and Lantin-Olaguer, 2000), and mangrove whelk (Telescopium telescopium), collected either from a river by the farmer or, for farmers operating several production sites, from Manila Bay (60 km from Pampanga), from where it is transported by truck. Depending on farmer practices, other feeds are distributed in limited quantities during the first weeks of the production cycle as a supplement; for example, trash fish from the previous harvest or the local markets, or in rare cases, frymass. Chemicals and fertilisers commonly used are lime and urea (16-0-0), respectively.
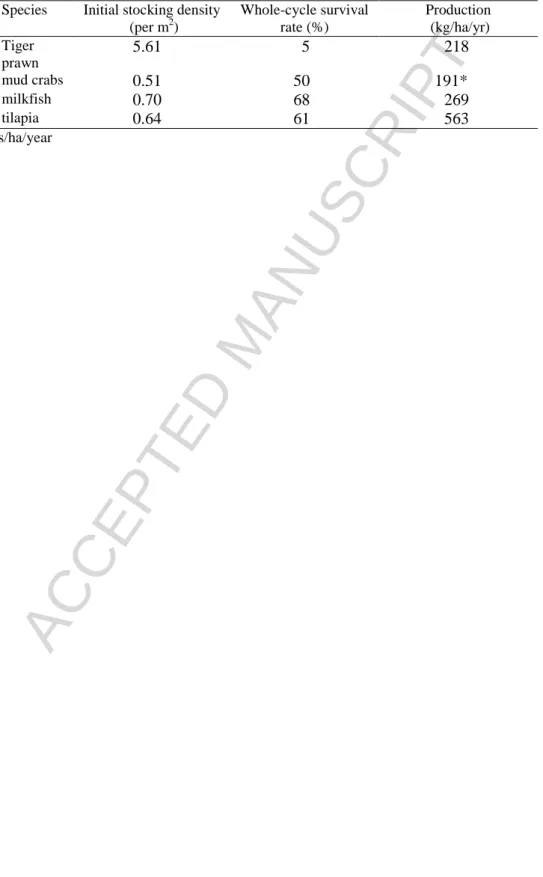
One of the main concerns in the polyculture system is an extremely high mortality rate (up to 95%) of tiger prawn post-larvae (Table 1). Several factors may be responsible, including water pollution, interspecies competition (especially with crabs) and insufficient river flow due to Mt. Pinatubo’s eruption, in 1991. Nevertheless, the commonly held cause is the presence of white-spot disease in the ponds, a viral syndrome, which caused major abandonment of tiger prawn monoculture in the Philippines in the 1990s (FAO, 2005). It also must be noted that the fishponds of Pampanga were historically adapted for milkfish culture, not for shrimp. Survival rates of the other three species range from 50-68%.
As previously mentioned, some native and introduced species from the wild are found in Pampanga fishponds. Native species include silver perch (Bidyanus bidyanus), snakehead murrel (Channa striata), goby (Callogobius tanegasimae), and Indian white shrimp (P. indicus), while introduced species include blue tilapia (O. aureus) and white leg shrimp (L. vannamei). These “wild fish” harvested from ponds can represent up to 10% of the gross income of a production site. This was included in the inventory by estimating a mean mass of wild fish per ha.
Ponds are drained using water pumps during the shrimp harvest. Temporary workers are employed for the entire harvest. Transport to market is performed by boat and/or jeep, depending on production site location. Fish and crabs are usually transported separately from shrimp, as the former are sold in local markets and the latter in regional markets.
2.2 Environmental impact assessment
LCA is a standardised method (ISO, 2006a; ISO, 2006b) conceived to assess potential impacts associated with producing a product by quantifying and evaluating the resources consumed and emitted into the environment at all stages of its life cycle, from raw material extraction up to its end-of-life (Guinée et al., 2002). Each substance emitted or consumed is assigned to indicators in one or more impact categories as a function of its potential environmental effects, according to scientific literature. Impact categories were selected based on previous studies and guidelines in aquaculture LCA (Pelletier et al., 2007; Aubin et al., 2009; Henriksson et al., 2012; Aubin et al., 2013): climate change (kg CO2-eq.), acidification (kg SO2-eq.), eutrophication (kg PO4-eq.), and land occupation
(m2y) were calculated using the characterisation factors of CML2 Baseline 2000 version 2.03 (Guinée et al., 2002). Energy use (MJ) was calculated according to the Total Cumulative Energy Demand (TCED) method, version 1.03 (Frischknecht et al., 2004). Net Primary Production Use (NPPU), as defined by Pauly and Christensen (1995), refers to the biotic resource used in terms of carbon contents as a result of net carbon flux in the trophic chain involved in feed provision; it was calculated according to Papatryphon et al. (2004b). No toxicity impact categories were included in the study due to the lack of reliable models adapted to tropical brackish water. Water dependence or use was not
ACCEPTED MANUSCRIPT
included, as most of it is brackish and cannot be used for other purposes, and the large amount of water passing through the ponds leads to high variability and uncertainty in flux estimates. In addition, human labour (man.day), referring to the number of nominal 8-hour work days necessary to perform the main production stages (fry hatchery or capture, feed harvesting, pond operations, fish harvesting and transportation at each stage up to markets) was added to the list of environmental impacts. Calculation was performed using Simapro® 7.0 software and the ecoinvent v2.2 database (Swiss Centre for Life Cycle Inventories, 2010) as secondary data. Many items in the ecoinvent v2.2 database were adapted to the local context, in particular the local energy mix for producing electricity (Sharma et al., 2004).
Data were collected from April-June 2007 from each stage of the production network: hatcheries, production sites (n=15), feed and fish seed providers and auction markets. Analysis was based on one year of production. Data include all inputs and outputs of the system, including pollutant emissions. From these data, we defined a standard polyculture system, whose boundaries include (1) producing fry/fingerlings at a hatchery (tiger prawns and tilapia) or catching them from a sea/river (milkfish and crabs), (2) growing-out at the production site, and (3) harvest and transport to auction markets. After-market sales, processing, transport and distribution were not included in the system boundaries since each product has a specific fate: 30% of the shrimp is intended for export, crabs and the non-exported shrimp are sold for local and national consumption, and milkfish and tilapia are sold locally. This system definition does not follow the full cradle-to-grave approach recommended in LCA (Joint Research Centre, 2010) but the cradle-to-gate approach usually used in agricultural environmental studies. Consequently, products’ end-of-life stages are not taken into account, especially waste management and by-product recycling after processing or consumption, which can influence the environmental performance of the product chain. This is a limit of this study, which focusses more on the production step.
To assess nitrogen (N) and phosphorus (P) emissions into water from each pond, a mass balance was calculated as the difference in masses of N and P in harvested products and those of inputs (larvae/fingerlings, fertiliser and feeds) (Cho and Kaushik, 1990). The type of N and P emissions (molecular, dissolved or solid) was not considered. As weeds and sediments (except for pond banks) are not exported, all nutrients not fixed by polyculture species were considered to be released into the environment. This method was adapted to pond systems by including gaseous N emissions (Gross et al., 2000). The approach of Gross et al. (2000) is not fully adapted to our study, as it is based on intensive catfish ponds. Nevertheless, it permits the evaluation of N emissions that do not contribute to eutrophication.
Although they have a huge impact on climate change (characterisation factor of methane is 25 kg CO2-eq.kg
-1
, Forster et al.,2007) methane emissions were not included in our study for two reasons. The first is the high uncertainty of methane emissions depending on the depth of pond sediments, its organic matter content, the level of anoxia and the water temperature (Marty et al., 1990). The second is the origin of the carbon source of methane, which could be either farming activity or the water catchment. Therefore, it is impossible to distinguish the emissions directly due to farming activities from those which naturally occur without farming activity. The use of methane-emission factors stemming from Frei and Becker (2005) obtained in intensive rice-fish culture, as proposed by Phong et al. (2011), would increase the climate change impacts in our study by a factor 10. Considering the questionable relevance of this reference, the lack of reliable data and the high uncertainty of methane emissions, we decided not to include methane emissions. On the other hand, the potential carbon sequestration in pond sediments, as highlighted by Boyd et al. (2010), which could mitigate the effect of methane emissions on climate change, was also not included due to the lack of data.
We chose to use one tonne of fish production sent to auction market as the functional unit. Due to the multiple fish products, it would have been interesting to choose the weight of edible flesh as the functional unit. Nevertheless, this option would require including the end-of-life of the edible product and the fate of the other products and by-products (bones, heads, etc.), which was not possible within the scope of this study. LCAs were performed at the production-site scale (total production) and the species scale (production of each species). For whole-site analysis, we considered that simultaneous production of tiger prawn, mud crabs, milkfish, tilapia and wild species in the polyculture is not divisible among species and that all inputs are associated with the production of the
ACCEPTED MANUSCRIPT
whole system considered as a black box (Fig. 2). Whole-site results equal the mean results of the 15 production sites.
Assessing the environmental impacts of each species in a polyculture faces the issue of opening the black box and defining processes which can be subdivided. Thus, two separate sub-systems were defined: a species-specific sub-system of juvenile production (hatcheries or capture from the wild) and transportation, and a common sub-system, including farm operation and delivery to auction markets, which is still a black box and must be shared among species (Fig. 3). Therefore, calculating the environmental impacts of each species requires defining relevant allocation rules in order to share the impacts associated with the remaining black box. System expansion (to avoid allocation) is not applicable, as the species are not independent (trophic and rearing performance interactions), and it is particularly difficult to find other products which fulfil the same objectives since not all of the species are reared in a monoculture (Ardente and Cellura, 2012). Moreover, the mix of methodologies used in complex agricultural systems makes the use of system expansion inappropriate. Two allocation rules were applied, one based on gross energy contents (Ayer et al., 2007; Pelletier and Tyedmers, 2011) and one based on economic values (Aubin et al., 2009; Aubin et al., 2006; Boissy et al., 2011; Efole-Ewoukem et al., 2012). The former were calculated from the U.S. Department of Agriculture (USDA), Agricultural Research Service database (U.S. Department of Agriculture, Agricultural Research Service, 2012), Mwangamilo and Jiddawi (2003), and FishBase (Froese and Pauly, 2012), while the latter came from surveyed farmers (Table 2). For species-level analysis, impact categories were limited to eutrophication, TCED, climate change, and human labour.
Preliminary data analysis was conducted using a correlation matrix to highlight relations between descriptive parameters and impacts. Afterwards, a Kruskal-Wallis test was used to identify potential differences between groups of production sites. Comparison of environmental impacts among species using the two allocation rules was performed using an asymptotic paired Wilcoxon signed-rank test. Significance was inferred at p<0.05.
3) Results and specific discussion 3.1. Life cycle impact assessment
A table showing the characteristics and results of impact categories farm by farm is available in the supplementary data (Table A1). At the whole-site level, climate change impact is mainly influenced by feeds (35%), harvesting operation (22%) and fertilisers (13%), as is energy use (40%, 23% and 8%, respectively) (Fig. 4). The high contribution of feeds to climate change and energy use can be explained by the high quantities of molluscs fed to tiger prawns (400-5000 kg/ha per cycle). Collecting molluscs with a boat-operated net induces high fuel consumption. The relatively high contribution of tiger prawn larvae production to climate change (8%) is due to the extremely low survival rate of the tiger prawns. Harvesting has a moderate influence on climate change and TCED due to high fuel consumption for pond drainage (15-45 l of diesel per ha). The higher level of the Pampanga River since Mt. Pinatubo’s eruption prevents ponds from draining at low tide.
Farm operation is the main contributor to eutrophication (97%) due to nutrient emissions into the environment and is associated with low input-use efficiency. However, significant differences in eutrophication were observed among ponds depending on their emissions of N and P compounds, which result from the productivity level, use of fertilisers and quantities of feeds provided. Thus, the most productive sites have a negative value for eutrophication, indicating the water-cleaning role of ponds, which recycle nutrients from inlet water. Juvenile tilapia and tiger prawn production contributes little to eutrophication (0.6% and 0.3%, respectively). The low impact of producing tilapia fingerlings may be due to the relatively small size of this sub-component, the low fertilisation rate (urea applied only twice a year) and a high Feed Conversion Ratio (kg of feed distributed per kg of fish produced) of the grow-out stage. Tiger prawn larvae are fed mainly Skeletonema sp. (phytoplankton), which induces low N and P emissions. Moreover, only larvae are fed, as the broodstock is not fed during the few days it is kept for spawning. Acidification impact is mainly influenced by farm operation (67%) due to the use of energy by daily operations and the estimated ammonia emissions from the water. This estimated value has high uncertainty due to the model used.
NPPU (43,444 kg of carbon) is mainly influenced by feeds (95%) due to the use of wild-caught molluscs. Crab larvae collected in rivers and mangroves contribute to 4% of NPPU. These
ACCEPTED MANUSCRIPT
results can help assess the sustainability of supplying molluscs and larval crabs. Growing-out (at the farm stage) is the major contributor to land occupation (99%), as the extensive polyculture system occupies a relatively large area. Nevertheless, this area was modified by people many years ago (mangroves were cleared 50 years ago), and the salty soils cannot be used for agricultural purposes. With regard to human labour, one tonne of products requires 142 working days. The main contributor to human labour is farm operation (51%), making the farm stage the main employer of the production system. Other contributors include feeds (14%), based on two fishermen catching 800 kg of molluscs in four hours; crab larvae (10%), employing one fisherman to catch an average of 100 larvae; and the harvesting stage (8%).
3.2. Testing the homogeneity of environmental impacts within site groups 3.2.1. Effect of production-site size
Farm size is often considered an important factor influencing production efficiency. We specifically investigated it because of an inverse relationship observed by Irz and Stevenson (2012) between size and technical efficiency in a sample of 127 Filipino brackish water polyculture farms. In Irz and Stevenson’s study, the term “farm” is not defined, but we assume that it refers to a group of ponds that depend on the same manager. The two concepts, “farm size” and “production-site size”, are different; nevertheless, the largest farms have the largest ponds (Stevenson et al., 2005; Baruthio, 2006; Heijdova and Morissens, 2006). In our study, the 15 production sites were classified into two groups according to pond size. The threshold was fixed at 15 ha based on classifications of polyculture ponds in Pampanga (Heijdova and Morissens, 2006; Lazard et al., 2007).
Comparison of large and small sites (Fig. 5) reveals no significant differences in impact among the categories, possibly due to the small sample size and high variability. Nevertheless, there is a trend for large sites to have higher eutrophication, acidification, TCED and NPPU impacts, with higher variability. This is not due to a difference in productivity per ha (as both have the same mean land occupation, Table 3) but may be due to the ability to manage production factors (feeds, energy) on such large areas. This assumption is similar to that of Irz and Stevenson (2012), but its validity is limited by the sample size. Managers of large sites generally have long-standing experience in aquaculture and use more traditional practices, especially in the choice of the species seeded (more tilapia and milkfish) than small farmers (Grandmougin, 2003; Stevenson et al., 2005; Irz and Stevenson, 2012). The difference may also be due to innovative practices, such as the progressive use of probiotics (dehydrated microorganisms) by some small farmers. Moreover, usually fewer tiger prawn larvae are stocked in small ponds (mean of 121,000 post-larvae/ha in small sites and 213,000 post-larvae/ha in large sites) and their yield is higher (mean of 243 kg/ha in small sites and 193 kg/ha in large sites). Human labour per tonne of product is higher for small sites and mainly concerns farm operation. This can be explained by the fewer permanent employees needed per ha on large sites (one employee taking care of 6-11 ha), whereas at least one employee is required on a small site regardless of size. However, these hypotheses were based on results from 15 sites and should be confirmed by analysing a larger sample.
3.2.2. Distance from the sea
The straight-line distance of the farm (measured by GPS) from the sea was significantly correlated with acidification (R=-0.57), human labour (R=0.66) and tiger prawn productivity (R=0.57), with high but insignificant correlation with other impacts. Therefore, we classified the production sites into three groups based on their distance from the sea: <10 km (n = 5), 10-20 km (n = 7), and >20 km (n = 3).
The limit of statistical significance was reached only in the differences between the <10 km and >20 km groups for acidification and eutrophication (Fig. 6, supplementary data Tables A2, A3, A4). Results show a trend for impacts to decrease with increasing distance from the sea. This trend seems associated with an increase in productivity per ha (Table 3), as land occupation also tends to decrease with distance. As fishponds are located in an estuary and near sea level, polyculture farms are subject to daily tides. Salinity gradually decreases as distance from the sea increases, determining the aquatic environment and where species are reared (in particular tilapia, which grow mostly in freshwater, and mud crabs, which prefer a saline environment). Salinity influences the presence of disease, specifically white-spot disease, which usually spreads when salinity exceeds 15 ppm and
ACCEPTED MANUSCRIPT
causes tiger prawn mortality. The greater the water salinity, the more tiger prawn larvae are stocked, which induces an indirect increase in impacts associated with larvae production. Additionally, tilapia production is correlated with system productivity per ha (R=0.76). As this species is more adapted to freshwater, the difference in environmental impacts between high- and low-salinity polycultures increases even further.
3.3. Environmental impacts of each species in the polyculture system according to allocation rules At the species level, economic allocation induces greater differences between species for each impact category than energy-based allocation (Fig. 7). Moreover, species ranks differ among impact categories. Milkfish tend to have the highest mean impacts with energy-based allocation, while tiger prawn and mud crabs tend to have the highest mean impacts with economic allocation. Tilapia tends to have the lowest impacts regardless of allocation rule.
With energy-based allocation, environmental impacts of the species are significantly different, except between tilapia and wild species (for all impacts), tiger prawn and mud crabs (for climate change, human labour and TCED), tiger prawn and tilapia (for human labour and TCED), and tiger prawn and wild species(for human labour). With economic allocation, environmental impacts of the species are significantly different, except between mud crabs and tiger prawn (for all impacts) and milkfish and wild species (for eutrophication, human labour and TCED).
Thus, different allocation rules can cause impact estimates of species to differ. Nevertheless, mud crabs and tiger prawn have similar impacts in each category regardless of allocation rule (except for eutrophication). Also, regardless of allocation rule and the impact categories selected here, milkfish always differs from mud crabs, tiger prawn, tilapia and wild species; mud crabs always differ from milkfish, tilapia and wild species; tiger prawn always differs from wild species; and tilapia always differs from milkfish and mud crabs. Nevertheless, these differences are not in the same direction regarding the allocation rules, which changes the order of species when they are ranked by the magnitude of their impacts.
3.4. Comparison with environmental impacts in other studies
The environmental impacts of Pampanga polyculture systems were compared to those in previous studies of aquaculture production on the basis of one tonne of fish at the farm gate. For this purpose, TCED, climate change and eutrophication impacts of either all aquatic products (no allocation) or separated tilapia and tiger prawn (with both energy-based and economic allocations) from our study were compared to impacts estimated for intensive tilapia culture in ponds in Indonesia (Pelletier and Tyedmers, 2010), traditional tilapia and Clarias gariepinus polyculture in Cameroon (Efole-Ewoukem et al., 2012), intensive tiger prawn monoculture in Thailand (Mungkung et al., 2006), and flow-through intensive trout (Oncorhynchus mykiss) culture in France (Aubin et al., 2009). Differences in LCA methodology application and flesh yields of the species may limit the comparability of results. Nevertheless, the order of the magnitude of impacts can be discussed.
TCED, climate change and eutrophication impacts in Pampanga are within the same range as those in other studies of aquatic products (Fig. 8). In most cases the averages of impacts from the literature are within the Pampanga farm variability for the same species. Per tonne, mean TCED and climate change impacts are similar for tilapia in the intensive Indonesian case study (26,500 MJ, 2,100 kg CO2-eq.), tilapia in Pampanga with energy-based allocation (23,000 MJ, 1,600 kg CO2-eq.) and
total production in Pampanga (30,000 MJ, 2,200 kg CO2-eq). Tilapia from Pampanga with economic
allocation have a lower mean TCED (5,700 MJ), similar to that of family ponds in Cameroon (2,500 MJ), and the lowest mean climate change (400kg CO2-eq.) and eutrophication (17 kg PO4-eq.)
impacts.
Mean TCED and climate change impacts for one tonne of tiger prawn are similar for Thai intensive tiger prawn (45,600 MJ, 3,100 kg CO2-eq.) and Pampanga tiger prawn with economic
allocation (49,200 MJ, 3,600 kg CO2-eq.). These levels are the highest for climate change but below
that for intensive trout for TCED (78,200 MJ). Eutrophication is relatively high for Pampanga prawn with economic allocation (158kg PO4-eq.), higher than that for Thai intensive tiger prawn (64kg PO4
-eq), but lower than in the Cameroonian case study (292 kg PO4-eq.). Pampanga tiger prawn with
energy-based allocation have lower impacts in the three impact categories (30,300 MJ, 2,300kg CO2
ACCEPTED MANUSCRIPT
4) General discussion4.1Variability and uncertainty
All estimated impacts in this study have high variability, which reflects the variability in farmers’ practices, as the species mix differs among ponds. We observed trends in impacts due to pond size, but farm size alone cannot explain the observed variability. Moreover, we cannot declare that yields vary as a function of site size, as observed previously (Irz and Stevenson, 2012). Nevertheless, the increasing variability with site size suggests a decrease in control over production due to the challenges and risks of larger ponds. The trend of decreasing labour per tonne of fish with increasing site size produced reinforces this hypothesis.
Pond distance from the sea seems to influence impacts, with a trend of higher impacts for production sites closer to the sea. In this case, yields seem to play a role, as land occupation increases with proximity to the sea, indicating a decrease in production per ha. Proximity to the sea directly influences pond water salinity and may influence tiger prawn mortality (susceptibility to viral diseases) and the species assemblage, as tilapia do not tolerate high salinity. These two factors seem to influence the yield and, indirectly, the environmental impacts. These results show the large variability in environmental impacts of extensive systems and the utility of combining LCA and geo-located studies to better understand the environmental context, the differentiation of practices and the environmental impacts of agricultural production systems.
Another source of variability in our results may be uncertainty in the collected data. As pointed out by others (Efole-Ewoukem et al., 2012; Henriksson et al., 2012), traditional farming systems are poorly documented, and life cycle inventory is particularly difficult to conduct, as it is based mainly on farmers’ knowledge and estimates. Consequently, data quality may differ according to who is interviewed. Considering the high variability observed in our study, the number of production sites surveyed (15) is not sufficient to minimise variability around estimated means. The number of seafood-oriented LCA studies that estimate variability in their results is too small to compare the level of variability that we observed in impacts. Nevertheless, we expect that the heterogeneity of local environments and diversity of practices in large production systems (vast ponds), based partly on wild-caught feed, may induce higher variability in environmental impacts than fish farming in tanks or pens with standard water quality and externally formulated feeds. We did not include the uncertainty due to primary data collection and secondary data, as proposed by Henriksson et al. (2013) and the Joint Research Centre (2010), but only the variability of the performances of the production sites. A deeper analysis of uncertainty would be an interesting issue for environmental assessment of this kind of production system (Henriksson et al., 2012); nevertheless, it remains a methodological challenge, especially in tropical countries.
4.2 Allocation issues.
Environmental assessment of this system faces the challenge of distributing the environmental burden among its interrelated species, and different positions can be adopted. Three approaches were used in our study. The first is to consider the polyculture system as a whole, wherein there is no reason to differentiate the species, as they are interdependent and the productivity of one is determined by the presence and productivity of others. In this case, a mass-allocation rule can be used so that each species has the same impact per unit mass. This solution is the most robust and most adapted to homogeneous groups of species in a polyculture. Nevertheless, it seems less adapted to a more heterogeneous system including plants or molluscs, such as Integrated Multi Trophic Aquaculture (Troell et al., 2009), and where species do not have the same status (trophic level, role, cultural or culinary interest) or economic value.
The second approach, energy-based allocation, is more mechanistic and biological, as it is based on the gross energy that every species captures and assimilates. This position is supported by several authors (Tyedmers and Pelletier, 2006; Ayer et al., 2007; Pelletier and Tyedmers, 2008; Pelletier and Tyedmers, 2011) and seems relevant for polycultures when it can help explain the sharing of energy available among species in the production system. Nevertheless, this approach is insufficient for explaining the functional relationship between species, as their trophic levels are not
ACCEPTED MANUSCRIPT
considered. Moreover, the same limits as for mass allocation appear when the value of the system’s species (co-products) is too different.
The third approach is economic allocation. This position better reflects the causality of the production process (Ardente and Cellura, 2012). This rule assumes that the production system is designed to maximise profits by favouring the most valuable species; thus, it allocates environmental burden according to the total values of co-products. This approach is severely criticised (Pelletier and Tyedmers, 2011), arguing that current economic values and other market signals do not reflect the environmental dimension of economic activities and that economic values rapidly change according to the market, inducing unstable allocation rules. Nevertheless, this approach is regularly used in seafood LCA (Aubin, 2013; Aubin et al., 2009; Boissy et al., 2011; Jerbi et al., 2012), continuing the debate (Pelletier and Tyedmers, 2012).
In this study, use of economic allocation induces greater differences in impacts among species due to the large difference in market value per kg, as reported by others (Ayer et al., 2007). With energy-based allocation, milkfish has higher impacts as it is a fatty fish which stores a large quantity of gross energy in adipose tissues (Table 2) despite having a lower trophic level (2.0) than tiger prawn (2.6). Conversely, in economic allocation, tiger prawn and mud crabs have the highest environmental impacts due to their relatively high market price.
Tiger prawn, mud crabs and milkfish do not have the same purpose in the production system. In the 1980s in Pampanga, the traditional polyculture system was converted into tiger prawn monoculture due to tiger prawn’s high market price. At the beginning of the 1990s, diseases and economic crisis pushed farmers to return their production system to polyculture but keep tiger prawn as the target product; mud crabs and tiger prawn still had high market value (FAO, 2005). Additionally, milkfish and tilapia are considered water-cleaning species, limiting disease proliferation and ensuring a stable but limited income. Moreover, tiger prawn and crabs are sold mainly for export outside the province for their flavour and festive qualities, while milkfish and tilapia are sold mainly on the local market to support local populations highly dependent on fish. These arguments tend to favour economic allocation, which seems more logical given that different species are produced because they have different intrinsic (and not necessarily energy-based) qualities and values (Ardente and Cellura, 2012; Weinzettel, 2012). The use of economic allocation renders the environmental impacts of Pampanga tilapia similar to those of tilapia from Cameroonian polyculture, and those of Pampanga tiger prawn similar to those of intensive Thai tiger prawns. Economic allocation is relevant for co-optimising economic and environmental performances but probably not for optimising biophysical performance.
4.2 Other environmental impacts
LCA methodology provides a single-year estimate of the environmental impacts of a given production system by considering all inputs and outputs from all production stages. Considering the application of LCA to an extensive system, one remaining issue is which functional unit is the most suitable (e.g., product mass or area occupied). One advantage of the method, however, is its high flexibility depending on the goal and scope of the study.
Calculation of impacts and contribution analysis based on the 15 production sites showed that the system components that contribute most are farm operation, feeds and harvest. The main impact related to feeds is NPPU because of high mollusc consumption. Little information is available about stocks of the two main species concerned (horn snails and mangrove whelk). According to the farmers interviewed, no decrease in snail supply was observed in the past few years; however, a few believe it will happen in the future, particularly because the local resource of mangrove whelk is no longer sufficient. This issue has become a concern of Local Government Units. Among improvements that can be made in studying these systems, one is to consider degradation of aquatic ecosystems caused by mollusc collection for pond feeding, as trawling erodes the benthos and destroys natural habitats. This impact was estimated for trawling in fisheries (Ziegler et al., 2003; Nilsson and Ziegler, 2007) and could be adapted to the Pampanga context.
Alternatives to using molluscs as feed in polycultures could be explored, but concentrated feeds cannot be considered because of their high cost and because species may compete for them. The failure of past experiences in using concentrated feeds in semi-intensive (and intensive) tiger prawn culture shows their unsuitability for polyculture. Alternatives must be considered, such as the use of
ACCEPTED MANUSCRIPT
trash fish as a supplemental feed in appropriate conditions or by-products from terrestrial agricultural activities (which unfortunately tend to be far from ponds).
Aside from the main contributors highlighted by LCA results, lesser contributors with specific environmental issues must be mentioned, such as the capture of tiger prawn broodstock, milkfish fingerlings and juvenile crabs in the wild. Tiger prawn broodstock has significantly decreased in several regions, particularly the Visayas Islands, and the supply of broodstock remains one of the main issues for tiger prawn hatcheries. No studies have been performed, however, to estimate the size of the broodstock in the natural environment. As for milkfish fingerlings, milkfish hatcheries are being developed in the Philippines, as milkfish production is expected to increase in the near future (BFAR et al., 2005). However, 50% of the fingerling supply is still wild-caught. Ideally, a balance must be found between wild capture, a source of income for local fishermen, and monitored reproduction in hatcheries, which protects natural resources. As a continuation of the present study, comparison of the impacts of catching vs. reproducing milkfish would be interesting to add to further studies on the state of natural resources. Another issue for consideration is interactions between capture and culture fisheries, as cultivated broodstock and its offspring must not decrease genetic variability in wild populations. As for juvenile crabs caught in mangroves, the development of crab hatcheries, still in the experimental stage, has been long-awaited. Another target is to increase mud crab stocks in mangroves (Sorgeloos, 2002). Unfortunately, the inclusion of consequences of human activities on biodiversity in the LCA framework remains a challenge, especially when applied to aquatic systems (Aubin, 2013).
Although our study focuses on environmental impacts, a more complete assessment of sustainability would be important to better understand economic and social challenges associated with this polyculture system in the Philippines and help to define governance objectives. For instance, the role of this polyculture in sustaining the local population economically has been investigated, showing a benefit for poor people (Irz et al., 2007). In our study, human labour is considered more an input to the production system. The number of workdays does not consider the quality of, qualification for or difficulty of the work. It is not a social impact category, as considered in UNEP/SETAC Guidelines for Social Life Cycle Assessment of Products (UNEP, 2009). Nevertheless, this indicator reports the amount of work and, indirectly, the number of people involved in the production of one functional unit. Therefore, it reflects the activity’s importance to the economy and community of a territory. For instance, one tonne of fish from Pampanga polyculture requires on-site human labour of 74 man.day (52% of total human labour), compared to on-site labour of 13 man.day for trout farming in France (unpublished data), an intensive system poorly integrated with the community of the territory it occupies (Lazard et al., 2010). To better understand the direct and indirect influence of the activity on the value chain, it is necessary to complement attributional LCA with other methods, such as the Porter Value Chain or Life Cycle Costing (Aubin et al., 2013).
4.2 Degree of intensification
Naylor et al. (2000) define aquaculture as interventions in fish life cycles ranging from exclusion of predators and control of competitors (extensive aquaculture) to enhancement of food supply (semi-intensive) to the provision of all nutritional requirements (intensive). Additionally, intensification implies increasing the density of individuals, which requires greater use and management of inputs, greater generation of waste products and increased potential for the spread of pathogens. In our study, comparison of mean values for key environmental impacts did not differentiate “intensive” systems (i.e., trout farming, Thai tiger prawn production, Indonesian tilapia production) from “extensive” systems such as Pampanga polyculture (total production). In contrast, tilapia production in polyculture using economic allocation tends to have lower impact than the other environmental profiles. On the basis of our results and those published in other studies (Fig. 8), differences between intensive and extensive systems seem to depend more on the sources of inputs (mainly feed components and energy carriers) and their transformation efficiencies within the production system. The determination of environmental impacts is then due more to system efficiency than to system intensiveness. This observation is consistent with the results of Cao et al., (2011) and Cao et al., (2013) who compared intensive and semi intensive white leg shrimp culture in China, and with the results of Wilfart et al. (2012?), who used a combination of LCA and Emergy to demonstrate that it is the efficiency of natural and technologic means which differentiate extensive and intensive aquatic production systems. In polyculture pond systems, the low degree of intensification is
ACCEPTED MANUSCRIPT
compensated by the low environmental cost of the ecological processes that sustain productivity. When calculated per unit mass, the environmental impacts of semi-extensive aquaculture systems cannot be considered as always lower than those of intensive systems. It would not be the same, however, if one calculates impacts using surface area as the functional unit. In this case, the less intensive systems have a better environmental profile.
In aquaculture, a polyculture is generally based on complementarities of the levels in the food chain, behaviours and habitats of its aquatic species (Milstein, 2005). In our study, this complementarity was extended to different markets. The advantages of a polyculture system are based on the better use of nutritive resources and consequently a decrease in losses, which are potential pollutants. The mixture of species induces a better resistance to diseases. This is one of the reasons Pampanga farmers have abandoned tiger prawn monoculture in favour of fish polyculture (white-spot disease breakdown). Globally, polyculture is a more robust and resilient system than monoculture, since its complexity induces better stability. This robustness is valid in the economic sphere, as polyculture is able to transform low-quality nutritive resources less exposed to market-price changes and to produce different products for different markets. Although LCA can estimate the environmental performance of such a system, and indirectly show its efficiency in transforming inputs, it is less able to describe a system’s robustness or resilience in biophysical and economic spheres. Thus, LCA must be complemented by other types of studies.
5. Conclusion
Brackish water polyculture in Pampanga has existed for more than 300 years. It was developed in mangrove areas and extended until the 1970s (Primavera, 1995). Mangrove destruction is now irreversible in that area, and pond conversion for mangrove rehabilitation is no longer considered. A particularity of the current polyculture system is that it derives from a traditional system. It must be maintained and developed, as it combines the provision of a local supply of protein from fish with the production of high-value products intended to support the national economy. Nevertheless, the high variability in impacts estimated by LCA indicates that room exists for improving systems by adapting existing practices. Differences in environmental impacts as a function of production-site distance from the sea suggest that polyculture practices (e.g., species assembly, water renewal) must be adapted according to salinity. The high dependence of the farming system on natural resources, especially for nutrition sources (snails) and fish seed (mud crab and milkfish juveniles) puts system sustainability and related ecosystems at high risk.
The impacts of producing the different species in this polyculture system do not greatly differ from those of intensive monoculture of the same species. More research is needed to increase its productivity while preserving natural resources in a context of increasing demand for aquatic products. LCA succeeded in globally estimating certain environmental impacts of this production system. Nevertheless, the methodology must continue to develop to improve assessment of impacts on biodiversity and to reach consensus on key concerns such as allocation. Some key issues about pond systems, such as carbon sequestration in pond sediments and methane emissions, which can have a great impact on climate change, must be better documented before being implemented in LCA studies. More case studies are required to better evaluate these aquatic production systems, especially in Asia, where they play major roles in human nutrition and the economy.
Acknowledgements
The authors wish to thank Marita Ocampo, Romy Alberto, staff of the Philippine Bureau of Fisheries and Aquatic Resources (BFAR), Pierre Morissens and the 15 farmers who agreed to join the study for providing the data necessary to conduct this analysis. The present study is part of the EVAD project: Evaluation of sustainability in aquaculture (ANR-05-PADD-0008) conducted by the French organisations CIRAD, INRA, IRD, and the University of Montpellier 2 that aimed to develop a methodology to measure the sustainability of aquaculture systems. It is funded by National Research Agency.
ACCEPTED MANUSCRIPT
Ardente, F., Cellura, M., 2012. Economic allocation in life cycle assessment. Journal of Industrial Ecology 16, 387-398.
Aubin, J., 2013. Life cycle analysis as applied to environmental choices regarding farmed or
wildcaught fish. CAB Reviews: Perspectives in Agriculture, Veterinary Science, Nutrition and Natural Resources. 8 (11).
Aubin, J., Donnars, C., Supkova, M., Dorin, B., 2013. A critical panorama of methods used to assess food sustainability. In: Esnouf, C., Russel, M., Bricas, N. (Eds.), Food system sustainability: Insights from duALIne. Cambridge University Press, New York, pp. 198 - 232.
Aubin, J., Papatryphon, E., van der Werf, H.M.G., Chatzifotis, S., 2009. Assessment of the
environmental impact of carnivorous finfish production systems using life cycle assessment. J. Clean Prod. 17, 354-361.
Aubin, J., Papatryphon, E., Van der Werf, H.M.G., Petit, J., Morvan, Y.M., 2006. Characterisation of the environmental impact of a turbot (Scophthalmus maximus) re-circulating production system using life cycle assessment. Aquaculture 261, 1259-1268.
Ayer, N.W., Tyedmers, P.H., Pelletier, N.L., Sonesson, U., Scholz, A., 2007. Co-product allocation in life cycle assessments of seafood production systems: Review of problems and strategies. Int. J. Life Cycle Assess. 12, 480-487.
Bagarinao, T., Lantin-Olaguer, I., 2000. From triphenyltins to integrated management of the `pest' snail Cerithidea cingulata in mangrove-derived milkfish ponds in the Philippines.
Hydrobiologia 437, 1-16.
Baruthio, A., 2006. La durabilité de l’aquaculture: quelles représentations? Analyse des exploitations et de la perception des acteurs de la filière de polyculture extensive dans la province de Pampanga aux Philippines, mémoire d’ingénieur, ENSAT, pp. 31.
Boissy, J., Aubin, J., Drissi, A., van der Werf, H.M.G., Bell, G.J., Kaushik, S.J., 2011. Environmental impacts of plant-based salmonid diets at feed and farm scales. Aquaculture 321, 61-70. Bosma, R., Pham Thi, A., Potting, J., 2011. Life cycle assessment of intensive striped catfish farming
in the Mekong Delta for screening hotspots as input to environmental policy and research agenda. Int. J. Life Cycle Assess. 16, 903-915.
Boyd, C.E., Wood, C.W., Chaney, P.L., Queiroz, J.F., 2010. Role of aquaculture pond sediments in sequestration of annual global carbon emissions. Environmental Pollution. 158, 2537-2540
.
BFAR (Bureau of Fisheries and Aquatic Resources), the WorldFish Center, SEAFDEC, UPV, 2005. Dissemination and adoption of milkfish aquaculture technology in the Philippines. First annual report, pp. 3-4.
BFAR (Bureau of Fisheries and Aquatic Resources), 2004. Philippine fisheries profile, 2004. Department of Agriculture, Republic of the Philippines, 24 p..
Cao, L., Diana, J.S., Keoleian, G.A., Lai, Q., 2011. Life Cycle Assessment of Chinese Shrimp Farming Systems Targeted for Export and Domestic Sales. Environmental Science & Technology 45, 6531-6538.
Cao, L., Diana, J.S., Keoleian, G.A., 2013. Role of life cycle assessment in sustainable aquaculture. Reviews in Aquaculture 5, 61-71.
Casaca, J.M., 2008. Policultivos de peixes integrados à produção vegetal: avaliação econômica e sócio ambiental (peixe-verde). Tese de doutorado de Aqüicultura da UNESP Brazilia, 160 pp. Cho, C.Y., Kaushik, S.J., 1990. Nutritional energetic in fish: energy and protein utilization in rainbow
trout (Salmo gairdneri). World Rev. Nutr. Diet 61, 132-171.
d'Orbcastel, E.R., Blancheton, J.-P., Aubin, J., 2009. Towards environmentally sustainable aquaculture: Comparison between two trout farming systems using life cycle assessment. Aquacultural Engineering 40, 113-119.
Efole-Ewoukem, T., Aubin, J., Mikolasek, O., Corson, M.S., Tomedi Eyango, M., Tchoumboue, J., van der Werf, H.M.G., Ombredane, D., 2012. Environmental impacts of farms integrating aquaculture and agriculture in Cameroon. J. Clean Prod. 28, 208-214.
FAO, 2012. The state of world Fisheries and aquaculture 2012. Food and Agriculture Organisation of United Nations, Rome, pp. 230.
ACCEPTED MANUSCRIPT
FAO, 2005. National Aquaculture Sector Overview. Philippines. National Aquaculture Sector
Overview Fact Sheets. In: FAO Fisheries and Aquaculture Department [on line]. Rome. MAJ 1 February 2005.
Forster, P., Ramaswamy, V., Artaxo, P., Berntsen, T., Betts, R., Fahey, D.W., Haywood, J., Lean, J., Lowe, D.C., Myhre, G., Nganga, J., Prinn, R., Raga, G., Schulz ,M., Van Dorland, R., 2007. Changes in Atmospheric Constituents and in Radiative Forcing. In Solomon, S., Qin, D., Manning, M., Chen, Z., Marquis, M., Averyt, K.B., Tignor, M., Miller, H.L. (Eds.) Climate Change 2007: The Physical Science Basis. Contribution of Working Group I to the Fourth Assessment Report of the Intergovernmental Panel on Climate Change. Cambridge University Press, Cambridge, United Kingdom and New York, NY, USA.
Frei, M., Becker, K., 2005. Integrated rice-fish production and methane emission under greenhouse conditions. Agriculture Ecosystems & Environment 107, 51-56.
Froese, R. and D. Pauly. Editors. 2012. FishBase. http://www.fishbase.org, version (12/2012). Frischknecht, R. Jungbluth, N., Althaus, H.J., Doka, G., Dones, R., Hirschier, R., Hellweg, S.,
Humbert, S., Margni, M., Nemecek, T. and Speilmann, M. 2004. Implementation of Life Cycle Impact Assessment Methods (version 1.1). Eco-Invent Report No. 3. Swiss Centre for Life Cycle Inventories, Dübendorf, 2004. 116 pp.
Grandmougin, B., 2003. Adaptabilité de deux systèmes piscicoles de la province de Pampanga (Philippines) aux évolutions récentes des facteurs de production, mémoire d’ingénieur, INA-PG, p.10.
Gross, A., Boyd, C.E., Wood, C.W., 2000. Nitrogen transformation and balance in channel catfish pond. Aqua. Eng. 24,1-14.
Guinée, J.B., Gorrée, M., Heijungs, R., Huppes, G., Kleijn, R., de Koning, A., van Oers, L., Wegener Sleeswijk, A., Suh, S., Udo de Haes, H.A., de Bruijn, H., van Duin, R., Huijbregts, M.A.J., 2002. Handbook on Life Cycle Assessment. An Operational Guide to the ISO standards. Kluwer Academic Publishers, Dordrecht, The Netherlands, 692 pp.
Heijdova, E., Morissens, P., 2006, La polyculture en étangs côtiers saumâtres de la province de Pampanga (Philippines), document CIRAD, pp.2-9.
Henriksson, P.J.G., Guinee, J.B., Kleijn, R., de Snoo, G.R., 2012. Life cycle assessment of aquaculture systems-a review of methodologies. Int. J. Life Cycle Assess. 17, 304-313.
Henriksson, P.J.G., Guinée, J.B., Heijungs, R., Koning, A., Green, D.M., 2013. A protocol for horizontal averaging of unit process data – including estimates for uncertainty. The International Journal of Life Cycle Assessment. In press.
Irz, X., Stevenson, J.R., 2012. Efficiency and farm size in Philippine aquaculture. Analysisin a ray production frontier framework. Bio-based and Applied Economics 1, 175-198.
Irz, X., Stevenson, J.R., Tanoy, A., Villarante, P., Morissens, P., 2007. The equity and poverty impacts of aquaculture: Insights from the Philippines. Development Policy Review 25, 495-516. ISO (The International Organization for Standardisation), 2006a. Environmental Management – Life
cycle assessment – Principles and framework. ISO 14040, ISO, Geneva. 32 pp.
ISO (The International Organization for Standardisation), 2006b. Environmental Management – Life cycle assessment – Requirements and guidelines. ISO 14044, ISO, Geneva. 58 pp.
Jerbi, M.A., Aubin, J., Garnaoui, K., Achour, L., Kacem, A., 2012. Life cycle assessment (LCA) of two rearing techniques of sea bass (Dicentrarchus labrax). Aquacultural Engineering 46, 1-9. Joint Research Centre, 2010. International Reference Life Cycle Data System (ILCD) Handbook -
General guide for Life Cycle Assessment - Detailed guidance. First edition March 2010. EUR 24708 EN. Publications Office of the European Union. Luxembourg. 417 p.
Lazard, J., Baruthio, A., Mathe, S., Rey-Valette, H., Chia, E., Clement, O., Aubin, J., Morissens, P., Mikolasek, O., Legendre, M., Levang, P., Blancheton, J.-P., Rene, F., 2010. Aquaculture system diversity and sustainable development: fish farms and their representation. Aquatic Living Resources 23, 187-198.
Lazard, J., Rey-Valette, H., Chia, E., Clement, O., Aubin, J., Mathe, S., Morissens, P., Mikolasek, O., Legendre, M., Levang, P., Blancheton, J.-P., Rene, F., et al., 2007. EVAD -Evaluation de la durabilité des systèmes de production aquacoles-, Rapport scientifique à mi-parcours, Agence Nationale de Recherche, Agriculture et Développent Durable, pp.24-25.
ACCEPTED MANUSCRIPT
Marty, D., Esnault, G., Caumette, P., Ranaivosonrambeloarisoa, E., Bertrand, J.C., 1990.Denitrification, sulphate reduction and methanogenesis in the upper sediments of a Mediterranean coastal lagoon. Oceanologica Acta 13, 199-210.
Milstein, A., 2005. Polyculture in aquaculture, Animal Breeding Abstracts. CABI Publishing, pp. 15N - 41N.
Mungkung, R., 2005. Shrimp Aquaculture in Thailand: Application of Life Cycle Assessment to support sustainable development. Ph.D. Dissertation. Centre for Environmental Strategy (CES), School of Engineering, University of Surrey, UK, pp., 299.
Mungkung, R.T., de Haes, H.A.U., Clift, R., 2006. Potentials and limitations of life cycle assessment in setting ecolabelling criteria: A case study of Thai shrimp aquaculture product. Int. J. Life Cycle Assess. 11, 55-59.
Mwangamilo, J, Jiddawi, N.S 2003. Nutritional studies and development of a practical feed for milkfish (Chanos chanos) in Zanzibar, Tanzania. Western Indian Ocean J. Mar. Sci. 2,137-146.
Naylor, R.L., Goldburg, R.J., Primavera, J.H., Kautsky, N., Beveridge, M.C.M., Clay, J., Folke, C., Lubchenco, J., Mooney, H., Troell, M., 2000. Effect of aquaculture on world fish supplies. Nature 405, 1017-1024.
Nilsson, P., Ziegler, F., 2007. Spatial distribution of fishing effort in relation to seafloor habitats in the Kattegat, a GIS analysis. Aquatic Conservation: Marine and Freshwater Ecosystems 17, 421-440.
Papatryphon, E., Petit, J., Van der Werf, H.M.G., 2004a. The development of life cycle assessment for the evaluation of rainbow trout farming in France. Proceedings of the 4th International
Conference on: Life Cycle Assessment in the Agri-feed sector. 6-8 October 2003, Horsens, Denmark, pp. 73-80.
Papatryphon, E., Petit, J., Kaushik, S.J., Van derWerf, H.M.G., 2004b. Environmental impact assessment of salmonids feeds using life cycle assessment. Ambio 33, 316-323.
Pauly, D., Christensen, V., 1995. Primary production required to sustain global fisheries. Nature 374, 255-257.
Pelletier, N., Tyedmers, P., 2012. Response to Weinzettel. Journal of Industrial Ecology 16, 456-458. Pelletier, N., Tyedmers, P., 2007. Feeding farmed salmon: Is organic better? Aquaculture 272,
399-416.
Pelletier, N.L., Ayer, N.W., Tyedmers, P.H., Kruse, S.A., Flysjo, A., Robillard, G., Ziegler, F., Scholz, A.J., Sonesson, U., 2007. Impact categories for life cycle assessment research of seafood production systems: Review and prospectus. Int. J. Life Cycle Assess. 12, 414-421.
Pelletier, N., Tyedmers, P., 2008. Life cycle considerations for improving sustainability assessments in seafood awareness campaigns. Environ. Manage. 42, 918-931.
Pelletier, N., Tyedmers, P., 2010. Life cycle assessment of frozen tilapia fillets from Indonesian lake-based and pond-lake-based intensive aquaculture systems. Journal of Industrial Ecology 14, 467-481.
Pelletier, N., Tyedmers, P., 2011. An ecological economic critique of the use of market information in life cycle assessment research. Journal of Industrial Ecology 15, 342-354.
Phong, L.T., de Boer, I.J.M., Udo, H.M.J., 2011. Life cycle assessment of food production in integrated agriculture-aquaculture systems of the Mekong Delta. Livestock Science 139, 80-90.
Primavera, J.H., 1995. Mangroves and brackishwater pond culture in the Philippines, Hydrobiologia, 295, 303-309.
Samuel-Fitwi, B., Wuertz, S., Schroeder, J.P., Schulz, C., 2012. Sustainability assessment tools to support aquaculture development. Journal of Cleaner Production 32, 183-192.
Sharma, D., Madamba, S.E., Chan, M.R.L., 2004. Electricity industry reforms in the Philippines. Energy Policy 32, 1487-1497.
Sorgeloos, P., et al., 2002. Sustainable production of mud crab Scylla sp. through stock enhancement in mangroves, 4th Framework Programme, Joint Research Project, Gent University, 1998-2002.
Stevenson, J. R., Irz, X. T., Alcalde, R-G., Petit, J. and Morissens, P., 2005. Working paper 1 - A typology of brackish-water aquaculture systems in the Philippines. Research project R8288:
ACCEPTED MANUSCRIPT
Assessing the sustainability of brackish-water aquaculture systems in the Philippines, DFID Aquaculture and Fish Genetics Research Programme, University of Stirling, UK.
Swiss Center for Life Cycle Inventories, 2010. Ecoinvent v2 Database. Ecoinvent Center 2010, Online: http://www.ecoinvent.ch/.
Troell, M., Joyce, A., Chopin, T., Neori, A., Buschmann, A.H., Fang, J.G., 2009. Ecological engineering in aquaculture - Potential for integrated multi-trophic aquaculture (IMTA) in marine offshore systems. Aquaculture 297, 1-9.
Tyedmers, P., Pelletier, N., 2006. Biophysical accounting in aquaculture: insights from current practice and the need for methodological development. In: Bartley, D.M., Brugère, C., Soto, D., Gerber, P., Harvey, B. (Eds.), Comparative assessment of the environmental costs of aquaculture and other food production sectors. Methods for meaningful comparisons, FAO/WFT Expert Workshop. FAO, Rome (Italy), Vancouver (Canada).
UNEP, 2009. Guidelines for Social Life Cycle Assessment of Products, UNEP, SETAC, Paris, pp. 103.
U.S. Department of Agriculture, Agricultural Research Service. 2012. USDA National
Nutrient Database for Standard Reference, Release 25. Nutrient Data Laboratory HomePage, http://www.ars.usda.gov/ba/bhnrc/ndl
Ziegler, F., Nilsson, P., Mattsson, B., Walther, Y., 2003. Life cycle assessment of frozen cod fillets including fishery-specific environmental impacts. Int. J. Life Cycle Assess. 8, 39-47.
Weinzettel, J., 2012. Understanding who is responsible for pollution: What only the market can tell us - Comment on “An ecological economic critique of the use of market information in life cycle assessment research”. Journal of Industrial Ecology 16, 455-456.Wilfart, A., Prudomme, J., Blancheton, J.P., Aubin, J., 2013. LCA and emergy accounting of aquaculture systems: Towards ecological intensification. Journal of Environmental Management 121, 96-109.
ACCEPTED MANUSCRIPT
Figure captions
Figure 1: Production cycle of the brackish water polyculture system of Pampanga, Philippines
Figure 2: Definition of the Pampanga brackish water polyculture system used for
environmental assessment of whole-site production.
Figure 3: Definition of the Pampanga brackish water polyculture system used for
environmental assessment of species-specific production.
Figure 4: Impacts (+1 standard deviation) and contribution analysis for 1 tonne of polyculture
products in the Pampanga brackish water system.
Figure 5: By impact category, relative impacts for 1 tonne of aquatic products in the
Pampanga area as a function of production site size: small (<15 ha, n = 8) vs. large (16-91 ha,
n = 7). The highest value per category has a value of 100. Error bars represent 1 standard
deviation.
Figure 6: By impact category, relative impacts per 1 tonne of aquatic products from
Pampanga as a function of production site distance from the sea: <10 km (n = 5), 10-20 km (n
= 7), >20 km (n = 3). The highest value per category has a value of 100. Error bars represent 1
standard deviation.
Figure 7: Mean eutrophication, climate change, total cumulative energy demand (TCED), and
human labour impacts of 1 tonne of each species in the Pampanga brackish water polyculture
system using either energy-based or economic allocation of the farm-operation stage. Error
bars represent 1 standard deviation.
Figure 8: Relative energy use, climate change and eutrophication impacts of 1 tonne of tiger
prawn, tilapia (according to energy-based and economic allocation) and total production of
the Pampanga polyculture system compared to 1 tonne of tilapia, tiger prawn and trout in
previous studies, allocated between energy-based or economic allocation. “All species
Pampanga” is presented as a reference in both groups. Error bars represent 1 standard
deviation.
ACCEPTED MANUSCRIPT
Transferring undersized species to another grow-out pond
Local auction market Main auction market
Buyers from processing plants Buyers from local fish markets Harvesting prawn after 3-4 months
(with large crabs, milkfish and tilapia)
Harvesting crabs after 6 months (with large milkfish and Tilapia) Re-stocking prawn post-larvae and fish
fingerlings
Pond preparation
Stocking prawn, crabs (after 2 weeks) , tilapia (after a day) and milkfish (after a day)
Harvesting prawn after 3-4 months, and large tilapia and milkfish
Re-stocking of crabs’ fry
ACCEPTED MANUSCRIPT
Figure 2
Prawn post-larvae Tilapia juveniles Milkfish juveniles Mud crab juvenilesHatcheries Natural catch
T
T
T
T
Tiger
Prawn Tilapia Milkfish
Mud
crabs Wild fish
Transport to auction markets