HAL Id: hal-01411076
https://hal.parisnanterre.fr//hal-01411076
Submitted on 16 Apr 2021HAL is a multi-disciplinary open access archive for the deposit and dissemination of sci-entific research documents, whether they are pub-lished or not. The documents may come from teaching and research institutions in France or abroad, or from public or private research centers.
L’archive ouverte pluridisciplinaire HAL, est destinée au dépôt et à la diffusion de documents scientifiques de niveau recherche, publiés ou non, émanant des établissements d’enseignement et de recherche français ou étrangers, des laboratoires publics ou privés.
Confinement effects on the steel–concrete bond strength
and pull-out failure
Anaëlle Torre-Casanova, Ludovic Jason, Luc Davenne, Xavier Pinelli
To cite this version:
Anaëlle Torre-Casanova, Ludovic Jason, Luc Davenne, Xavier Pinelli. Confinement effects on the steel–concrete bond strength and pull-out failure. Engineering Fracture Mechanics, Elsevier, 2013, 97, pp.92–104. �10.1016/j.engfracmech.2012.10.013�. �hal-01411076�
Confinement effects on the steel-concrete
bond strength and pull-out failure
A. Torre-Casanova*
,**, L. Jason*
,***, L. Davenne****, X. Pinelli**
* CEA, DEN, DANS, DM2S, SEMT, LM2S1, F-91191 Gif sur Yvette, France
** Laboratoire de Mécanique et Technologie (LMT), ENS Cachan, F-94235 Cachan, France *** LaMSiD, UMR CNRS-EDF-CEA 2832, F-92141 Clamart, France
**** IUT de Ville d’Avray, F-92410 Ville d’Avray, France
Abstract:
In this contribution, an experimental campaign based on unconfined and actively confined pull-out tests is presented to investigate the bond stress-slip behavior. This campaign aims at underlining passive (concrete cover) and active (external pressure) confinement effects on the maximal bond stress. Experimental results are associated to a numerical approach in order to predict the evolution of the bond strength. Equations are finally proposed that distinguish splitting failure (function of the concrete tensile properties) and pull-out failure (function of the compressive concrete properties).
Keywords: pullout, steel-concrete bond, failure, confinement
I
Introduction
Reinforced concrete structures may have to fulfill functions that go beyond their simple mechanical resistance. For example, in some cases, information about the cracking behavior can also become essential (resistance, durability aspects, functionality,…). Predicting the mechanical behavior but also characterizing the crack evolution (opening and spacing) are thus key points in the evaluation of this type of reinforced concrete structures. As the cracking properties (opening and spacing) are influenced by the stress distribution along the interface between steel and concrete [1], this effect has to be taken into account numerically and characterized experimentally.
One way to evaluate the steel-concrete bond is to investigate the bond stress-slip evolution generally obtained through classical pull-out tests [2]. Even if these tests are not totally satisfactory due to structural effects (boundary conditions or stress state for example [3]) and replaced by other
experimental setups (direct tension-pullout bond test [3] or “P.I.AF.” test [4]), they remain the most convenient and simplest experiment to achieve a global estimation of the bond effect.
The main characteristics of the bond stress – slip evolution, and especially the maximum bond stress (also called bond strength), are found to be clearly dependent on material, geometrical or loading parameters. For example, Daoud et al [5] investigated the effect of the bar diameter and proposed an experimental correlation between the bond strength of ribbed and plain bars. Hamad [6] added the spacing and the height of the ribs to the list of influence parameters. This effect was also studied by Castel et al [7] who underlined the positive effect of the ribs (decrease of the influence of the casting conditions like void formation or concrete segregation), especially for self-consolidating concrete (SCC). Valcuende and Parra [8] also interested in SCC and found a higher bond strength compared to vibrated concrete (VC), showing the influence of the concrete properties. In the same way, Collepardi et al [9] indicated that the concrete composition affects the bond strength (change in microstructure with fly ash addition for example).
Concerning the impact of the stress state, Eligehausen et al [10] studied the effect of the passive and active confinement and proposed pull-out tests with transversal reinforcement and uniaxial external pressure. From these results, the confinement (active or passive), also studied in [11] or [12], was defined as one of the key parameters which influenced the value of the maximum bond stress (general increase of the bond strength with increasing confinement). This point is of great concern especially in the case of structures which are reinforced with stirrups or submitted to a triaxial state of stress (prestress for example). Considering these parameters, a wide range of values are found in literature for the experimental maximum bond strength. Table 1 gives examples from the previous references. In this contribution, an experimental campaign based on unconfined and confined pull-out tests is combined with a numerical approach in order to predict the bond strength. The effect of confinement (passive confinement through the concrete cover and active confinement through external pressure) is particularly studied to propose an evaluation of the maximal bond stress as a function of the concrete cover and of the stress state.
Castel et al [7] Valcuende and Parra [8] Daoud et al [5] Collepardi et al [9] Laborderie and Pijaudier-Cabot [11] SCC ribbed bars: 23.8 MPa VC plain bars: 3.2 MPa SCC: 28 MPa VC: 23.7 MPa Plain bars: 3.46 MPa Ribbed bars: 22.26 MPa Ordinary flowing concrete: 12 MPa SCC: 25 MPa 5 MPa confinement: 12.38 MPa 15 MPa confinement: 15.92 MPa
In this sense, it aims at completing the work from Tepfers [13] or Uijl and Bigaij [14] among others who developed equations with the hypothesis of a partly cracked stage and a plastic stage in the case of a splitting failure. The experimental setup and results are presented in the first part while the numerical simulation of the confinement effects is presented in a second time. Finally, equations are proposed in order to evaluate the bond strength.
II Experimental program
II.1 Test setup and specimens
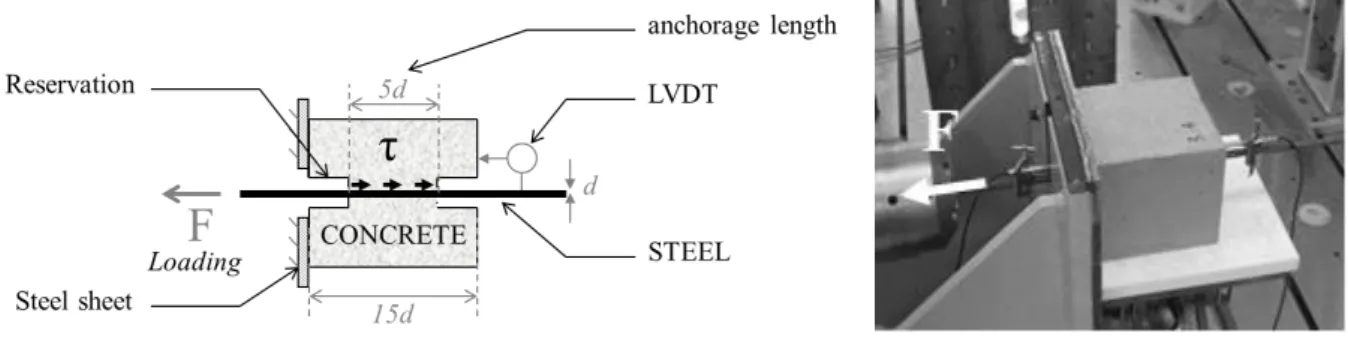
The tested specimens are concrete cubes with a unique ribbed reinforcement of 12 mm diameter d. Each side of the cube measures 15d and the anchorage is limited to a length of 5d (Figure 1). This size has been chosen in order to avoid a splitting failure and to guarantee the pulling of the bar.
Figure 1 : Pull-out set up
Following the prescriptions given in [2], a displacement is imposed at one end of the reinforcement while the concrete is restrained by a steel sheet on the loading side. In order to obtain the relation between the bond stress τ and the steel-concrete slip, the tensile force F, applied on the reinforcement, is measured. The bond stress, supposed uniform along the reinforcement [2], is then obtained using relation (1).
dl F
(1)where l represents the anchorage length (5d in our case).
The relative displacement between steel and concrete is measured at the unloading end of the reinforcement through a LVDT sensor.
Specimens are cast with a minimum of 28 days before testing. Concrete properties, evaluated on concrete cylinders, are presented in Table 2 (average values).
Compressive strength fc (MPa) Tensile strength fct (MPa) Young Modulus (GPa) Maximum size of aggregate (mm) w/c ratio Admixtures 36.6 3.12 28 16 0.53 none
Table 2: Mechanical properties of concrete
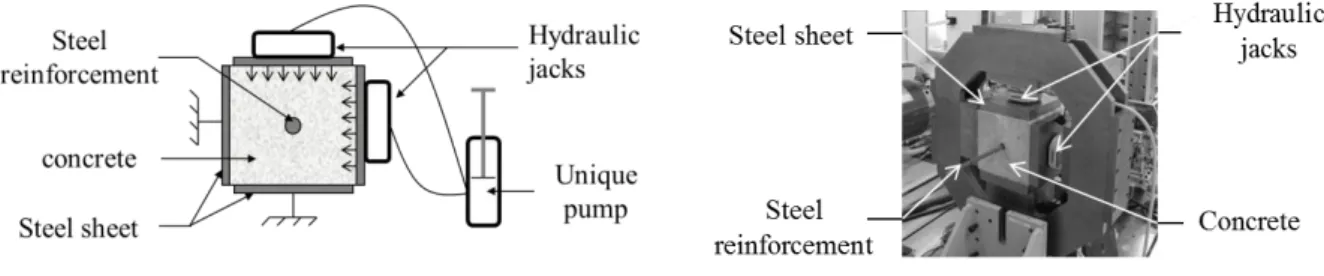
In order to study the effect of the confinement, a special testing frame (Figure 2) has been developed to apply a uniform pressure on the direction perpendicular to the reinforcement. It is composed on four thick steel sheets and two hydraulic jacks. When it is considered, the confinement is applied before the pull-out loading. Due to a classical large discrepancy of the results, the experimental campaign includes 9 unconfined specimens and 6 confined ones.
II.2 Experimental results
II.2.1 Unconfined specimens
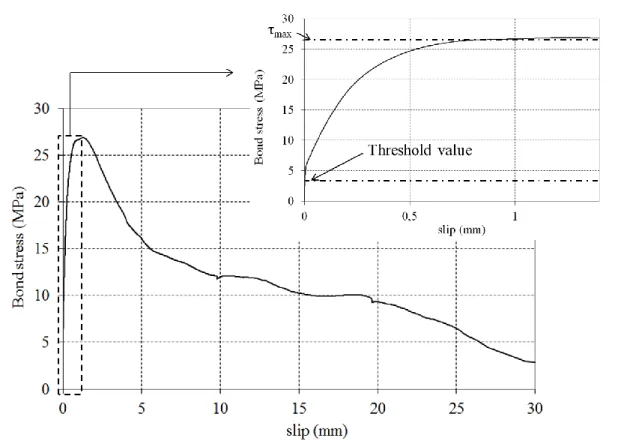
As expected, the failure of the specimens is caused by a pulling of the bar and no visible crack appears on the concrete surface. An example of the bond stress-slip law is presented on Figure 3.
Figure 2 : Confinement frame
A classical evolution is obtained which follows five main steps. During the first phase, a threshold value of 5MPa (zoom on Figure 3) is observed before the evolution of the slip. Then, the concrete is gradually compressed in front of each rib of the deformed bar and some micro-cracks appear at the steel-concrete interface (gradual increase of the shear stress with the slip). At the end of this phase, the bond stress reaches its maximal value τmax, called the bond strength. Then, the bond stress decreases as
the degradation of the steel-concrete interface develops. Finally, the bond behavior tends to a friction between the two materials (asymptotic behavior).
Figure 3 : Example of a bond-stress slip law (global curve and zoom on the prepeak behavior)
From the 9 unconfined specimens, the average value and the standard deviation of the bond strength τmax are equal to 24.3 MPa and 2.70 MPa respectively. Compared to results from literature in Table 1,
it is found that the bond strength measured on the tested specimens is generally higher than the average values obtained in literature. The origin of these differences will be investigated in part III.
II.2.2 Influence of the active confinement
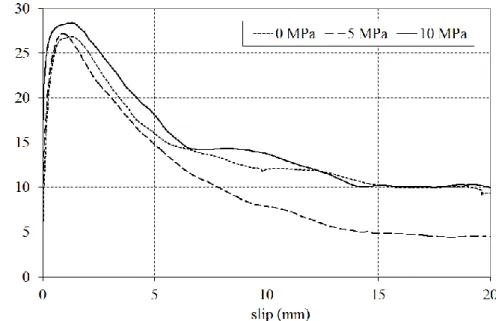
Figure 5 represents the bond stress-slip law obtained with different confinements (5 and 10 MPa). The average values of the bond strength are compared for each confinement pressure in Table 3. No clear tendency can be underlined here (less than 15 % on the bond strength). In order to better estimate the confinement effect, Figure 5 presents the normalized curves corresponding to the bond stress normalized by max as a function of the slip normalized by g(max) during the prepeak phase. On this
second graph, the consequences of the confinement on the bond behavior can be observed, especially on the beginning of the curve: the initial threshold increases with the confinement pressure.
Figure 4: Effect of the confinement on the bond stress-slip law
Figure 5 : Effect of the confinement on the normalized bond stress-slip law
Finally, to conclude on the experimental tests, Table 3 presents the main results of the experimental campaign.
Confinement unconfined 5 MPa 10 MPa
Mean value of the
maximum bond stress 24.28 MPa 25.50 MPa 28.50 MPa
Standard deviation 2.70 MPa 1.42 MPa 0.18 MPa
Coefficient of variation 11% 5.7% 0.6%
III Simulation of the pull out test-confinement effect
From the comparison between the experimental results and literature, a tendency can be highlighted: the bond strength is high and not dependent of the active confinement. Many properties can account for these results (concrete properties especially) but one of the main difference compared to literature is the concrete cover c (c = 7d in the proposed study while c = 1.23d in [6], c = 3.67d in [7] and c = 5.75d in [8]). To evaluate its impact, the effect of this cover (passive confinement) and of the active confinement directly applied on the specimen, associated to the concrete properties (tensile and compressive strengths especially) will be numerically investigated in this section.
III.1 Local steel-concrete interactions
For reinforced concrete structures, the bond between steel and concrete is principally governed by the mechanical interaction between the ribs of the steel bars and concrete. Locally, the bond effects on concrete may be divided into two components: a tangential shear stress in the direction of the reinforcement and a radial component p. Classically, the relation between p and can be written ([14] or [15] for example):
*tan
p (2)
where α is the angle between the rib and the axis of the reinforcement (Figure 6).
In a first approximation, α can be assumed constantly equal to 45° ([13] among others). The radial and tangential components become thus equal: p = τ.
Figure 6 : Components of bond stress induced by the steel ribs
III.2 Simulation hypothesis
III.2.1 Geometry, boundary conditions and loading
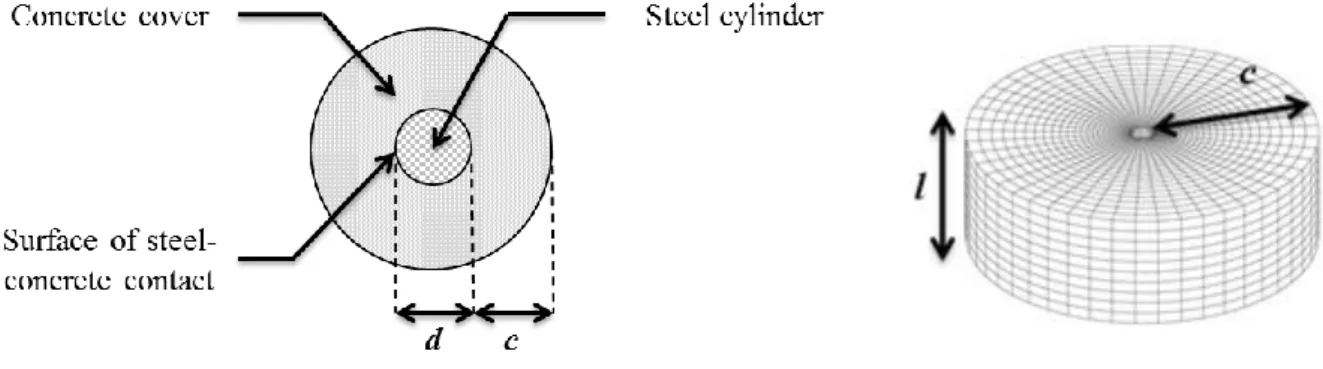
In this part, the consequences of the bond effect on concrete are studied. The concrete specimen is represented by a hollow cylinder (Figure 7) whose dimensions are chosen as follow:
- the internal diameter d represents the nominal diameter of the steel reinforcement (d = 12 mm in our case)
α
concrete
steel
p
Slip direction
α
concrete
steel
p
Slip direction
- the concrete cover c corresponds to the minimal cover of the experimental specimens (c = 7d in this campaign)
- the height is equal to the adherence length between steel and concrete (l = 5d in this case) To take into account the passive effect of the reinforcement bar and to avoid a wrong concrete deformation especially during active confinement, a 3D steel cylinder is added to the mesh associated to a unilateral contact condition. The cylinder is meshed by 8 node linear elements (Figure 7).
Figure 7 : Principle of the simulation and dimension (left), concrete mesh (right)
Figure 8 : Loading represented by distributed forces
The steel-concrete interactions are taken into account trough a tangential and a normal stress applied on the internal surface of the concrete cylinder. These stresses are represented by distributed forces applied on concrete at the position of the steel reinforcement (Figure 8).
Boundary conditions are applied as follow (Figure 9): - Px is blocked in the x direction
- Py and Py’ are blocked in the y direction
Figure 9: Boundary conditions
III.2.2 Concrete model
The concrete behavior is modeled with a constitutive law that combines damage and plasticity [16]. In this law, damage is represented by two independent variables d + and d - which have respectively an influence in tension and compression. The stress σ is thus evaluated thanks to the following relation (equation (3))
' '
' '1 d 1 d
(3)
where 'and 'correspond respectively to the positive and the negative parts of the effective stress
'
(equation (4)).
' C p
(4)
In this relation,psymbolizes the irreversible strains governed by the damage evolution in compression (equation (5)). C is the tensor of elasticity and ε represents the total strain.
' 1 ' ' ' : ( ) : : p EH d C (5)
where β is a model parameter, E the young modulus H a Heaviside function and 〈. 〉 represents the positive part
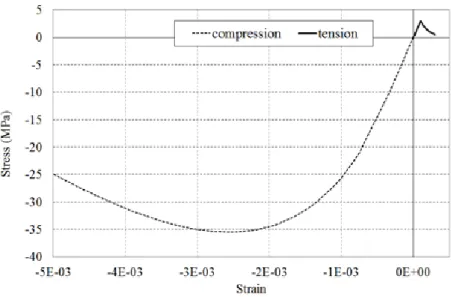
The model parameters have been calibrated in order to represent the experimental uniaxial behaviors properties (Table 2). Figure 10 illustrates the response in tension and in compression.
This model has been chosen because it is well adapted to internal pressure loading inside a cylinder, which represents one of the components of the bond forces (see Figure 6). Figure 11 illustrates for example the results obtained with the proposed model for the simulation of the experimental results from [17]. In this experiment, the maximum internal pressures pmax applied on hollow concrete
cylinders for different cover to diameter ratios c/d were measured. The changing parameters were the concrete mixture and properties (water to cement ratio and admixtures leading to tensile strength ranging from 2.1 MPa to 2.61 MPa in the presented curves) and the internal and external diameters (to change the c/d ratio). The figures presented for three different values of the tensile strength show the
ability of the constitutive law to reproduce the experimental behavior in a quite good way, except perhaps for very thick cover (c/d = 10.6) for which the experimental behavior is over or underestimated.
Figure 10 : Simulated behavior in uni-axial tension and compression
Figure 11: Simulation of the experimental results from [17]. The three figures correspond to three values of the experimental tensile strength (respectively 2.16, 2.55 and 2.61 MPa from top left to bottom).
III.3 Simulation of pull out tests
III.3.1 Simulation of the experimental test
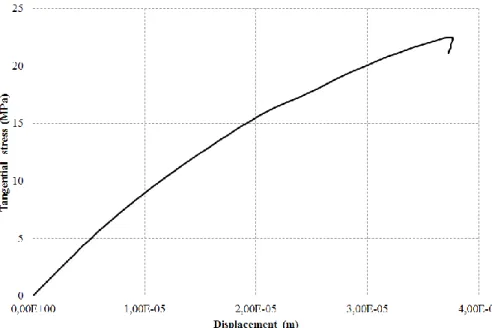
The simulation is performed in the finite element code Cast3m [18] using the dimensions of the test presented in the first part of this paper (paragraph III.2.1). Figure 12 illustrates the evolution of the tangential stress as a function of the tangential displacement (in the axis of the cylinder) of a point located in the central part. A bond strength of 22.5 MPa is simulated which is in a good agreement with our experimental average value (24.3 MPa).
Figure 12 : Global behavior of a hollow cylinder (c = 7d)
III.3.2 Cover effect
In order to understand the effect of the concrete cover and to explain the differences obtained in literature, several specimens are simulated with different cover thicknesses c. The other parameters are kept identical to those described in the paragraph III.2.1.This simulation is done on 16 concrete covers ranging from 0.5d to 7.5d.
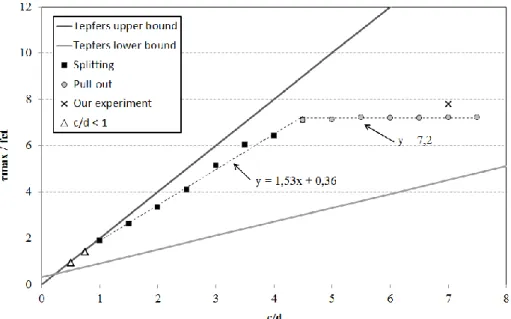
To summarize these results, the evolution of τmax/fct with c/d is represented in Figure 13. This
normalized representation was initially introduced by Tepfers [13] who calculated two analytical solutions that successfully bound the experimental bond strengths in pull-out tests. The principle of this approach was to consider only the splitting part of the loading (normal stress only).
In accordance to Tepfers [13], our simulations give bond strengths which are situated between the analytical bounds but enable to propose a more accurate description.
The bond strength grows first linearly following the upper bond from Tepfers [13]. Then, the slope decreases once the cover becomes higher than the steel diameter. The bond strength evolution of these specimens (c/d > 1) is described by a bi-linear law, corresponding to different failure modes. The first part can be related to a splitting failure where the concrete cover is not sufficient to avoid transversal cracks to appear and develop. On the contrary, the bond strength of thicker specimens (for cover more than 4.5d) remains constant. It corresponds to a pulling failure where the bar is pulled out with no apparition of external cracks.
Figure 13 : Bond strength evolution with the concrete cover
To confirm this evolution between the two failure modes, Figure 14 gives the damage distributions obtained for two simulations at the end of the loading (c/d = 3,5 and c/d = 7). For the thin cylinder, the damage zone reaches the external surface and triggers a splitting failure (Figure 14a). For c/d = 7, the concrete is only partially cracked (Figure 14b) and the specimen failed by a pull-out of the reinforcement. From these results, it seems thus possible to describe the splitting and pull-out failure of the concrete specimen, contrary to what was proposed in [13] or [15] (only splitting failure). In our case, the evolution of the bond strength with the concrete cover is governed by two equations:
max 1.53 0.36 ct c f d (6)
for splitting failure (c/d>1) and
max 7.2
ct
f
(7)
a) b)
Figure 14 : damage distribution (d+) for two specimens
a) c = 3,5d et b) c = 7d
III.3.3 Bond strength evolution
In order to further investigate the equations provided in the previous section, the same computations are performed using three different values of the tensile strength for two different concrete covers (c/d = 7 and c/d = 2.5). The parameters of the model in tension are thus changed in order to obtain values of 2, 2.5 and 3.12 MPa for the tensile strength fct respectively (Figure 15). The parameters in
compression are not modified.
Figure 16 illustrates the results. For a low concrete cover, the position of the points in the (max
ct
f ) – ( c
d ) curve does not change. It confirms that the splitting failure is governed by the concrete tensile
properties and that the bond strength has a linear evolution during this phase. On the contrary, for large concrete covers, max
ct
f is no more constant. Table 4 provides a comparison
of the ratio max
ct
f and
max
c
f where fc is the compressive strengthfor different values of the tensile and
Figure 15: Axial behavior in tension for the parametric study
Figure 16: Effect of the concrete tensile strength on the bond strength
fct (MPa) 2 2.5 3.12 2 2.5 fc (MPa) 36.6 36.6 36.6 17.2 24.05 max ct f 11.06 8.85 7.2 5.58 6.10 max c f 0.60 0.60 0.61 0.65 0.63
A constant ratio is obtained when considering the compressive strength: the bond strength for pull-out failure is a constant function of this parameter. It becomes possible to conclude that the bond strength in splitting failure is rather governed by the tensile properties while the pull-out failure is driven by compressive properties. The evolution of the bond strength in splitting failure follows the equation (for realistic cover): max 1.53 0.36 ct c f d (8)
while the bond strength in pull-out failure is governed by :
max 0.6
c
f
(9)
This couple of equations provides information about the bond strengths of the specimen for different covers. In this sense, it completes the work from [14] but without any hypothesis on the splitting to pull-out critical bond stress (proposed equal to 5fct in their work).
Considering the continuity of the failure, one can also determine the concrete cover that corresponds to a change from a splitting failure to a pull-out failure:
splitting to pull-out ( ) 0.39 c 0.24 ct f c d f (10)
For the properties of our specimen, it comes: ( )c splitting to pull-out 4.34
d . It is interesting to notice that this
value is very close to the one provided in [2] ( c
d = 4.5).
In order to better validate the numerical approach, a comparison with experimental results from literature and our experimental campaign is provided in Figure 17 (splitting failure) and Table 5 (pull-out failure). It shows a rather good agreement between the simulation and the experiment, despite the different experimental concrete properties and the limited number of parameters in the proposed equations (compared to more complex but also probably more representative theoretical modeling like limit analysis model in [19]).
Figure 17. Comparison with experimental results. Splitting failure
Reference c/d (τmax/fc)average Standard
deviation Coefficient of variation τmax/fc (proposed model) Valcuende and Parra [8] 5.75 0.55 0.05 9% 0.61 Our experiment 7 0.66 0.07 11%
Table 5: Comparison with experimental results from literature and our experiment. Pull-out failure
III.4 Effect of active confinement
To conclude, the effect of the active confinement is investigated using the same methodology. In the simulation, based on the same principle as in the previous section, the active confinement is represented through the introduction of an external pressure (Figure 18).
Figure 18: Principle of the simulation of the active confinement
0 1 2 3 4 5 6 7 8 9 0 1 2 3 4 5 6 p m ax/fc t c/d simulation
Esfahani and Rangan [20] Castel et al [7]
Cattaneo and Rosati [19] Hamad [6]
Figure 19 : Bond strength evolution with the concrete cover for different external pressures
Figure 19 illustrates the bond strength evolution with the concrete cover for 3 levels of external pressure (0; 5 and 10 MPa). For thick concrete covers, the bond strength remains constant, even in the case of confinement. It thus tends to validate the experimental results presented in this contribution. In fact, the active confinement effect is only visible for the thinnest specimens for which a high increase of the bond strength is obtained (gradual change from a splitting to a pull-out failure).
IV Conclusion
In this contribution, the effect of the confinement (passive confinement through the concrete cover and active confinement through external pressure) on the steel-concrete bond strength was investigated. A numerical approach associated to an experimental campaign was proposed to characterize the failure mode of pull-out tests and to estimate the maximum value of the bond stress. From this approach, it was possible to reproduce both splitting and pull-out failures, depending on the concrete cover (splitting failure for low concrete covers and pull-out failure for others cases). Two equations were obtained to describe the evolution of the bond strength, depending on the tensile concrete properties for splitting and compressive concrete properties for pull-out. They were compared to experimental results and to literature (Tepfers’ bond curves especially) and indicated a good agreement. Considering the active confinement, numerical and experimental results showed no significant influence on the bond strength for high concrete covers and a fast increase for low values.
The proposed equations could thus give an estimation of the bond strength when the steel-concrete bond wants to be taken into account (without heavy experimental campaigns with parametric studies considering tensile and compressive concrete properties). Nevertheless, it has to be used carefully considering the discrepancy of the concrete properties (material heterogeneity especially) from which
it is calculated and the influence of other parameters (like concrete mixture, aggregates… [21] for example) that should probably be investigated.
V References
[1] Eurocode 2. Calcul des Structures en béton, NF-EN-1992, 2007.
[2] RILEM. Essai portant sur l’adhérence des armatures de béton – Essai par traction, Matériaux et
Constructions, Vol 3, N°15, p. 175-178, 1970.
[3] R.P. Tastani, S.J. Pantazopulou. Experimental evaluation of the direct tension-pullout bond test, “Bond in Concrete- from research to standards”, Budapest, 2002.
[4] B.H. Tran, Y. Berthaud, F. Ragueneau. Essai P.I.A.F. : Pour Identifier l’Adhérence et le Frottement, AUGC XXVIIème Rencontres Universitaires de Génie Civil, 2009.
[5] A. Daoud, M. Lorrain, M. Elgonnounil. Resistance à l’arrachement d’armatures ancrées dans du béton autoplaçant, Matériaux et Constructions, Vol 35, p. 395-401, August 2002.
[6] B.S. Hamad. Bond Strength Improvement of Reinforcing Bars with Specially Designed Rib Geometries, ACI Structural Journal, Vol 92, N°1, p. 3-13, January-Febrary 1995.
[7] A. Castel, T. Vidal, K. Viriyametanont, R. François. Effect of Reinforcing Bar Orientation and Location on Bond with Self-Consolidating Concrete, ACI Structural Journal, Vol 103, N°4, p. 559-567 July-August 2006.
[8] M. Valcuende, C. Parra. Bond behaviour of reinforcement in self-compacting concretes,
Constructions and Building Materials, Vol 23, p. 162-170, 2009.
[9] M. Collepardi, A. Borsoi, S. Collepardi, R. Troli, Strength, shrinkage and creep of SCC and flowing concrete, Proc. Of SCC2005 Conf. Center for Advanced Cement Based Materials, USA Northwestern University, pp. 911-920, 2005
[10] R. Eligehausen, E. p. Popov et V.V. Bertero. Local bond stress-slip relationships of deformed bars under generalized excitations, University of California, Report N° UCB/EERC-83/23, October 1983.
[11] C. La Borderie, G. Pijaudier-Cabot. Influence of the state of stress in concrete on the behavior of the steel concrete interface, “Concrete Fracture mechanics of structures”, Colorado, USA, 1992. [12] L. J. Malvar. Bond of Reinforcement Under Controlled Confinement, ACI Material Journal, Vol 89, N° 6, November-December 1992.
[13] R. Tepfers. Cracking of concrete cover along anchored deformed reinforcing bars. Magazine of
Concrete Reasearch, Vol 31, N°106, p. 3-12, 1979.
[14] J.A.Uijl, A.J. Bigaj. A bond model for rebbed bars based on concrete confinement, Heron English
[15] X. Wang, X. Liu. A strain-softening model for steel-concrete bond, Cement and Concrete
Research, Vol 33, p. 1669-1673, 2003.
[16] C. Costa, P. Pegon, A. Arêde, J. Castro. Inplementation of the damage model in tension and compression with plasticity in Cast3M ; JRC Report ; 2004.
[17] S. Morinaga. Prediction of service lives of reinforced concrete buildings based on rate of corrosion of reinforcing steel ; Special report of institute of technology, Shimizu corporation ; N°23, June 1988.
[18] Cast3m. http://www-cast3m.cea.fr, 2011.
[19] S. Cattaneo, G. Rosati, Bond between steel and self-consolidating concrete: experiments and modeling, ACI Structural Journal, 106, pp. 540-550, 2009
[20] M.R. Esfahani, B.V. Rangan, Local bond strength of reinforcing bars in normal strength and high-strength concrete (HSC), ACI Structural Journal, 95, pp. 96-106, 1998
[21] Z. Dahou, Z. Medhi Sbartaï, A. Castel, F. Chomari. Artificial neural network model for steel-concrete bond prediction, Engineering Structures, Vol 31, p. 1724-1733, 200