HAL Id: hal-02748958
https://hal.inrae.fr/hal-02748958
Submitted on 3 Jun 2020
HAL is a multi-disciplinary open access
archive for the deposit and dissemination of
sci-entific research documents, whether they are
pub-lished or not. The documents may come from
teaching and research institutions in France or
abroad, or from public or private research centers.
L’archive ouverte pluridisciplinaire HAL, est
destinée au dépôt et à la diffusion de documents
scientifiques de niveau recherche, publiés ou non,
émanant des établissements d’enseignement et de
recherche français ou étrangers, des laboratoires
publics ou privés.
How can a dry forage database be used to predict fresh
grass composition by NIR spectroscopy? Data transfer
vs spectra transfer
Laurent Bonnal, Lionel Julien, Magalie Delalande, Denis Bastianelli
To cite this version:
Laurent Bonnal, Lionel Julien, Magalie Delalande, Denis Bastianelli. How can a dry forage database
be used to predict fresh grass composition by NIR spectroscopy? Data transfer vs spectra transfer. 16.
International Conference on Near Infrared Spectroscopy. NIR 2013, Institut National de Recherche
en Sciences et Technologies pour l’Environnement et l’Agriculture (IRSTEA). Montpellier, FRA., Jun
2013, La Grande-Motte, France. 712 p. �hal-02748958�
NIR2013 Proceedings, 2-7 June, La Grande-Motte, France. ST4 – Experimental Methodologies
Bellon-Maurel V., Williams P., Downey G., Eds 685
How can a dry forage database be used to
predict fresh grass composition by NIR
spectroscopy? Data transfer vs spectra
transfer.
L. Bonnal
a
, L. Julien
a
, M. Delalande
b
, D. Bastianelli
a
aCIRAD, UMR SELMET Laboratory of Animal Nutrition, Montpellier, France
b
INRA, Platform DIASCOPE Domaine de Melgueil DIAPHEN, Mauguio, France
Corresponding author: [email protected]
Introduction
Near infrared reflectance (NIR) spectroscopy is widely-used for prediction of chemical composition of dried forages. Our laboratory has developed large databases of dried forage samples. However, these calibrations cannot be used for the direct measurement of fresh samples in on-field studies. The development of a specific and robust calibration for fresh samples is a large task which requires several hundred chemical measurements and a lot of time. So it is preferable to try to use the databases of dried forages already available in order to simplify this process. There are many methods to transfer calibrations (Fearn, 2001). In the present work, we tested two different strategies. The first study compared the use of NIR predictions obtained from dried samples and the use of reference laboratory data as input for fresh forage calibration. The second study was to transfer directly wet spectra into a database of dry spectra, by emulation of dry spectra by spectral regression (PLS prediction), as can be done for calibration transfer between instruments (e.g. Forina et al., 1995; Peng et al., 2011).
Materials and methods
Spectral databases
For this study, 103 grass samples (Dactylis sp. and Festuca
sp.) were collected from the DIASCOPE platform for
experimentation (INRA-Mauguio, France). The grasses (varieties and wild accessions) came from a wide panel originating in 15 countries. Each grass sample was cut at the ear emergence stage.
Whole, fresh, unground samples were scanned in reflectance mode immediately after cutting (FRESH database) with a LabSpec Pro spectrometer (ASD, Boulder, CO, USA) fitted with a High Intensity Contact Probe (spot diameter 10 mm). Each sample was scanned 15 times and spectra were averaged in order to take heterogeneity into account. All samples were then dried and ground to 1 mm before being scanned in reflectance mode on a NIRSystems
6500 spectrometer (Foss, Silver Spring, MD, USA). The samples were analysed in standard circular cups (diameter 3.75 cm), in duplicate, with two different cup fillings and then averaged (DRY database). For prediction of dried ground samples in the first study, an existing database of about 1000 samples of forages from a wide range of species or origins was used (CIRAD, unpublished data). The 1000 samples were scanned on the same NIRSystems 6500 spectrometer.
Chemical analysis
The forages were analysed according to the European Standards for crude protein (CP, Kjeldahl method) NF EN ISO 5983-2 and acid detergent lignin (ADL, Van Soest method) NF EN ISO 13906. In this paper, all data (measured or predicted) are expressed on a dry matter basis (%DM), even when related to spectra taken on fresh samples.
Spectra pre-treatment and calibration
Data treatment was performed with WinISI software (Infrasoft International, Port Mathilda, PA, USA). All spectra were pre-treated with SNV and detrend, on a 2nd derivative, after elimination of visible wavelengths. Given the limited number of samples available, samples were randomly divided into two groups: 78 as a calibration set and 25 as a validation set. Calibration equations were obtained using the modified partial least squares (mPLS) regression procedure of WinISI software. Calibration statistics presented are the standard error of calibration (SEC) and the coefficient of determination (R²cal). Validation performed on the independent dataset of 25 samples led to the calculation of the standard error of prediction (SEP) and the coefficient of determination of validation (R²val).
NIR2013 Proceedings, 2-7 June, La Grande-Motte, France. ST4 – Experimental Methodologies
Bellon-Maurel V., Williams P., Downey G., Eds 686
The first study concerned the calibration on FRESH database. Calibration was performed with reference data originating either from wet chemistry (CP_w and ADL_w) or from data issued from CP and ADL prediction by a general database of dry forages (n= 1000; SEP = 0.83% and 0.73% for CP_p and ADL_p respectively). Validation w as always performed with wet chemistry values. The objective of the second study was to emulate dry spectra from fresh spectra. For this feasibility study, we used reduced spectra (62 wavelengths from 1130 nm to 2472 nm with gap = 22 nm) in order to simplify calculations. Absorbance values from DRY spectra were used as dependent (Y) variables to develop PLS models with FRESH spectra. With these calibration equations, we could transform FRESH spectra into DRY spectra in order to test CP and ADL prediction. Validation was performed on the independent validation set emulated using the same procedure.
Results and discussion
Calibration with FRESH database
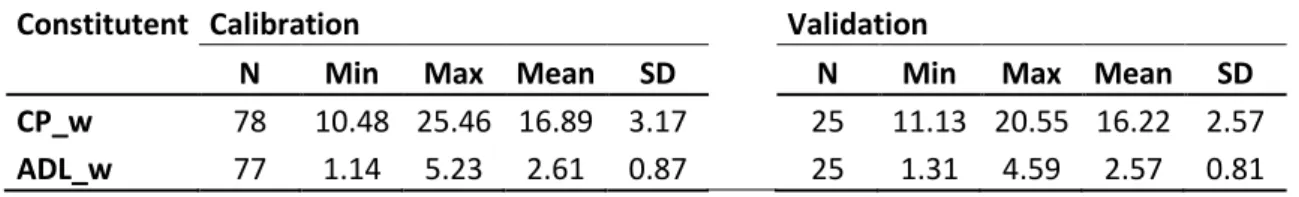
Reference chemical measurements of the FRESH database were quite variable: CP_w ranged from 10.48 to 25.46%DM and ADL_w ranged from 1.14 to 5.23%DM (Table 1). Validation set covered the same range as calibration set. For CP, calibration of FRESH database with (i) reference laboratory values or (ii) values predicted by NIR on dried samples led to SEC = 0.82% vs 0.75% and R²cal = 0.93 vs 0.93. Validation on the independent dataset led to SEP = 1.55% and R²val = 0.64 if the calibration was done with measured data and SEP = 1.48% and R²val = 0.67 if the calibration based on data predicted by NIR on dried samples (Table 2).
For ADL, calibration of FRESH database with (i) reference laboratory values or (ii) values predicted by NIR on dried samples led to SEC = 0.33% vs 0.57% and R²cal = 0.78 vs 0.70. Validation on the independent dataset led to SEP = 0.52% and R²val = 0.58 if the calibration was done with measured data and SEP = 0.67% and R²val = 0.47 if the calibration based on data predicted by NIR on dried samples (Table 2).
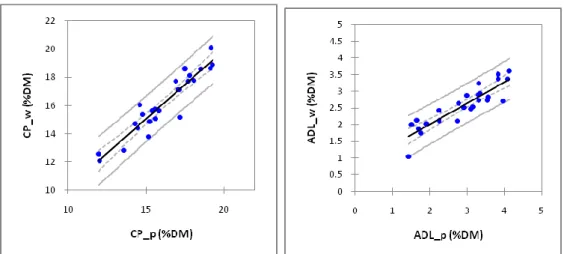
The comparison between the two calibration strategies (Figure 1) showed similar results with a good relationship between predictions i.e. R² = 0.88 for CP and R² = 0.80 for ADL. There was no significant bias and the slope of the regression was not significantly different from 1.
Therefore, for calibration development of fresh samples, it is possible to use values predicted by equations based on dry samples rather than reference laboratory values without introducing a major bias in prediction.
Table 1. Descriptive statistics of wet chemistry values for calibration and validation set
Constitutent Calibration
Validation
N
Min
Max
Mean
SD
N
Min
Max Mean
SD
CP_w
78
10.48
25.46
16.89
3.17
25
11.13 20.55 16.22 2.57
ADL_w
77
1.14
5.23
2.61
0.87
25
1.31
4.59
2.57
0.81
N : number of samples; SD : standard deviation
Table 2. Calibration statistics for prediction of CP and ADL content with wet chemistry values (CP_w and ADL_w) or predicted values on dried samples (CP_p and ADL_p)
Constituent
N
Mean
SD
Terms
SEC
R²cal
SEP
R²val
CP_w
76 16.78 3.05
6
0.82 0.93 1.55 0.64
CP_p
76
16.70
2.82
6
0.75
0.93
1.48
0.67
ADL_w
67
2.45
0.70
3
0.33 0.78 0.52 0.58
ADL_p
73
2.67
1.03
2
0.57 0.70 0.67 0.47
N : number of samples used for calibration; SD : standard deviation; SEC : standard error of calibration; R²cal : coefficient of determination of calibration; SEP : standard error of prediction; R²val : coefficient of determination of validation
NIR2013 Proceedings, 2-7 June, La Grande-Motte, France. ST4 – Experimental Methodologies
Bellon-Maurel V., Williams P., Downey G., Eds 687
Figure 1. Relationship between predictions obtained with wet chemistry values and predicted values on dried samples of validation set
Calibration with emulated dry spectra
Calibration equations developed with the FRESH database for the 62 absorbance values from the DRY database had an average R² = 0.75 (range of R² from 0.30 to 0.98). Figure 2 presents an example of relationship between measured
absorbance and emulated absorbance for one wavelength (2054 nm) typically attributed to a near infrared absorption band of protein.
Figure 2. Relationship between measured absorbance and emulated absorbance for one wavelength (2054 nm) which corresponds to a protein absorption band
These equations were used to import FRESH spectra into the DRY database (spectra emulation). The emulated spectra allowed the development of calibrations for CP and ADL in the DRY database and to compare performance of equations based on (i) “real” DRY spectra of the 75 calibration samples or (ii) spectra emulated from fresh spectra of corresponding samples.
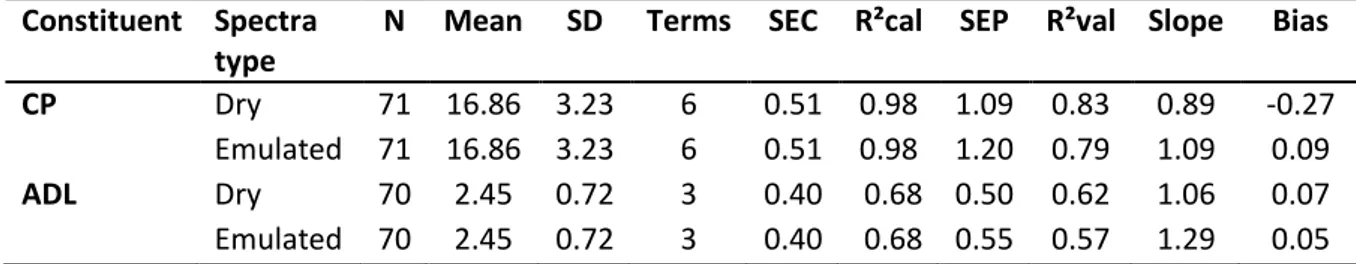
For CP, the validation of strategies (i) and (ii) had respectively SEP = 1.09 vs 1.20%, R²val = 0.83 vs 0.79, slope = 0.89 vs 1.09 and bias = -0.27 vs 0.09% (Table 3). For ADL, corresponding values were respectively SEP = 0.50 vs 0.55%, R²val = 0.62 vs 0.57, slope = 1.06 vs 1.29 and bias = 0.07 vs 0.05% (Table 3). 0,01 0,02 0,03 0,04 0,05 0,06 0,07 0,01 0,03 0,05 0,07 A bs orbance at 2054 nm (Dry s pe ct ra)
NIR2013 Proceedings, 2-7 June, La Grande-Motte, France. ST4 – Experimental Methodologies
Bellon-Maurel V., Williams P., Downey G., Eds 688
Figure 3. Projection of emulated dry spectra from fresh spectra (□) on the principal component analysis (PCA) score plot of dry spectra calibration set (●) Projection of the emulated dry spectra from fresh spectra (validation set) onto the principal component space of the dry spectra calibration set (Figure 3) showed a good integration of the validation set, with an average global Mahalanobis distance GH = 0.96.
Table 3. Calibration statistics for prediction of CP and ADL content with measured dry spectra or emulated dry spectra from fresh spectra by prediction
Constituent Spectra
type
N Mean
SD
Terms SEC R²cal SEP R²val Slope
Bias
CP
Dry
71 16.86 3.23
6
0.51 0.98 1.09 0.83
0.89
-0.27
Emulated 71 16.86 3.23
6
0.51 0.98 1.20
0.79
1.09
0.09
ADL
Dry
70
2.45
0.72
3
0.40
0.68 0.50 0.62
1.06
0.07
Emulated 70
2.45
0.72
3
0.40
0.68 0.55 0.57
1.29
0.05
N : number of samples used for calibration; SD : standard deviation; SEC : standard error of calibration; R²cal : coefficient of determination of calibration; SEP : standard error of prediction; R²val : coefficient of determination of validationResults of the current study (Table 3 and Figure 3) indicate that emulation of dry spectra from fresh spectra obtained by prediction could be a successful strategy to transfer fresh spectra to a dry spectra database. Moreover, validation with emulated dry spectra strategy showed more accurate results than with direct calibrations on fresh spectra. This is a generalisation of the direct standardisation procedures (DS, PDS) used to transfer spectra between similar instruments (eg. Forina et al., 1995). However, this strategy must be validated with a larger dataset and a fully independent validation dataset.
Conclusion
For long term capitalisation of data, fresh forage databases have to be developed; those could be based on values predicted by existing calibration databases on dry forages. However it is probably useful to include some wet chemistry values in the databases. In our study there was no significant deterioration of SEP or bias due to the use of predicted values. For one-shot studies, we can consider the development of dry sample databases by transfer of emulated spectra.
Preliminary tests presented in this paper on reduced spectra showed the feasibility of this approach.
References
Fearn, T. (2001). Standardisation and calibration transfer for near infrared instruments: a review. J. Near Infrared
Spectrosc., 9, 229-244.
Peng J. et al. (2011). Near-infrared calibration transfer based on spectral regression. Spectrochim. Acta Part A, 78, 1315-1320.
Forina M. et al. (1995). Transfer of calibration function in near-infrared spectroscopy. Chemometr. Intell. Lab., 27, 189-203.
NIR2013 Proceedings, 2-7 June, La Grande-Motte, France. ST4 – Experimental Methodologies
Bellon-Maurel V., Williams P., Downey G., Eds 689
Transferability to a low-cost portable NIR
Spectrometer of a physical-mathematical
model for predicting the distribution of fat
globules in raw milk.
G. Cabassi
a
,
L. Marinoni
b
, S. Vero
a
,
T. M.P.Cattaneo
c
aConsiglio per la Ricerca e la Sperimentazione in Agricoltura, CRA-FLC, Lodi, Italy
b
Università degli Studi di Milano, DeFENS - Department of Food, Environmental and Nutritional Sciences, Division of Human Nutrition, Milan, Italy
c
Consiglio per la Ricerca e la Sperimentazione in Agricoltura, CRA-IAA, Milan, Italy
Corresponding author:[email protected]
Introduction
The determination of milk fat globule size is of the utmost importance because of its influence on the cheesemaking characteristics of milk and the rheological, sensory and nutritional properties of cheese. (Michalski et al., 2003; Michalski et al., 2007). In this work, we evaluated the transferability to a low-cost portable NIR spectrometer of a physical-mathematical model for predicting the distribution of fat globules in raw milk which was developed and optimised on a benchtop FT-NIR instrument. In general, an existing model developed on a master instrument cannot be applied to spectra recorded under different conditions or on a different instrument (slave) because of differences in the spectral response. To overcome this practical problem, a convenient approach involves the standardisation of spectra (Tan and Li, 2007).
Materials and methods
Samples
From a population of 69 Friesian, Jersey and Brown cows, 34 individual raw milk samples were selected for the standardisation procedure and 35 samples were used as an independent set for validation.
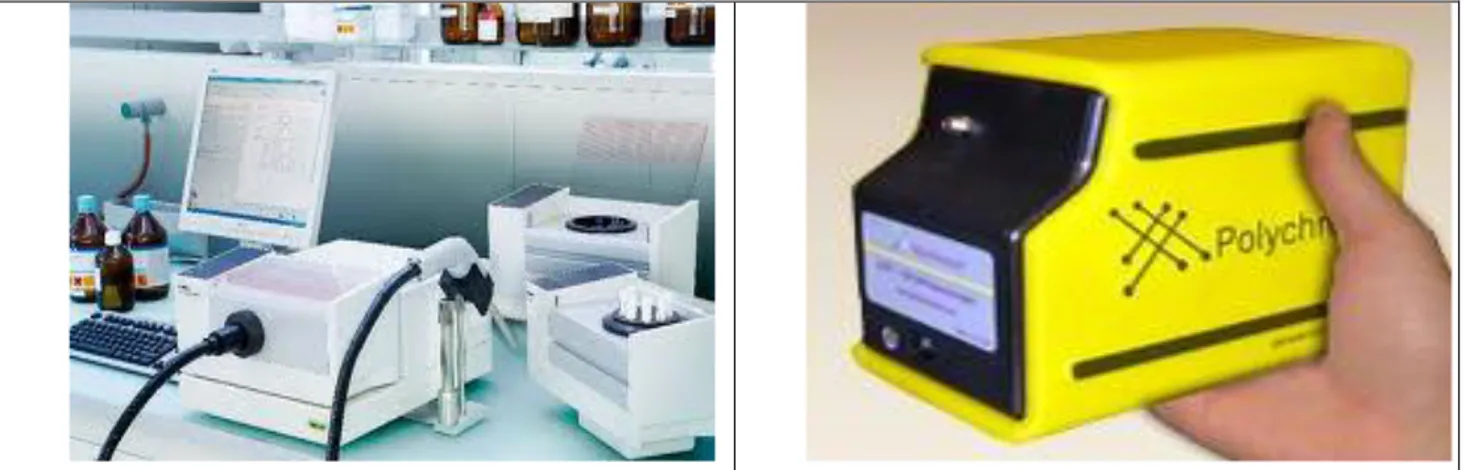
NIR instrumentation
The samples were scanned with the master instrument (FT-NIR; NIRFlex N-500, Büchi Italia, Italy) and the slave instrument (Polychromix DTS-1700; LABPOD-MEMS) (Figures 1 and 2) which is a portable, robust and low cost spectrometer. The two instruments have different working principles. FT-NIR uses a polarisation interferometer based on the Fourier transform while Polychromix is based on DTS™ (Digital Transform Spectroscopy in Hadamard transform) technology with a spatial light modulator based on MEMS (Micro Electro-Mechanical Systems) technology. The instruments have different spectral resolution, 8 cm-1 for FT-NIR and 12 nm for Polychromix; both have an InGaAs detector with that of the FT-NIR having an extended range; the tools also differ in the diameter of the measurement spot (2 mm for the FT-NIR and 5 mm for Polychromix) and for the light collimation. Moreover in the Polychromix instrument, the radiation passes through optical fibres.
NIR2013 Proceedings, 2-7 June, La Grande-Motte, France. ST4 – Experimental Methodologies
Bellon-Maurel V., Williams P., Downey G., Eds 690
Figure 1. Master spectrometer FT-NIR NIRFlex N-500. Figure 2. Slave spectrometer Polychromix DTS-1700.
Spectroscopic analysis
Milk samples, diluted 1:4 with deionised water, were placed in 40 ml test tubes and heated at 40 ± 1 °C. They were scanned with the two NIR spectrometers using a quartz flow cell with an optical path of 200 m. FT-NIR spectra were acquired in transmission mode (32 scans, resolution of 8 cm-1, 3 replicates per sample) in the range 4000-10000 cm-1. Slave spectra were collected in transmission mode (100 scans, resolution of 12 nm) from 935 to 1692 nm.
The SCATTER model
The model, developed in Visual Basic for Excel and optimised for NIRFlex N-500 (Cabassi et al., 2012), calculates, given the fat concentration, the optical density produced by scattering of milk fat globules. On the basis of the Weibull distribution, the model calculates the number of globules in a defined diameter range, returning a distribution curve from which it generates a theoretical NIR spectrum. When the measured NIR spectrum is input to the model, model inversion is performed by minimising the sum of squared differences between the measured and the theoretical spectrum. At the end of the process, the new distribution curve is given. The model uses two spectral windows (1000-1360 nm and 1580-1800 nm) which are free from absorption bands and thus characterised only by scattering absorbance.
Reference particle size analysis
The size of milk fat globules was determined with a granulometer Mastersizer 2000 (Malvern Instruments Ldt., UK) equipped with a single laser source at 633 nm. The particle size distribution was calculated according to Mie theory with the "Multiple Narrow mode” model. Working parameters were chosen according to Michalski et al. (2001): water was used as dilution medium ( 1:600) to avoid multiple scattering phenomena; the refractive indices were set at 1.33 for water and at 1.458 for milk fat, the absorption coefficient for liquid fat was set to 0.5 * 10-5. In order to avoid fat crystallisation, all measurements were made at 40 ± 1 °C. Among the parameters provided by the instrument, the Sauter Mean Diameter, D [3,2], was chosen as the best descriptor of the particle size distribution.
Software
Computations were performed with MATLAB 7.0 (The MathWorks, Inc., USA) for Windows and PLS_ToolBox 4.0 (Eigenvector, USA).
Standardisation procedure
The standardisation procedure was carried out with the MATLAB function 'stdgen' which offers a choice of two methods; direct standardisation (DS), in which the whole slave spectrum is used to fit each spectral point on the master spectrum, and Piecewise Direct Standardisation (PDS), which provides a spectral window on the slave instrument to reconstruct each spectral point on the master instrument (Tan and Brown, 2001).
Results and Discussion
Spectral differences
Figure 3 shows the NIR absorbance spectra of milk samples measured with the two spectrometers. A clear difference between the two series was observed, due mainly to a shift of the signals of interest on both the wavelengths and absorbance axes, caused by differences in the working principle of each.
Figure 3. NIR absorbance spectra of milk samples measured with FT-NIR (blue) and LABPOD (red) spectrometers.
NIR2013 Proceedings, 2-7 June, La Grande-Motte, France. ST4 – Experimental Methodologies
Bellon-Maurel V., Williams P., Downey G., Eds 691
Standardisation
Spectra pretreatment: the spectrum of the empty cuvette and of water were subtracted from absorbance spectra acquired by the master instrument; wavenumbers were converted into wavelengths and the order of variables was reversed (Figure 4).
Absorbance spectra acquired with the slave instrument were pre-treated by applying moving average smoothing (segment size 7) and were corrected by subtracting the average spectrum of water. In this case, a background measurement is made using an empty cuvette, the spectrum of which is automatically subtracted by the software (Figure 5). The spectral range of the two instruments overlap only between
1000 and 1690 nm and the number of absorbance points are extremely different (1501 for the master instrument and 100 for the slave) because of the different resolution. Thus, in order to optimise the standardisation process, a MATLAB routine (called mattdiff, Figure 6) was create. 'Mattdiff' compares all wavelengths of FT-NIR with those of Polychromix, calculates their differences, in absolute value, and creates a matrix. Then the routine associates the 100 wavelengths of the two instruments whose difference is less than 1 (arbitrarily chosen value).
Selection of spectra and standardisation: when performing a standardisation process, it is possible to select samples to be included in the standardisation subset which best represent the variability of the considered parameter(Wang et al., 1991). The selection can be done on the basis of the sample leverage or on the basis of sample scores calculated from a PLS model predicting fat content. All possible combinations between the standardisation mode and the use of an extended (n = 34) or restricted (n = 5) data set, selected on the basis of the leverage or the PLS on fat content, were evaluate.
Performance of standardisation
The standardisation matrix obtained was used to transform an independent data set of 35 new slave spectra to which the SCATTER model was applied. Among all the possible combinations investigated, the best correlation between the D [3,2] parameter calculated for the master spectra and that calculated for the standardised slave spectra was obtained by applying the PDS standardisation using all 34 spectra (Figure 7). A
good correlation between the two calculations was obtained, with a coefficient of determination in independent validation R2 o f 0.867 and a SEP=0.39 indicating good spectral standardisation . As shown in Figure 8, the differences between the master and the slave spectra after the PDS procedure were considerably reduced, indicating that most of the spectral differences have been compensated for through the standardisation.
NIR2013 Proceedings, 2-7 June, La Grande-Motte, France. ST4 – Experimental Methodologies
Bellon-Maurel V., Williams P., Downey G., Eds 692
function
[MatCoppia]=mattdiff(VettA,VettB,ddiff)
%Sizing of wavelength vectors
CicloA =size(VettA);
CicloB =size(VettB);
% creation of matrix of differences between
wavelength
for i=1:CicloA(1,2);
for j=1:CicloB(1,2);
matdiff(i,j)=abs(VettA(i)-VettB(j));
end
end
% creation of matrix of wavelength minima
MinRig=min(matdiff);
MinCol=min(matdiff');
%initialization of Matpos
Matpos(1:size(MinRig,2))=0;
%creation of matrix of correlations between
wavelengths
rc3=size(MinRig);
for i=1:rc3(1,2);
if find(MinCol==MinRig(i))
if MinRig(i)<ddiff;
posmincol=find(MinCol==MinRig(i));
indc=abs(i-posmincol);
valfincol=min(find(MinCol==MinRig(i)));
if length(indc)>1
k=1;
for j=1:length(posmincol)
if find(Matpos==posmincol(j))
k=k+1;
end
end
valfincol=posmincol(k);
end
Matpos(i)=valfincol;
end
else
Matpos(i)=0;
end
end
%creation of matrix of matching position
rc4=size(Matpos);
j=0;
for i=1:rc4(1,2);
if Matpos(i)>0;
j=j+1;
MatCoppia(1,j)=i;
MatCoppia(2,j)=Matpos(i);
end
end
Figure 6. ‘Matdiff’ routine.
Figure 7. Correlation between D [3.2] calculated with the SCATTER model for master and standardised slave spectra.
Figure 8. Master (blue) and standardised slave (red) spectra.
0 1 2 3 4 5 6 7 8 0 2 4 6 8 D [3 ,2 ] sl av e ( m) D[3,2] master (m)
PDS
10000 1100 1200 1300 1400 1500 1600 0.2 0.4 0.6 0.8 1 nm A s s o rb a n z aNIR2013 Proceedings, 2-7 June, La Grande-Motte, France. ST4 – Experimental Methodologies
Bellon-Maurel V., Williams P., Downey G., Eds 693
Conclusions
After the standardisation procedure, the slave spectra could be used to measure fat globule size as could the master spectra. The good results obtained show that the size of the fat globules in milk can be determined using spectra acquired with a low cost and low resolution spectrometer, if properly standardised. The reduction of the cost of this analysis has interesting implications regarding the on-line analysis to be carried out directly in the barn.
Acknowledgements
The research was carried out within the SCATTERLAT project n° 1347 – “Evaluation of physical characteristics of the fat in milk for processing by analyzing the scattering in the near-infrared region as a function of genetics and nutrition factors” funded by Lombardy Region- (2009-2011).
References
Tan, C. and Li, M. (2007). Calibration transfer between two near-infrared spectrometers based on a wavelet packet transform. Anal. Sci., 23(2) 201-206.
Cabassi, G., Profaizer, M., Marinoni, L. and Cattaneo, T.M.P. (2012) Estimation of milk fat globule distribution in milk using scattering in the near infrared region. Proc. 15th Inter. Conf., Near Infrared Spectroscopy. Manley, M., Mc Goverin, C.M., Thomas, D.B., Downey, G. (Eds.). Cape Town, South Africa, pp 214-218.
Tan, H-W. and Brown, S. D. (2001) Wavelet hybrid direct standardization of near-infrared multivariate calibrations. J.
Chemometrics, 15(8) 647-663.
Michalski, M.C., Camier, B., Gassi, J.Y., Briard-Bion, V., Leconte, N., Famelart, M.H. and Lopez, C. (2007) Functionality of smaller vs control native milk fat globules in Emmental cheeses manufactured with adapted technologies. Food
Res. Int. 40, 191-202.
Michalski, M. C., Gassi J. Y., Famelart, M. H., Leconte, N., Camier, B., Michel, F.and Briard, V. (2003) The size of native milk fat globules affects physico-chemical and sensory properties of Camembert cheese. Lait, 83 (2) 131-143.
Wang, Y., Veltkamp, D.J. and Kowalski, B.R. (1991) Multivariate instrument standardization. Anal. Chem., 63, 2750-2756.

![Figure 7. Correlation between D [3.2] calculated with the SCATTER model for master and standardised slave spectra](https://thumb-eu.123doks.com/thumbv2/123doknet/13961675.452959/9.892.66.825.865.1107/figure-correlation-calculated-scatter-model-master-standardised-spectra.webp)
