Publisher’s version / Version de l'éditeur:
Canadian Geotechnical Journal, 15, 3, pp. 346-361, 1978-08
READ THESE TERMS AND CONDITIONS CAREFULLY BEFORE USING THIS WEBSITE.
https://nrc-publications.canada.ca/eng/copyright
Vous avez des questions? Nous pouvons vous aider. Pour communiquer directement avec un auteur, consultez la première page de la revue dans laquelle son article a été publié afin de trouver ses coordonnées. Si vous n’arrivez pas à les repérer, communiquez avec nous à [email protected].
Questions? Contact the NRC Publications Archive team at
[email protected]. If you wish to email the authors directly, please see the first page of the publication for their contact information.
NRC Publications Archive
Archives des publications du CNRC
This publication could be one of several versions: author’s original, accepted manuscript or the publisher’s version. / La version de cette publication peut être l’une des suivantes : la version prépublication de l’auteur, la version acceptée du manuscrit ou la version de l’éditeur.
Access and use of this website and the material on it are subject to the Terms and Conditions set forth at
Soil disturbance from pile driving in sensitive clay
Bozozuk, M.; Fellenius, B. H.; Samson, L.
https://publications-cnrc.canada.ca/fra/droits
L’accès à ce site Web et l’utilisation de son contenu sont assujettis aux conditions présentées dans le site LISEZ CES CONDITIONS ATTENTIVEMENT AVANT D’UTILISER CE SITE WEB.
NRC Publications Record / Notice d'Archives des publications de CNRC:
https://nrc-publications.canada.ca/eng/view/object/?id=a36d7327-588f-43ee-9fcb-bc5e2786376c https://publications-cnrc.canada.ca/fra/voir/objet/?id=a36d7327-588f-43ee-9fcb-bc5e2786376cI4
\
'21
d
National Research Conseil national
+ i 7 8 7 1 +
uncil Canada de recherches Canada- 2
.I
?,'ALYZEC)
SOIL DISTURBANCE
FROM
PILE DR
SENSITIVE CLAY
by M. J$ZOZU~, B. H. Fellenius and L. Samson
Reprinted from
Canadian Geotechnical Journal Vol. 15, No. 3, August 1978 p. 346-361
DBR Paper No. 787
Division of Building Research
Price 25 cents OTTAWA
BUILDING
RESEARCH
-
LIBRARY
-
OCT
12.
-
1978
N b T:OHN. RCSCAPCH COtlNClLSoil disturbance from pile driving in sensitive clay1
M.
Bozozu~
Division of Building Research, National Research Council of Canada, Ottawa, Ont., Canada KIA OR6
A N D
B. H. FELLENIUS AND L. SAMSON
Terratech Ltd., 275 Benjamin-Hudon Street, Montreal, P.Q., Canada H4N 1Jl Received November 7,1977
Accepted May 17,1978
Soil disturbance due to the driving of two groups of 116 concrete piles each in sensitive marine clay was studied on a construction project in eastern Canada. Pore-water pressures, heave, and lateral movement of soil and piles, and tests of strength, compressibility, and consistency limits of the soil were observed prior to and up to 3 months after pile driving whereas observations of pore-water pressures were continued for an additional 5 months. Driving of the piles had little effect on the compressibility and consistency limits of the marine clay, but the in situ shear strength and cone penetration resistance were reduced by about 15 and 30%, respectively. Soil heave within the group of piles decreased linearly with depth from a maximum of 450 mm (18 in.) at the ground surface to about zero at the pile tips, and in volume amounted to approximately 55% of the soil displaced by the piles. The vertical heave outside the pile group was confined to a horizontal distance of 12 m (39 pile diameters). During pile driving, the lateral movement of previously driven piles was as much as 175 mm (7 in.). Horizontal soil movements measured by inclinometers varied up to 125 mm (5 in.). Pore-water pressures generated duringpiling exceeded the total overburden pressure by 35-40%. The excess pore pressures dissipated in about 8 months after the piling was completed.
Le remaniement cause par le fonpage dans I'argile marine sensible de deux groupes de 116 pieux de beton a ete etudie sur un chantier de construction de 1'Est du Canada. Les pressions interstitielles, de soulevement et le mouvement lateral du sol et des pieux, de mime que les valeurs de la resistance, de lacompressibilite et des limites de consistance du sol ont ete observes avant et jusqu'a 3 mois apres le fonpage des pieux; de plus, les observations des pressions interstitielles se sont poursuivies durant 5 mois additionnels. Le fonpage des pieux n'a eu que peu d'effet sur la compressibilite et les limites de consistance de I'argile marine, mais la resistance au cisaillement en place et la resistance au c6ne ont ete reduites d'environ 15 et 30% respectivement. Le soulkvement du sol I'inttrieur du groupe de pieux diminuait linkairement en fonction de la profondeur, soit d'un maximum de 450mm (15po.) a la surface du sol jusqu'a environ zero a la pointe des pieux; en volume, ce soukvement correspondait a approximativement 55% du sol deplace par les pieux. Le soulevement vertical en dehors du groupe de pieux se limitait a une distance horizontale de 12 m, soit 39 diametres de pieux. Durant le fonpage, le mouvement lateral des pieux fonces prialablement atteignait 175 mm (7po.). Les mouvements horizontaux du sol mesurts par des inclinometres ont varie jusqu'a 125mm (5 po.). Les pressions interstitielles generees durant le fon~age ont dtpasse de 35 a 40% les valeurs des pressions isostatiques. La dissipation de I'exckdent des pressions interstitielles s'est terminCe environ 8 mois apres la fin du fonpage.
[Traduit par la revue]
Can. Geotech. J., IS, 346-361 (1978)
Introduction
Concrete or other types of piles with high soil displacements have not been used extensively to support heavy loads in sensitive marine clay soils because of the potential disturbance to the subsoils and the possible danger to adjacent structures. Fellenius and Samson (1976) reported on a pilot study conducted in 1974 on a group of thirteen 30-cm ( 12-in.) precast concrete piles driven through a sensitive marine clay which showed that the subsoils were not seriously disturbed and that
'Presented at the 30th Canadian Geotechnical Confer- ence, Saskatoon, Sask., October 5-7, 1977.
concrete piles could be safely used. In 1976, the study was extended to two large groups of 116 pre- cast concrete piles each to be driven 270 m (900 ft) from the original test site.
The objectives of the study were to: (a) evaluate the disturbance of the sensitive marine clay by measuring changes in shear strength, compres- sibility, and pore-water pressures in the soif, and to measure the extent to which the original condi- tions are recovered with time after pile driving; (b) monitor the vertical and lateral movements induced on installed piles from driving other piles within the same group; and (c) determine the zone influenced by pile driving by measuring the vertical
BOZOZUK ET AL.
0 P I L E P E N E T R O M E T E R
x V A N E b B O R E H O L E ( P I S T O N S A M P L I N G A N D S P T - T E S T )
A B O R E H O L E ( P I S T O N S A M P L I N G ) N O L E T T E R : S O I L T E S T P R I O R T O D R I V I N G L E T T E R A : I M M E D I A T E L Y A F T E R D R I V I N G L E T T E R B : T H R E E M O N T H S ' A F T E R D R I V I N G
1 FIG. 1. Location of piles, soil borings, in situ tests, and instrumentation lines.
and horizontal soil movements and the changes in pore-water pressures.
The influence of pile driving on' shear strength, water content, consistency limits, and compres- sibility of the soil was investigated by laboratory tests on piston-tube soil samples obtained prior to piling, immediately after, and 3 months after the piles were driven. Shear strength was measured using the Swedish fall cone and compressibility using standard odometer tests. The changes in
I shear strength were also measured in situ using a
field vane and static cone penetrometer.
The zone of influence due to piling was estab- lished by measuring soil heave at the surface with spiral-foot settlement gauges and at depth with
1 bellow-hose gauges. Horizontal soil. movements were measured with inclinometers installed ver-
1
tically in the ground; excess pore pressures were1
measured with hydraulic and vibrating wire piezometers.The effects of pile driving on installed piles were monitored using terrestrial photogrammetry techniques.
I
Site ConditionsThe construction site was located on the SIDBEC-DOSCO property in Contrecoeur, Que- bec, on a marine clay plain east of Montreal and
south of the St. Lawrence River. The pile project was adjacent to three existing silos supported on end-bearing steel piles. In preparation for piling the site was excavated to a depth of 2.9 m (9.5 ft) from a surface elevation of +18.2 m (+59.7 ft). Figure 1 shows the locations of the piles, the soil borings, and tests carried out at the site. A com- pilation of the engineering tests conducted on the soils in the laboratory and in the field prior to pile driving is shown on Figs. 2 and 3.
At the original ground surface, there was 1 m ( 3 ft) of sandy backfill overlying 1.9
m
( 6 ft) of brown silty clay. When the site was excavated, this material was replaced with 0.6 m ( 2 ft) of sand and gravel to provide a working surface for the field investigation and pile driving.Underlying the gravel pad to a depth of 2.3 m (7.5 ft) was a highly plastic grey silty clay stratified with uniform silt. The water content was close to the liquid limit of about 55%, the sensitivity varied from 15 to 20, and the undrained shear strength measured in the laboratory and with the field vane was about 50 kPa ( 1000 psf )
.
From 2.3 m (7.5 ft) to 15.1 m (49.5 ft) the soil consisted of grey silty clay with dark and pale bands, stratified with thin seams of uniform silt and sand. The thickness of the bands varied from 2 mm (0.1 in.) to 70 rnrn ( 3 in.). The soil was
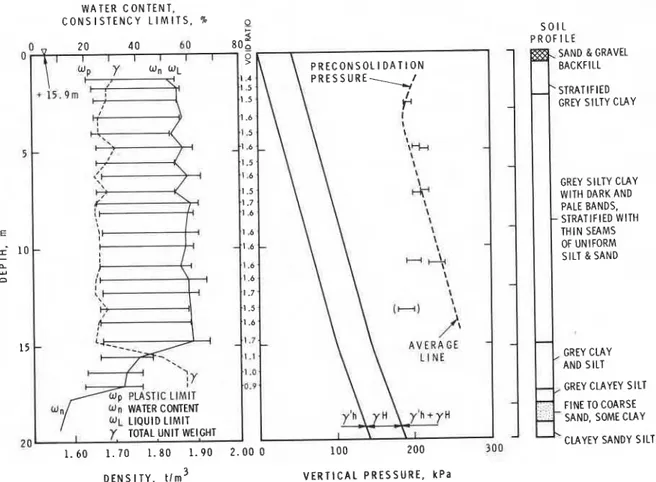
348 CAN. GEOTECH. J. VOL. 15. 1978 W A T E R C O N T E N T , C O N S I S T E N C Y L I M I T S , % Q S O I L P R O F I L E SAND &GRAVEL BACKFILL ,'STRATIFIED
GREY SILTY CLAY
GREY SILTY CLAY WlTH DARK AND PALE BANDS,
-
STRATIFIED WlTH T H I N SEAMS OF UNIFORM SILT & SAND-
GREY CLAY / AND SlLT
,
,
-
GREY CLAYEY SILT FINE TO COARSE,SAND, SOME CLAY
-C L A Y E Y SANDY SlLT D E N S I T Y , t l m 3 V E R T I C A L P R E S S U R E , k P a
FIG. 2. Variation of consistency limits and preconsolidation pressure with depth.
highly plastic with a natural water content of 6 0 % , which was close to the liquid limit. The sensitivity varied from 15 to 20. The in situ undrained shear strength measured with the vane increased linearly with depth through the soil formation from 50 kPa (1000 psf) to about 75 kPa (1600 psf). Con- solidation tests showed that it had a void ratio of about 1.6, and was overconsolidated by about 120 kPa (1.3 tsf).
From 15.1 m (49.5 ft) to 17.5 m (57.4 ft) the soil consisted of a grey clay and silt with pale and dark bands in which the natural water content decreased gradually from 40 to 35%. The liquid limits were about 6 % greater than the water con- tents. The measured shear strengths varied con- siderably. Underlying this formation was 0.6 m (2 ft) of grey clay and silt with a water content of 1 4 % , followed by 1.0 m ( 3 ft) of fine to coarse sand with some clay.
From 19.1 m (62.6 ft) to 24.4 m (80.0 ft), the soil changed to grey sandy silt with traces of gravel. N-values of 15, measured by the standard penetra- tion test (SPT), indicated a medium relative density. Between 24.4 m (80.0 ft.) and 30.5 m (100 ft),
which was the maximum depth of sampling, a very dense glacial till with boulders was encountered. This formation was selected to support the end- bearing concrete piles.
The Foundations
Each group of 116 (consisting of the de- signed 113 plus 3 replacements) standard Her- kules H800 precast concrete piles (Fellenius and Samson 1976) supported a massive reinforced concrete octagon-shaped foundation, as shown in Fig. 1, upon which was placed the iron ore storage silos 4 and 5. The hexagon-shaped piles had a
diameter of 30 cm ( 12 in.), a cross-sectional area of 800 cm2 (124 in.2) and an average length of about 26 m (85 ft). The pile spacing on centers
was generally 5-6 diameters with a
minimum
spacing between any two piles of 4.3 diameters. They were driven t o refusal in the glacial till
to
depths of 25-27 m (82-89 ft). The diameter, circumference, and area of the pile groups were 19 m (62 ft), 62 m (200 ft), and 290
m2
(3100 ft2), respectively.BOZOZUK ET AL.
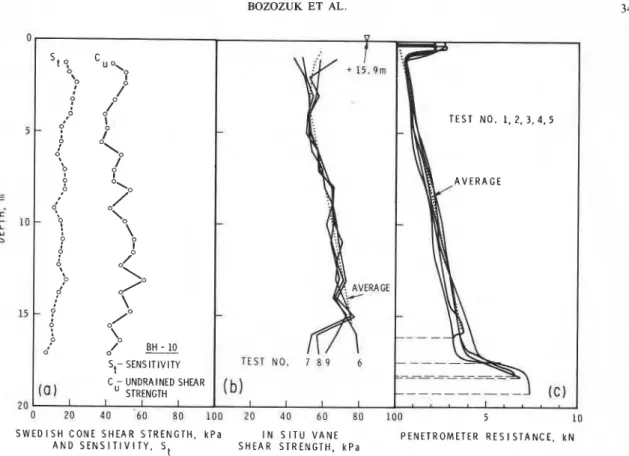
S W E D I S H C O N E S H E A R S T R E N G T H , k P a I N S l T U V A N E P E N E T R O M E T E R R E S I S T A N C E . k N A N D S E N S I T I V I T Y . S t S H E A R S T R E N G T H , k P a
FIG. 3. Variation in sensitivity, Swedish cone undrained strength, in situ vane shear strength, and cone pen- etrometer resistance with depth before pile driving.
S I L O N 0 . 5 S I L O N 0 . 4
FIG. 4. Sequence of pile driving.
completed 29 days later, on August 27. The se- was carried out to a depth of 18.1 m (59.5 ft) at quence of pile driving and the number of piles BH-10 (Fig. 1 ) with an NGI fixed piston sampler driven each day after the start of pile driving is (Bjerrum 1954), modified to take 71 mm (2.8 in.)
shown on Fig. 4. diameter cores. The sample tubes had a wall-to-
Sampling and Field Testing area ratio of 11 %. Split spoon sampling and standard penetration tests were carried out to Soil investigations at the test site began on June depths from 18.3 to 30.5 m (60 to 100 ft). Soil 24, 1975, about 5 weeks before the start of piling. sampling was repeated immediately after pile Continuous soil sampling for laboratory testing driving at location BH-1OA to a depth of 14.8 m
350 - CAN. GEOTECH. J. VOL. 15, 1978
10 5 0 5 10 15 20 rn
S O U T H 6 N O R T H
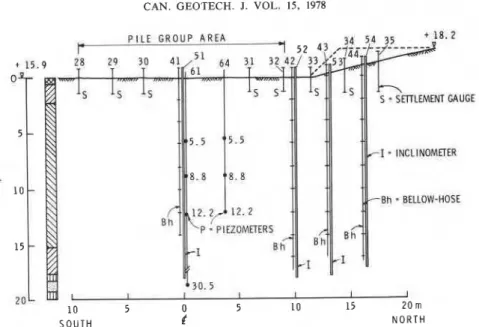
FIG. 5. Location of instrumentation along the north-south line, silo 4.
(48.6 ft) and 3 months later at BH-1OB to a depth of 14.0 m (45.9 ft). Samples from the latter borings were taken at 1-m (3.3-ft) intervals of depth midway between the piles. 'Soil samples not used for engineering tests were photographed in natural, semi-dry, and dry conditions to obtain visual evidence of soil disturbance due to pile driving.
Continuous static cone penetration tests were performed at locations 1 to 5 (Fig. 1 ) . A Nilcon cone, with a diameter of 35 mm (1.38 in.), an area of 10 cm2 (1.56 im2), and an apex angle of 45' (Sanglerat 1972) was used for the tests. This equipment permitted the separation of the end cone resistance from the total shaft resistance. The tests were repeated immediately after pile driving at locations lA, 2A, 3A, 4A, 13A, and 14A, and again 3 months later at locations 1B and 2B. These tests were conducted to depths varying from 14.2 m (46.6 ft) to 20.2 m (66.3 ft) midway between the piles.
The undrained shear strength was measured in situ using a Nilcon vane with dimensions of 65 X 130 mm (2.56 x 5.12 in.). The initial tests
were performed at locations 6 to 9 (Fig. 1 ), with tests performed every 1 m (3.3 ft) to a depth of
17 m (56 ft). The vane shear tests were repeated at locations 6A, 7A, 8A, 9A, 1 lA, and 12A imme- diately after pile driving, and 3 months later at 6B and 7B. These latter tests were also performed at intervals of 1 m (3.3. ft) to depths varying from 9 m (29.5 ft) to 17 m (55.8 ft) midway between the piles.
Field Instrumentation
Field instrumentation consisting of surface heave and bellow-hose gauges, inclinometers, and pi- ezometers was installed along the instrumentation lines running north to south, east to west, and in the northeast quadrant of silo 4 (Fig. 1 ) to measure the influence of piling originally scheduled to be driven in progression from south to north and west to east in the excavation. Some surface heave gauges were installed along a line west of silo 5. The offset distances and depths of most of the instrumentation are shown in Figs. 5 and 6.
Sixteen surface heave gauges were installed at the locations numbered 21 to 35 and 37 (Figs. 5 and 6 ) . Gauge 36 was located 46 m (150 ft) north of the piles. They consisted of bronze spiral-foot gauges (Bozozuk 1968), installed at elevation i-14.5 m ($47.6 ft), which was about 1.5 m ( 5 ft) below the floor of the excavation. These instru- ments were protected by a 7.6-cm (3-in.) diameter steel casing installed to a depth of 0.5 m (2 ft) and grouted to the soil for lateral support. Vertical movement of the spiral-foot gauges was measured by level surveys to the projecting inner rods.
In addition to the surface heave gauges, seven bellow-hose gauges specially constructed for the project were installed at the locations numbered 41 to 47 (Figs. 5 and 6 ) , to a depth of about 18 m (60 ft). They consisted of spirally-reinforced axially-flexible plastic hoses fitted internally with copper rings spaced at about 2 m ( 6 ft). They were installed in a predrilled hole and grouted in place in such a way that the hose could move
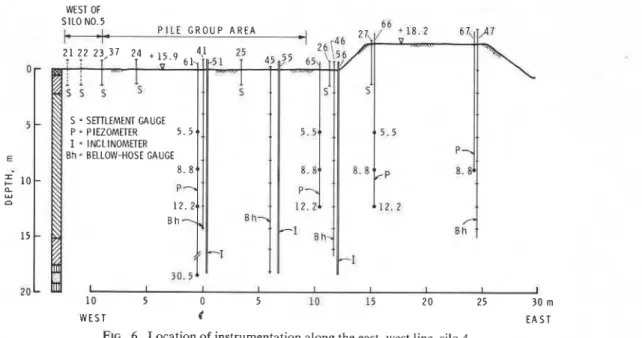
BOZOZUK ET AL. WEST OF
W E S T E A S T
FIG. 6. Location of instrumentation along the east-west line, silo 4. freely in a vertical direction along with the sur-
rounding soil. Soil movements were measured by an electric probe that gave the location of each ring with respect to the top of the casing, which in turn was surveyed relative to a bench mark. A detailed description of this gauge is given by Bozozuk and Fellenius (to be published).
Six inclinometer tubes were installed to depths I of 19 m (62 ft) to measure horizontal soil move- ments at the locations numbered 51 to 56 (Figs. 5
and 6 ) . The tubes were semi-rigid polyvinyl chloride (PVC) with an inside diameter of 38 mm (1.5 in.). A Swedish Geotechnical Institute in- clinometer probe (Fellenius 1972) was used to measure the change in inclination of the tubes in the east to west and north to south directions at every 0.33 m ( 1.08 ft) of depth.
Eleven hydraulic piezometers were installed at locations 61 to 63. These were Geonor porous bronze tips connected with the ground surface with , plastic tubing encased in steel E-drill rods. Four piezometers were installed within the pile group to depths 5.5 m (18 ft), 8.8 m (29 ft), 12.2 m (40 ft), and 30.5 m (100 ft) at location 61 (Figs. 5 and 6 ) ; four reference piezometers (location 63) were installed 46 m (150 ft) north of the pile group at the same elevations; and three (location 62) were installed in the northeast quadrant 0.6 m) (2 ft) from the pile group at depths of 5.5 m (18 ft), 8.8 m (29 ft), and 12.2 m (40 ft). Measurements were made by sounding with an electric probe until the water columns rose above
the ground surface. Bourdon pressure gauges were then attached to the piezometers to record the artesian pressures.
Eleven Geonor vibrating wire piezometers were installed at five locations (64-68). At locations 64-66 (Figs. 5 and 6 ) , they were installed at depths 5.5 m (18 ft), 8.8 m (29 ft), and 12.2 m (40 ft). One was installed at location 67 (Fig. 6 ) at a depth of 8.8 m (29 ft) and another (at loca- tion 68) at the same depth in the northeast quadrant, 3.3 m (10 ft) from the edge of the pile group.
Two bench marks consisting of steel bolts placed in the concrete foundations of silos 1 and 2 served as reference elevations for all level surveys.
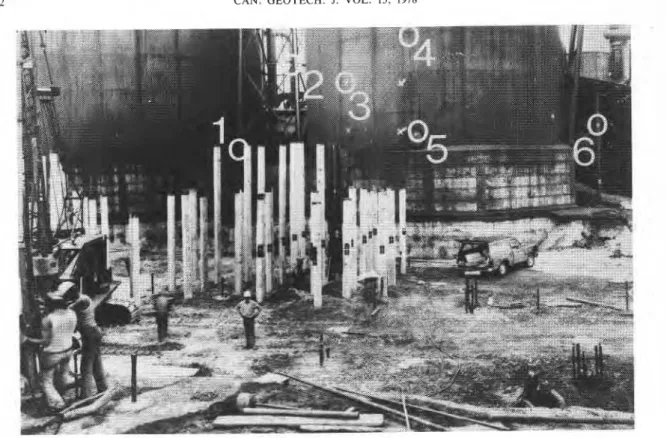
Terrestrial photogrammetry, a technique which permits dimensional measurements from stereo pairs of photographs, was used to monitor the vertical and lateral movements induced on installed piles by driving additional piles within the same group. Two steel scaffolds were erected 10 m (32.8 ft) apart, 14 m (46 ft) east of the first row of piles at silo 4, to support the cameras (Wild, P-3 1 ) 3.7 m (12 ft) above the original ground surface. This height was required in order to photograph as many piles as possible because they tended to obscure one another as they projected over 5 m (16 ft) above the floor of the excavation. Control points for the photographs consisted of bolts, well defined joints, and white crosses painted on silo 1 (Fig. 7). Targets for the measurements consisted of white crosses painted on each pile
352 CAN. GEOTECH. J. VOL. 15, 1978
FIG. 7. Control points (numbers 1 to 6 ) and targets (Photo by M. C. van Wijk, Division of Physics, NRCC.)
after it was driven. Details of this technique are given by Massarsch (1975) and Bozozuk et al.
(to be published).
Effect of Piling on Soil Properties Consistency Limits
Engineering tests for consistency limits on soil samples obtained immediately after pile driving and 3 months later were compared with the initial test results. The comparisons showed that the pile driving had no effect on water content, consistency limits, and density of the soil. Furthermore, an examination of photographs of thin vertical sec- tions of the soil (at natural water content, semi- dry, and dry conditions) sampled after the piles were driven showed no evidence of physical dis- tortion. All the soil layers were distinct and hori- zontal, as they were before any piles had been driven. It would appear, therefore, that the only effect of the pile driving was to physically displace the soil.
Preconsolidation Pressures
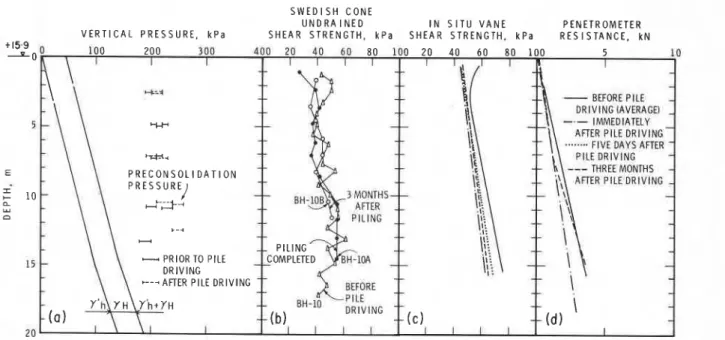
The consolidation test is a sensitive indicator of soil disturbance. Figure 8a shows a comparison of preconsolidation pressures measured on soil samples obtained after piling with the initial test
(crosses) for terrestrial photogrammetry measurements.
values. The same loading schedules were carefully maintained. As can be seen in the figure there was no difference in the results and no significant differ- ences in the compression index C,. There was, however, a slight difference in recompression index
C , ; it changed from 0.03 to 0.04 after pile driving. It would appear that driving displacement-type piles at a center-to-center spacing of 5 to 6 pile diameters causes little or no disturbance of this sensitive marine clay midway between the piles.
It is possible that the disturbance created by the release of confining pressures when soil samples are removed from the ground by tube sampling, no matter how carefully done, is far more severe than that caused by displacing the soil from driving piles. Consequently minor disturbances from the pile driving would be masked by that resulting from soil sampling.
Swedish Fall Cone Shear Strength
The results of the shear strength tests per- formed on piston-tube samples obtained before pile driving (BH-lo), at the conclusion of pile driving (BH-lOA), and 3 months after the piles were driven (BH-1OB) are plotted on Fig. 8b. Although there was a fair amount of scatter in the plotted points, a small reduction in strength due
BOZOZUK ET AL. 353 S W E D I S H C O N E
U N D R A I N E D I N S l T U V A N E P E N E T R O M E T E R V E R T I C A L P R E S S U R E , k P a S H E A R S T R E N G T H , k P a S H E A R S T R E N G T H , k P a R E S I S T A N C E , k N
FIG. 8. Effect of piling on preconsolidation pressure, Swedish cone and in situ vane shear strength, and cone penetrometer resistance.
to pile driving can be seen. This reduction was in cone resistance of about 30%, which was only more pronounced within the upper 3 m (10 f t ) , partially regained in the following 3 months. but was not very significant below that depth.
In Situ Vane Shear Strength
A series of four vane test borings was made: four before pile driving, four immediately (within 24 h) after driving, two 5 days after, and two 3 months after the piles were driven. The results from each series were averaged and are presented in Fig. 8c. Immediately after pile driving, there was an over- all reduction in shear strength of about 15%, although it was generally greater in the upper 2 m
(6 ft). There was a small regain in shear strength 5 days after the piles were driven, but 3 months later it was intermediate between the measure- ments made immediately and those made 5 days after pile driving. Considering that the vane borings were scattered around the site (Fig. 1 ), the varia- tions in the measured strengths are acceptable. It appeared, therefore, that the piling reduced the
in situ shear strength by about 15%, and that this reduction was not regained within the following 3 months.
Static Cone End Resistance
. A series of three penetrometer soundings was carried out: five before pile driving, six immediately (within 24 h) after driving, and two 3 months later. The averaged results from each series (Fig. 8d) show that the pile driving caused a reduction
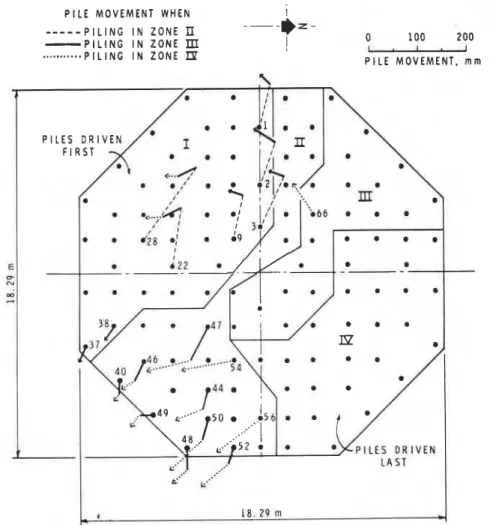
Displacement of Installed Piles Due to Pile Driving Stereo pairs of photographs were taken once a week during the pile driving operations to record any changes in the position of piles installed during the interval. In many cases the piles in the fore- ground (Fig. 7 ) obscured targets on other piles. After all the piles were driven only 30% of the total number and 18 % of those driven the previous week could be stereoscopically interpreted on the photographs. The results, plotted on Fig. 9, were considered sufficient to assess the overall pile movements.
The general direction of movement of in-place piles was approximately away from and in a direc- tion perpendicular to the area of pile driving. The magnitude of these movements can be appreciable and it varies. When the piles were driven in zone 11, those in zone I moved as much as 175 mm ( 7 in.) (dashed vector for pile 28, Fig. 9). The solid vectors indicate pile movements due to piling in zone 111; the dotted vectors due to piling in zone IV. The movements of some of the piles changed direction as the piling proceeded from one area to another. The magnitude of the movements can be obtained from the pile movement scale shown on the figure. The accuracy of the measure- ments was within 15 mm in the north-south and
354 CAN. GEOTECH. J. VOL. 15, 1978
FIG. 9. Photogrammetric measurements of horizontal pile movements due to pile driving in successive zones.
20 mm in the east-west directions (Bozozuk et al., to be published).
The photogrammetric measurements and engi- neering level surveys of the piles indicated no heave or settlement of the piles.
Horizontal Soil Movements Due to Piling Although the utmost care was taken to protect the field instrumentation during construction activities, a pile segment was accidentally dropped on inclinometer 55 (Fig. 6 ) , damaging it beyond repair. Measurements were successfully made, however, with the remaining five inclinometers.
When inclinometers are used to measure lateral soil movements, the bottom end of the casing is usually installed deep enough to provide a stable reference point for the calculations. This would have meant installing them to depths greater than the end-bearing piles. As this was not economically possible, the movements of the tops of the inclino-
meter tubes were monitored using the photogram- metric surveys, thus providing a secondary refer- ence datum for the calculations. The 'forest' of projecting piles obscured some of the inclinometer tubes from the cameras, however, and consequently, absolute horizontal soil movements were measured only at locations 52 and 54, and only relative move- ments were obtained at 51, 53, and 56. The measurements indicated that the pile driving gen- erally pushed the soil laterally away from the pile group in large blocky masses.
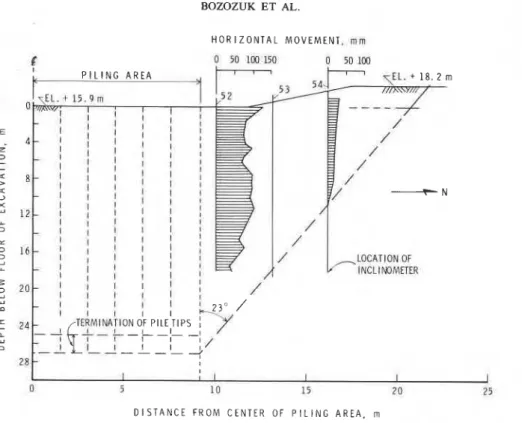
The absolute horizontal soil movements mea- sured with inclinometers 52 and 54 north of the piling area were plotted (Fig. 10). Inclinometer 52 north of the pile group moved a distance varying from 125 mm ( 5 in.) at the ground surface to 45 mm (1.8 in.) at a depth of 18 m (59 ft). At inclinometer 54, 7 m (23 ft) north of the pile group, outward lateral movements occurred to a depth of 10.7 m (35 ft) below the floor of the
BOZOZUK ET AL.
D I S T A N C E F R O M C E N T E R O F P I L I N G A R E A , rn
FIG. 10. Horizontal soil movements north of piling area.
excavation. A straight line connecting the tip of the pile group with this point defined an angle of 23' from the vertical. This line also passed through the tip of inclinometer 53, indicating that it could have been affected by lateral soil movements caused by driving the piles.
Extending the straight line upwards, it inter- sected the level of the excavation at a distance of 1 1.5 m (38 ft) from the edge of the pile group. If this line defined the actual limits of horizontal soil movements due to pile driving, it should correlate with the outer limits of vertical soil heave.
Soil Heave Due to Pile Driving
Vertical soil heave was measured along two orthogonal lines through silo 4 using spiral-foot and bellow-hose gauges. The spiral-foot gauges provided measurements at a depth of 1.5 rn
( 5 fi)
below the floor of the excavation. Surveys on the protective casing Iocated within the pile group indicated that on the average the soil heaved
an
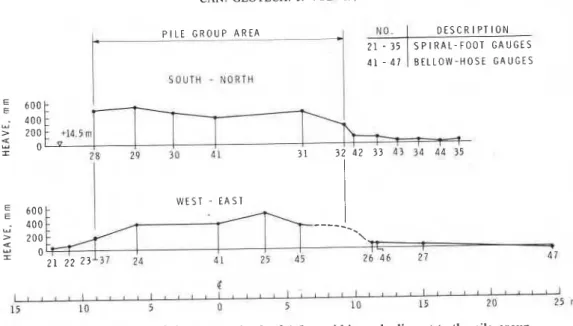
ad- ditional 50 mm ( 2 in.) above this depth. The results of the measurements within and outside the pile group including those from the bellow-hose gauges were plotted for the south to north and west to east sections on Fig. 11. The average maximum heave at a depth of 1.5 m (5 ft) within the group was about 400 mm (16 in.). Outside the groupthe heave diminished rapidly reducing to zero at a distance of about 12 m (39 ft) from the piles.
The variation of soil heave with depth was mea- sured with bellow-hose gauges. During their instal- lation, gauge 41 was grouted with a pure bentonite grout which proved to be too soft. Subsequently 20% cement was added to the bentonite grout for the remaining gauges (Bozozuk and Fellenius, to be published).
During the pile driving, lateral squeezing of the soil within the pile group tilted some of the bellow- hose measuring rings which prevented observations below the location of the tilt. It also increased the error of the measurements to about a 8 mm.
The measured distributions of heave with depth at the end of pile driving were plotted on Fig. 12. Gauge 41, at the center of the pile group, provided questionable data below a depth of 8 m. Gauge 45, however, showed that the heave decreased with depth inside the pile group from 350 mm (13 in.) near the surface to about 190 mm (7.5 in.) at a depth of 18 m (60 ft). An average straight line through the curve would show about zero heave at the depth of the pile tips. Similarly, gauges 42, 43, and 46, located outside the group of piles, showed decreasing heave with depth. Gauge 47, located 15 m (50 ft) from the group, showed negligible vertical soil movements, indicating that
335 CAN. GEOTECH. J . VOL. 15, 1978 P I L E G R O U P A R E A NO- D E S C R I P T I O N
1
2 1 - 35I
S P I R A L - F O O T G A U G E S 4 1 - 4 71
B E L L O W - H O S E G A U G E S S O U T H-
N O R T H W E S T - E A S TI
----
-_
-\ I 25 45 26 4 6 2 7 47 d I ~ J ~ ~ ~ ~ I ~ ~ I ~ ~ ~ ~ ~ ~ ~ I I ~ I I I ~ ~ ~ ~ ~ ~ ~ ~ ~ ~ ~ ~ ~ ~ ~ ~ ~ 15 10 5 0 5 10 15 20 25 rnFIG. 1 1 . Vertical soil heave at a depth of 1.5 m within and adjacent to the pile group.
H E A V E A L O N G N O R T H - S O U T H L I N E , r n m
+2r
H E A V E A L O N G E A S T - W E S T L I N E , mrn- . 5 0 5 0 150 250 350 I 1 1 1 1 1 1 4 7 ; / ,(:-
4 6 G A U G E N O .w
45FIG. 12. Heave measured with bellow-hose gauges.
the soil was unaffected by the pile driving at this distance.
Assuming that vertical soil heave with depth was symmetrical about the center of the pile group, the bellow-hose measurements were used to pre- pare contours of vertical heave (equiheave lines) (Fig. 13). The maximum gradient occurred near the edge of the group of piles. The contours were essentially parallel and approximately vertical just outside the group. Zero vertical heave occurred near the ground surface 12 m (39 ft) from the edge of the piles, and 7 m (23 ft) from the edge of the piles at a depth of 12 m (39 ft). Considering the accuracy of these measurements, this contour compared extremely well with the limits of horizon- tal soil movements shown earlier.
This agreement was further checked by plotting the measured vertical heave at the ground surface
with distance from the group of piles (Fig. 14), and calculating the ratio of the volume of soil heaved to the volume of installed piles. Within the pile group, the average soil heave was 450 mm (18 in.), giving a heaving volume
of
130 ma.The
volume of 11 6 piles, installed to
an
average depth of 26m,
was 234 ma. Therefore the ratio of the soil displaced within the group was 55% of the pile volume. The average soil heave outside the pile group to a distance of 3 m was 110 mm. Including this volume, the volume of soil now displaced to the volume of piles increased to 65%. Including the soil heaved to a distance of 12 m from the piles, the volume displaced increased to over 80%. For the assumption made, this was an excellent check on the field observations and implied that the volume change due to consolidation was minimal. The measurements of the spiral-foot and bellow-BOZOZUK ET AL. E L . + 18. 2 r L - - L - - - t P I L I N G A R E A / a- / . B E L L O W - H O S E
T
- - - D I S T A N C E F R O M C E N T E R O F P I L I N G A R E A , mFro. 13. Contours of vertical soil heave due to piling.
hose gauges were continued for 3-4 weeks after the pile driving, showing that the ground within the pile group settled an average of 5 mm (0.25 in.). Because of the construction activities that followed, further settlement surveys were not pos- sible and no correlations with pore pressure dis- sipation were made.
Effect of Pile Driving on Pore-water Pressures Of the 22 piezometers installed at eight locations, the piezometers at station 68, and the deep one at station 61 (30.5-m (100-ft) depth) were destroyed during construction. Later, when the formwork for the silo foundations was constructed, the piezo- meters remaining at stations 61 and 62 had to be abandoned. Stations 62 and 68 were located out- side the pile group along the northeast line (Fig. 1 ); 61 was located at the center (Fig. 5 ) ; and 63 at 46 m ( 150 ft) north of the pile group.
Essentially all the piezometers reacted to the pile driving. Piezometers at stations 61 and 64 (located within the group of piles) measured com- parable pore-water pressures, registering a maxi- mum of about 150% over the initial conditions at a depth of 8.8 m (29 ft). For the same elevation, piezometer stations 62 and 65 (located just outside the pile group) indicated an increase in pore-water
pressure of 100%. Pore pressures continued to decrease with distance from the piles, reducing to about 50% at 6 m (20 ft) at station 66 and about 25% at 15 m (50 ft) at station 67. The increase of 25% represented a small excess pore-water pressure of 20 kPa or 2 m (6.6 ft) head of water. The development of excess pore-water pressures as the piles were driven is illustrated on Fig. 15, which shows the pore pressure records for station 65, 1.3 m east of the piling area. The diagram is a composite of measured pore pressures, distance from the piezometer that each pile was driven, and the days that the piles were installed. Forty-four piles were installed in the first 3 days in the areas shown on Fig. 4, 11-29 m (36-95 ft) from the piezometers. They generated the small increases in pore pressure measured at depths of 5.5, 8.8, and 12.2 m ( 18, 29, and 40 ft). Pore pressures con- tinued to increase as the number of piles increased and the distance to the piezometers decreased. At day 13, a peak pore pressure was recorded at a depth of 12.2 m, just after 9 piles had been driven at a distance of 1-6 m (3-20 ft). Pore pressures subsequenlly decreased as the piling distance in- creased and the number of piles driven decreased. On day 27, the piezometers again reacted strongly when 12 piles were installed at a distance of 1-8 m (3-26 ft).
358 CAN. GEOTECH. J. VOL 15, 1978 600 5 0 0 4 0 0 E E I l l l l l l l l l l ~ l l ~ ~ 4
-
--
-
4-
-
4 4 d 3 0 0-
>-
d I W I T H I N G R O U P OF P I L E S-
O U T S I D E G R O U P O F P I L E S 100-
* . : s L L O W - H O S E ., -SPI RAL F O O T G A U G E S 0 I I I I I I " i ! ! l l I 0 2 4 h 8 10 1 2 I d 1 6 D I S T A N C E F R O M P I L E S , mFIG. 14. Relation between heave of ground surface and distance from group of piles.
300 I I I I I I P l E Z O M E T E R 6 4 W I T H I N P l L E G R O U P . 3.8m N O R T H O F f
-
a 2 0 0 ----___
I P l E Z O M E T E R 65 1.3m E A S T OF P l L E G R O U P 0 E - - - I ' 4 ' - - . I- .
!
!: --
-.
.,.
* . ? *-
3 0 [I u l l l l l l - l I 1 l l l . l l - l l l I 1 l l l l l l ' r---rL---
-
n 10 2 0 3 o T I M E , d a y sFIG. 15. Pore pressures at piezometer station 65, during P l E Z O M E T E R 6 6 6rn E A S T OF P l L E G R O U P
pile driving.
The variations of pore water pressures measured at stations 64 (within the pile group), 65 (1.3 m east of pile group), and 66 ( 6 m east of pile group) over a period of 300 days from the start of pile driving are shown on Fig. 16. The excess pore
pressures generated during the pile driving dis- 5 o 1 0 0 1 5 0 2 0 0 2 5 0 300
sipated relatively rapidly during the first month
after the piling was completed. The rate then de- T I M E , d a y s
creased, becoming approximately linear with time.
BOZOZUK ET AL. 359
P R E S S U R E , k P a
FIG. 17. Comparison of observed pore pressure profiles with the original total overburden and pore-water pres- sures at three locations.
were constructed, which involved backfilling the site. This increase in load was responsible for the slight rise in pore-water pressures observed over this period.
The maximum pore-water pressures observed at these piezometer locations are compared with the total overburden pressures on Fig. 17. The original pore pressures and overburden pressures are illus- trated as solid and dashed lines, respectively. The maximum pore-water pressures and those measured at 7, 30, 60, 90, 120, 180, and 240 days after pile driving are also shown. The figures showed that the generated pore pressures exceeded the original total overburden stress at all three locations by as much as 35-40%. As already mentioned, the piezometer at station 67 did not show an appre- ciable increase in pore pressure. Thus the pore-water pressures generated by driving the piles exceeded the total overburden pressure for a distance greater than 6 m (20 pile diameters) and less than 15 m (50 pile diameters) from the edge of the pile group.
This figure also shows that the excess pore-water pressures dissipated to the total overburden pres- sure in 60-90 days after the piles were driven. Complete dissipation to the original pore pressure conditions required about 8 months.
been driven at a pile spacing of generally 5-6 diameters center-to-center) indicated no significant changes in water content, consistency limits, or preconsolidation pressure of the soil. Furthermore, no physical distortion of the soil formations was observed. Results of a study on a group of 13 similar piles driven in the same soil at a spacing of 4.0 diameters center-to-center (Fellenius and Samson 1976) provided similar conclusions with respect to water content and consistency limits. There was, in addition, a small reduction in pre- consolidation pressure and some physical distortion of the soil formations. It appears, therefore, that a minimum pile spacing of 5 diameters, center-to- center, is required to avoid significant disturbance of the soil midway between them, due to driving groups of displacement piles in sensitive marine clay.
Shear Strength
The pile driving reduced the in situ vane shear strength of the soil within the pile group by about 15% and the cone penetration resistance by 30%. These were partially regained within 3 months after pile driving. The findings were consistent with the observations from the 13 pile group (Fellenius and Samson 1976).
Soil and Pile Movements
Discussion The average ground heave within the group of
Soil Study 11 6 piles was 450 mm ( 18 in.), which was con-
Engineering soil tests performed on thin-walled siderably greater than the 70 mm ( 3 in.) reported piston-tube samples (obtained after 116 piles had for the smaller group of 13 piles, which were driven
360 CAN. GEOTECH. J. VOL. 15, 1978
when the ground was frozen (Fellenius and Samson 1976). Outside the 116 pile group, the heave de- creased to an average of 110 mm (4.3 in.) at a distance of 3 m (10 ft), then gradually diminished to zero at a distance of 11 m (36 ft). The heave within the large group of piles represented 55% of the pile volume; it exceeded 80% for the whole area affected.
Horizontal soil movements accompanied the vertical heave. At the edge of the pile group the horizontal soil movements were 125 mm (5 in.) at the ground surface in a direction away from the piles. The movements decreased with distance be- coming zero at 12 m (39 ft), correlating well with the heave measurements. Combining the observa- tions, the limits within which vertical and horizon- tal soil movements took place were defined by a plane represented by a straight line starting from the tip of the piles inclined at a slope of 23' from the vertical.
The photogrammetric measurements indicated that driving piles adjacent to those already in the ground caused them to move laterally as much as 175 mm ( 7 in.). Engineering specifications gen- erally call for positioning piles within a maximum horizontal deviation of 75 mm ( 3 in.) from their designed locations. The measurements clearly show that for a large group of displacement piles in sensitive clay, lateral movements of piles can be expected to be greater than generally specified in present building codes.
In summary, the observations showed that sub- stantial soil movements occurred within and ad- jacent to the large group of piles. Appreciable soil movements occurred to a distance of 15 pile diameters, and became negligible at about 39 pile diameters from the pile group. These values were about double those observed for a smaller 13 pile group (Fellenius and Samson 1976). For structures that can tolerate or resist some soil movements, however, this information can serve as a useful guide for selecting or specifying a horizontal clear- ance distance for driving groups of displacement piles in sensitive marine clay.
Pore Pressures
Distribution of the excess pore-water pressures was generally parallel to the total overburden pres- sure at the site. They exceeded the total overburden pressure by about 30-40% within the pile group and beyond to a distance of more than 20 pile diameters. The excess pore pressures at a distance of 50 pile diameters were negligible. These pore pressures dissipated fully about 8 months after the
piles were driven as compared to the 5 months observed for the 13 pile group in the same soil
(Fellenius and Samson 1976).
The maximum excess pore pressures generated near the surface of piles driven in normally con- solidated clay can be estimated from the equation given by Lo and Stermac (1965) :
AUm = [ ( I - KO)
+
(aU/P),,,I Po'where KO = coefficient of earth pressure at rest,
Po' = effective overburden pressure, P = consolida- tion pressure used in consolidated undrained triaxial strength test with pore pressure measure- ments, and ( a U / P ) , , = maximum pore pressure ratio obtained from the test.
For the soils at the test site, Blanchet (1976) found that the pore pressure ratio became constant when the consolidation pressure used in the test was the preconsolidation pressure PC' of the soil. He obtained a maximum pore pressure ratio of 0.70 for the marine clay.
Blanchet (1976) proposed the following equa- tion :
where KO = ( 1 - sin +')Rot (Meyerhof 1976), RO = overconsolidation ratio of the soil, and
4' = angle of internal friction (28-29' for the soil).
Applying these relations to the soil within the large group of piles, the estimated maximum ex- cess pore-water pressures at depths 5.5 m (18 ft), 8.8 m (29 ft), and 12.2 m (40 ft) are 130, 180, and 225 kPa (1.4, 1.9, and 2.3 tsf), respec- tively. The predicted total pore-water pressures
( U
+
AU,) of 175, 260, and 330 kPa (1.8, 2.7, and 3.4 tsf), respectively, are plotted on Fig. 17a. The predicted pore-water pressures were con- siderably over the observed values. Part of this discrepancy may be due to the fact that pore pres- sure measurements were made between the piles whereas the predictions apply at the pile surface. Good agreement would have been obtained if a maximum pore pressure ratio of 0.5 had been used instead of 0.7. It is evident that further studies on this problem are warranted.Conclusions
1. Driving groups of displacement piles in sensi- tive clays at a minimum center-to-center pile spacing of 5 diameters has little effect on the soil mass between the piles, except in the annular zone around each pile where it is known that the clay is highly disturbed.
BOZOZUK ET AL. 361
2. Pile driving reduced the in situ vane shear strength by 15%, and the cone penetration resis- tance by 30%. The lost strength and penetration resistauce were partially recovered in the 3-month period following pile driving.
3. Photogrammetric measurements showed that in-place piles were pushed laterally as much as 175 mm (7 in.) after additional piles were driven in the group.
4. Vertical soil heave within the pile group amounted to 450 mm (18 in.) or 55% of the soil volume displaced by the piles. The heave decreased rapidly with distance from the pile group.
5. The vertical 'and horizontal soil movements outside the pile group occurred within a cone- shaped volume of soil with its apex at the tip of the piles and its surface inclined 23' away from the pile group. The cone intersected the ground surface about 40 pile diameters from the pile group. Over 80% of the total volume of soil dis- placed by the piles was accounted for within the outer limits of the cone.
6. The maximum pore-water pressures measured after pile driving within the group, and 6 m (20 ft) or 20 pile diameters from the group, exceeded the total overburden pressures by 35-40%. The ver- tical distributions of the pore-water pressures were essentially parallel to the overburden pressures. The influence of pile driving on the pore pressures at 15 m (50 ft) or 50 pile diameters from the group of piles was very small as the pore pressure increase was small.
7. The generated excess pore-water pressures had dissipated completely 8 months after the pile driving.
8. The predicted maximum pore-water pressures that apply at the surface of the pile greatly ex- ceeded the values measured in the field between the piles. Further studies are required to improve pre- diction methods.
Acknowledgements
The authors wish to thank the following agencies
whose interest and support made this research project possible and ensured its success: SIDBEC- DOSCO, Contrecoeur, allowed the measurements to be carried out during their regular construction operations and Franki Canada Ltd., Montreal, participated fully in the field work. Financial sup- port was provided by the Department of Supply and Services, Science Procurement Branch, Ottawa, Contract No. OSR4-0135.
This paper, prepared jointly by Terratech Ltd. and the Division of Building Research, National Research Council of Canada, is published with the approval of the directors of these organizations.
BLANCHET, R. 1976. Contribution au developpement de la tech- nique des pieux flottants foncts dans I'argile sensible. M.Sc. thesis, Laval University, Quebec, P.Q.
BJERRUM, L. 1954. Geotechnical properties of Norwegian marine clays. Geotechnique, 4(2), pp. 49-69.
B o z o z u ~ , M. 1968. Spiral foot settlement gauge. Canadian Geotechnical Journal, 5, pp. 123-125.
B o z o z u ~ , M., and FELLENIUS, B. H. TO be pubiished. The bellow-hose settlement gauge.
B o z o z u ~ , M., VAN WIJK, M. C., and FELLENIUS, B. H. TO be published. Terrestrial photogrammetry for measuring pile movements.
FELLENIUS, B. H. 1972. Bending of piles determined by in- clinometer measurements. Canadian Geotechnical Journal, 9, pp. 25-32.
FELLENIUS, B. H., and SAMSON, L. 1976. Testingof drivability of concrete piles and disturbance to sensitive clay. Canadian Geotechnical Journal, 13, pp. 139-160.
Lo, K. Y., and STERMAC, A. G. 1965. Induced pore pressures during pile driving operations. Proceedings, 6th International Conference on.Soil Mechanics and Foundation Engineering, Montreal, P.Q., Vol. 2. pp. 285-289.
MASSARSCH, K. R. 1975. Deformationsmatningar vid slagning av palar. Resultat av stereofotogrammetriska matningar. (Measurements. of movements from pile driving near a masonry wall. Results of stereophotogrammetric measure- ments.) Royal Swedish Academy of Engineering Sciences, Commission on Pile Research, Report No. 49. 47 p. Stock- holm, Sweden. (In Swedish.)
MEYERHOF, G. G. 1976. Bearing capacity and settlement of pile foundations. 11th Terzaghi lecture. ASCE Journal of the Geotechnical Engineering Division, 102(GT3), pp. 197-228. SANGLERAT, G. 1972. The penetrometer and soil explorations.