1
Capacity Management Schemes for Dual Cabin Aircraft: Airline Revenue
Management Insights
by
Germán Escovar Álvarez
B.S. Industrial Engineering
Universidad de los Andes, Colombia (2007)
Submitted to the Department of Civil and Environmental Engineering in partial Fulfillment of the Requirements for the Degree of
MASTER OF SCIENCE IN TRANSPORTATION at the
MASSACHUSETTS INSTITUTE OF TECHNOLOGY June 2016
© 2016 Massachusetts Institute of Technology. All rights reserved.
Author……….. Department of Civil and Environmental Engineering May 13, 2016
Certified by………... Peter P. Belobaba Principal Research Scientist of Aeronautics and Astronautics Thesis Supervisor
Accepted by……….. Heidi Nepf Donald and Martha Harleman Professor of Civil and Environmental Engineering Chair, Graduate Program Committee
3
Capacity Management Schemes for Dual Cabin Aircraft: Airline Revenue
Management Insights
by
Germán Escovar Álvarez
Submitted to the Department of Civil and Environmental Engineering on May 13, 2016, in Partial Fulfillment of the Requirements for the Degree of
Master of Science in Transportation
Abstract
The selection of an aircraft type has long term effects on the competitive position of the airline. In a market that is continuously evolving, such as the commercial aviation industry, any degree of flexibility for adjusting an aircraft capacity to match better the demand provides an opportunity for airlines to remain profitable when conditions have changed.
This thesis focuses on airlines operating dual cabin aircraft (premium and economy cabins) and explores two alternatives that can be used to adjust the capacity made available to maximize revenues. On the one hand, an easily implementable strategy of premium cabin capacity sharing is proposed with the intention of allowing passengers booking in economy fare classes to be accommodated in premium cabin seats when these seats are expected to be empty. On the other hand, a medium to long-term solution of changing the aircraft configuration (through aircraft replacement or retrofit) is considered. Both alternatives are tested using simulation tools that incorporate revenue management concepts and passenger decision making.
Four heuristics are developed and tested to evaluate premium cabin capacity sharing. Based on the simulations, it is found that the methodologies proposed can generate total revenue gains of up to 1.1%. Nevertheless, two caveats are identified: first, losses in the revenue captured from premium fare classes are likely to be experienced due to displacement by economy fare class passengers. Second, premium cabin capacity sharing should only be implemented in the final stages of the booking process; otherwise, the sharing heuristics could result in revenue losses for the airline. With respect to cabin configuration analysis, an analytical model based on the Boeing-Swan Spill Model (BSM) is applied to dual cabin aircraft and is used to estimate the impacts on revenue due to a change in configuration. These results are compared to the results of the simulations and it is found that the BSM is able to predict in most cases whether the configuration change will generate revenue gains or losses for the airline. However, estimates of the dual cabin BSM ignore the interaction between passengers of both cabins, leading to incorrect estimates of load factors and average revenue values of spilled or accommodated passengers.
Thesis Supervisor: Peter P. Belobaba
5
Acknowledgments
I would like to express my gratitude to Professor Peter Belobaba for his guidance, advice and support over the last two years. It was a privilege to learn, work, and exchange ideas with an expert in the field. His emphasis on time management (and deadlines!) and his dedication of time were key elements for the success of this thesis. Moreover, his decision of offering me a Research Assistantship that allowed funding my studies was essential to make my MIT experience possible. I would also like to thank Craig Hopperstad not only for his help developing the PODS capabilities required for my thesis but also for his responsiveness, patience and good attitude.
I thank Mr. Bockelie (Adam), Mr. Bachwich (Alex), Salz (Alex), Daniel George Ambrose, Monsieur de Vergnes (Matthieu), Mr. Wittman (Mike) and Mr. Petraru (Oren) for being a great team to work with. They made it easier for me to survive the PODS conferences and helped to make our trips to Montreal, Atlanta, Houston and Dallas enjoyable. It was also great that we were able to keep our lab working 24/7 (as an airline!) by combining our “shifts”. In addition, I would like to thank my MST friends Javier, Alice, Nate, Katie, Ryota (Tommy) and Patton for the great moments I have shared with them.
Finally, I thank my parents, my girlfriend and my family for their unconditional love and support throughout these years.
7
Table of Contents
1. Introduction ... 15
1.1 Differential Pricing and Revenue Management ... 15
1.2 Fleet Planning and Aircraft Configuration Process ... 17
1.3 Motivation for Research ... 21
1.4 Thesis Outline ... 23
2. Literature Review ... 24
2.1 Revenue Management ... 24
2.2 Multiple Cabin Revenue Management ... 26
2.3 Spill Estimation and Impacts on Fleet Assignment ... 29
2.4 Summary ... 33
3. Methodology ... 34
3.1 Passenger Origin Destination Simulator (PODS) ... 34
3.2 Network V1 ... 41
3.3 Baseline Scenarios ... 48
3.4 Cabin Configuration Analysis ... 51
3.5 Premium Cabin Capacity Sharing Mechanisms ... 57
3.6 Summary ... 63
4. Cabin Configuration Analysis ... 64
4.1 Aircraft Types and Configuration Descriptions ... 64
4.2 Analytical Method for Evaluating Configuration Changes ... 68
4.3 Simulations ... 77
4.4 Differences between Analytical Model and Simulations ... 87
4.5 Summary ... 105
5. Premium Cabin Capacity Sharing Schemes ... 107
5.1 Leg-based RM Premium Cabin Capacity Sharing Schemes ... 107
5.2 OD-Control RM Premium Cabin Shared Capacity Schemes ... 123
5.3 Summary ... 163
6. Conclusions... 166
6.1 Dual Cabin Aircraft Capacity Management ... 166
8
6.3 Insights from Premium Cabin Capacity Sharing... 168 6.4 Suggestions for Future Research ... 172
9
List of Figures
Figure 1-1: Major US airline Boeing 767 and Boeing 777 seats by aircraft ... 18
Figure 1-2: Factors considered in the evaluation of aircraft cabin configurations ... 21
Figure 3-1: PODS Architecture ... 35
Figure 3-2: Demand Arrival by Passenger Type ... 36
Figure 3-3: EMSR curve and booking limits ... 39
Figure 3-4: ProBP Algorithm ... 40
Figure 3-5: Airline 1 Route Map. Source: Belobaba, 2010. ... 42
Figure 3-6: Airline 2 Route Map. Source: Belobaba, 2010. ... 43
Figure 3-7: Airline 3 Route Map. Source: Belobaba, 2010. ... 43
Figure 3-8: Airline 4 Route Map. Source: Belobaba, 2010. ... 44
Figure 3-9: Airline passenger share by cabin and product – Leg-based RM Medium Demand Baseline ... 50
Figure 3-10: Airline revenue share by cabin and product– Leg RM Control Medium Demand Baseline... 51
Figure 3-11: Alternate configurations for baseline configuration PC 20 – EC 150 ... 53
Figure 3-12: Alternate configurations for baseline configuration PC 30 – EC 250 ... 54
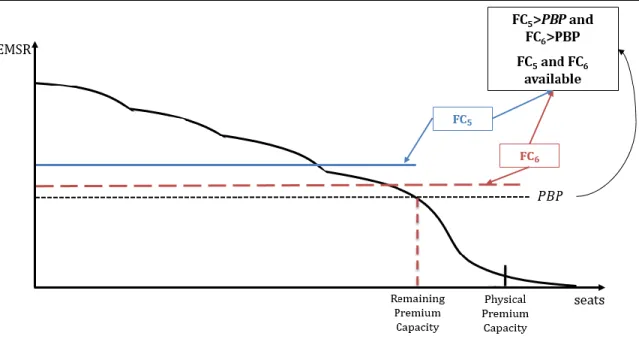
Figure 3-13: Full EMSR shared capacity ... 59
Figure 3-14: Premium cabin bid price control for a single leg itinerary ... 62
Figure 4-1: BSM Model - Total Revenue Proportional Variation – Aircraft Type A - Leg-RM... 71
Figure 4-2: BSM Model – Proportional Variation Revenue on legs operated by A/C Type A - Leg-RM ... 72
Figure 4-3: BSM Model - Proportional Variation Revenue on legs operated by A/C Type A – OD-Control ... 73
Figure 4-4: BSM Model – Proportional Variation Revenue in legs operated by A/C Type B – Leg-RM ... 74
Figure 4-5: BSM Model - Absolute Revenue Variations by Leg Category - Aircraft Type B - Leg-RM 75 Figure 4-6: BSM Model – Proportional Variation Revenue on legs operated by A/C Type B - OD-control ... 75
Figure 4-7: BSM Model – Proportional Variation Revenue in legs operated by A/C Type C - Leg-RM ... 76
Figure 4-8: BSM Model – Proportional Variation Revenue in legs operated by A/C Type C - OD-control ... 77
Figure 4-9: PODS - Total Revenue Proportional Variation – Aircraft Type A - Leg-control ... 78
Figure 4-10: PODS - Proportional Revenue Variation by set of legs – Aircraft Type A – Leg Control 79 Figure 4-11: PODS - Absolute Revenue Variation by set of legs – Aircraft Type A – Leg Control ... 80
Figure 4-12: PODS - Proportional Revenue Variation by set of legs – Aircraft Type A – OD-Control 81 Figure 4-13: PODS - Absolute Revenue Variation by set of legs – Aircraft Type A – OD Control ... 81
Figure 4-14: PODS - Proportional Revenue Variation by set of legs – Aircraft Type B – Leg Control 82 Figure 4-15: PODS - Absolute Revenue Variation by set of legs – Aircraft Type B – Leg Control ... 83 Figure 4-16: PODS - Proportional Revenue Variation by set of legs – Aircraft Type B – OD-Control 84
10
Figure 4-17: PODS - Proportional Revenue Variation by set of legs – Aircraft Type C – Leg Control 85 Figure 4-18: PODS - Proportional Revenue Variation by set of legs – Aircraft Type C – OD Control . 86 Figure 4-19: Passenger Loads by Fare Class in the Baseline – Legs Operated by Aircraft Type A - Leg
Control - Medium Demand ... 88
Figure 4-20: Revenue by Fare Class in the Baseline – Legs Operated by Aircraft Type A - Leg Control - Medium Demand ... 89
Figure 4-21: Absolute Variation of Passenger Loads by Fare Class – Legs Operated by Aircraft Type A - Leg Control - Medium Demand ... 90
Figure 4-22: Absolute Variation of Revenue by Fare Class – Legs Operated by Aircraft Type A - Leg Control - Medium Demand ... 91
Figure 4-23: Passenger Loads by Fare Class in the Baseline – Legs Operated by Aircraft Type C - Leg Control - Medium Demand ... 93
Figure 4-24: Revenue by Fare Class in the Baseline – Legs Operated by Aircraft Type C - Leg Control - Medium Demand ... 93
Figure 4-25: Absolute Variation of Passenger Loads by Fare Class – Legs Operated by Aircraft Type C - Leg Control - Medium Demand ... 95
Figure 4-26: Absolute Variation of Revenue by Fare Class – Legs Operated by Aircraft Type C - Leg Control - Medium Demand ... 95
Figure 4-27: Leg Load Factor Estimation for aircraft type A in Configuration 126-28 – Leg Control 99 Figure 4-28: Load Factor differences between BSM and PODS - Aircraft type A in Configuration 138-24 – Leg-based RM ... 100
Figure 4-29: Leg Load Factor Estimation for aircraft type A in Configuration 174-12 – Leg Control ... 101
Figure 4-30: Load Factor differences between BSM and PODS - Aircraft type C in Configuration 218-42 – Leg Control ... 102
Figure 4-31: Load Factor differences between BSM and PODS - Aircraft type A in Configuration 282-18 – Leg Control ... 102
Figure 4-32: Average of the difference in percentage points – Aircraft Type A ... 103
Figure 4-33: Average of the difference in percentage points – Aircraft Type B ... 104
Figure 4-34: Average of the difference in percentage points – Aircraft Type C ... 104
Figure 5-1: Full EMSR- Total Revenue Proportional Variation by Airline ... 108
Figure 5-2: Full EMSR - Proportional Revenue Gains by Fare Class Type ... 109
Figure 5-3: Full EMSR - Absolute Revenue Variations by Fare Class Type ... 110
Figure 5-4: Full EMSR - Absolute Revenue Variation by Fare Class Type and Cabin Accommodation ... 111
Figure 5-5: Full EMSR - Revenue Variation by Fare Class and Demand Level ... 112
Figure 5-6: Closure Rate Fare Class 1 – Time Frames 11 to 16 ... 114
Figure 5-7: Closure Rate Fare Class 5 – Time Frames 11 to 16 ... 115
Figure 5-8: Closure Rate Fare Class 10 – Time Frames 1 to 8 ... 115
Figure 5-9: Time Frame Protection – Full EMSR – Low Demand ... 117
Figure 5-10: Time Frame Protection - Full EMSR - Medium Demand ... 118
11
Figure 5-12: Full EMSR with TFP - Absolute Revenue Gains by Fare Class Type – Medium Demand
... 119
Figure 5-13: Full EMSR - Absolute Revenue Variation by FC Type, Cabin Accommodation and TFP – Medium Demand ... 120
Figure 5-14: Absolute revenue variations by fare class – Full EMSR with TFP – Medium Demand 120 Figure 5-15: Leg Load Factor Criterion – Full EMSR - Low Demand ... 121
Figure 5-16: Leg Load Factor Criterion – Full EMSR - Medium Demand ... 122
Figure 5-17: Leg Load Factor Criterion – Full EMSR - High Demand ... 122
Figure 5-18: Full EMSR - Absolute Revenue Variation by FC Type and Cabin Accommodation and LLFC – Medium Demand ... 123
Figure 5-19: Method 1 - Total Revenue Proportional Variation by Airline ... 125
Figure 5-20: Method 1 - Proportional Revenue Gains by Fare Class Type ... 126
Figure 5-21: Method 1- Absolute Revenue Gains by Fare Class Type ... 126
Figure 5-22: Method 1 - Absolute Revenue Variation by Fare Class Type and Cabin Accommodation ... 128
Figure 5-23: Method 1 - Revenue Variation by Fare Class and Demand Level ... 129
Figure 5-24: Premium Cabin Bid Prices - Distinct and Method 1 ... 130
Figure 5-25: Economy Cabin Bid Prices - Distinct and Method 1 ... 131
Figure 5-26: Closure Rates Fare Classes 1 and 2 - Time Frames 11 to 16 – Medium Demand ... 132
Figure 5-27: Cumulative Bookings FC1 + FC2 Medium Demand Level ... 133
Figure 5-28: Closure Rates Fare Classes 3 and 4 ... 133
Figure 5-29: Cumulative Bookings FC3 + FC4 Medium Demand Level ... 134
Figure 5-30: Closure Rates Fare Classes 5 and 6 ... 135
Figure 5-31: Cumulative Bookings FC5 + FC6 Medium Demand Level ... 135
Figure 5-32: Closure Rates Fare Class 7 to 10 – Medium Demand ... 137
Figure 5-33: Cumulative Total Revenue Variation ... 137
Figure 5-34: Method 2 - Total Revenue Proportional Variation by Airline ... 138
Figure 5-35: Method 2 - Proportional Revenue Gains by Fare Class Type ... 139
Figure 5-36: Method 2- Absolute Revenue Gains by Fare Class Type ... 140
Figure 5-37: Method 2 - Absolute Revenue Variation by Fare Class Type and Cabin Accommodation ... 140
Figure 5-38: Method 2 - Revenue Variation by Fare Class and Demand Level ... 141
Figure 5-39: Premium and Joint Cabin Bid Prices – Medium Demand... 142
Figure 5-40: Economy and Joint Cabin Bid Prices – Medium Demand ... 143
Figure 5-41: Method 3 - Total Revenue Proportional Variation by Airline ... 145
Figure 5-42: Method 3 - Proportional Revenue Gains by Fare Class Type ... 145
Figure 5-43: Method 3 - Absolute Revenue Gains by Fare Class Type ... 146
Figure 5-44: Method 3 - Absolute Revenue Variation by Fare Class Type and Cabin Accommodation ... 147
Figure 5-45: Method 3 - Revenue Variation by Fare Class and Demand Level ... 148
Figure 5-46: Premium and Joint Cabin Bid Prices – Medium Demand... 150
Figure 5-47: Closure Rate Fare Class 1 - Method 3 - Medium Demand... 150
12
Figure 5-49: Economy and Joint Cabin Bid Prices – Medium Demand ... 152
Figure 5-50: Closure Rate Fare Class 10 - Method 3 - Medium Demand ... 153
Figure 5-51: Cumulative Bookings FC10 - Method 3 - Medium Demand ... 153
Figure 5-52: Closure Rate Fare Class 5 - Method 3 - Medium Demand... 154
Figure 5-53: Cumulative Bookings FC5 - Method 3 - Medium Demand ... 154
Figure 5-54: Cumulative Total Revenue Variation - Method 3 ... 155
Figure 5-55: Time Frame Protection - Method 1 ... 157
Figure 5-56: Time Frame Protection - Method 1 - Medium Demand ... 157
Figure 5-57: Total Revenue - Time Frame Protection - Method 2 ... 158
Figure 5-58: Time Frame Protection - Method 3 - Low Demand ... 159
Figure 5-59: Time Frame Protection - Method 3 - Medium Demand ... 159
Figure 5-60: Time Frame Protection - Method 3 - High Demand ... 160
Figure 5-61: Method 3 with TFP - Absolute Revenue Gains by Fare Class Type – Medium Demand ... 160
Figure 5-62: Leg Load Factor Criterion - Method 3 - Low Demand ... 161
Figure 5-63: Leg Load Factor Criterion - Method 3 - Medium Demand ... 162
Figure 5-64: Leg Load Factor Criterion - Method 3 - High Demand ... 162
Figure 5-65: Method 3 - Absolute Revenue Variation by FC Type and Cabin Accommodation and LLFC – Medium Demand ... 163
13
List of Tables
Table 3-1: Booking Process Time Frames ... 36
Table 3-2: Fleet Composition and Operating Profile Airlines Network V1 ... 45
Table 3-3: Network V1 -Applicable Conditions and Restrictions in International Markets ... 46
Table 3-4: Network V1 - Applicable Conditions and Restrictions in Domestic Markets ... 46
Table 3-5: Network V1 - Fare Structure Premium Fare Classes in International Markets ... 47
Table 3-6: Network V1 - Fare Structure Economy Fare Classes in International Markets ... 47
Table 3-7: Network V1 - Fare Structure Premium Fare Classes in Domestic Markets ... 47
Table 3-8: Network V1 - Fare Structure Economy Fare Classes in Domestic Markets ... 47
Table 3-9: Baseline Summary ... 48
Table 3-10: Base Case Outputs with AL1 using EMSRb ... 49
Table 3-11: Base Case Outputs with AL1 using ProBP ... 50
Table 3-12: Aircraft Seat Configurations Simulated ... 55
Table 3-13: Distinct vs Full EMSR with shared capacity ... 60
Table 3-14: Distinct vs Full EMSR without shared capacity ... 61
Table 4-1: Airline 1 Fleet ... 65
Table 4-2: Domestic and International Legs by Aircraft Type ... 65
Table 4-3: Proportion of local passengers by aircraft type and demand level ... 66
Table 4-4: Average Leg Load Factor (ALLF) by aircraft type and demand level – Leg Control ... 67
Table 4-5: Average Leg Load Factor (ALLF) by aircraft type and demand level – OD-Control ... 67
Table 4-6: Aircraft Seat Configurations Simulated ... 68
Table 4-7: Proportional Variation in ASM's in the network compared to the baseline ... 68
Table 4-8: Average Leg Load Factors by leg category - Aircraft Type B – Leg-RM... 74
Table 4-9: Proportional revenue variations on legs operated by aircraft A – Leg-based RM ... 79
Table 4-10: Proportional revenue variations on legs operated by aircraft A – Leg-based RM ... 82
Table 4-11: Proportional revenue variations on legs operated by aircraft B – Leg-based RM ... 84
Table 4-12: Proportional revenue variations on legs operated by aircraft B – OD-Control ... 85
Table 4-13: Proportional revenue variations on legs operated by aircraft C – Leg-based RM ... 86
Table 4-14: Proportional revenue variations on legs operated by aircraft C – OD-control RM ... 87
Table 4-15: Average Fare by Fare Class and Cabin in the Baseline - Legs Operated by Aircraft Type A – Leg Control – Medium Demand ... 89
Table 4-16: Average Revenue by passenger accommodated/spilled – Aircraft Type A – Leg-control ... 92
Table 4-17: Average Fare by Fare Class and Cabin in the Baseline - Legs Operated by Aircraft Type C – Leg Control – Medium Demand ... 94
Table 4-18: Average Revenue by passenger accommodated/spilled – Aircraft Type C – Leg-control ... 96
Table 4-19: Average Revenue by passenger accommodated/spilled – Aircraft Type B – Leg-control ... 97
Table 4-20: Average Revenue by passenger accommodated/spilled – Aircraft Type A – OD-control ... 97
14
Table 4-21: Average Revenue by passenger accommodated/spilled – Aircraft Type B – OD-control
... 98
Table 4-22: Average Revenue by passenger accommodated/spilled – Aircraft Type C – OD-control ... 98
Table 5-1: EMSRb Baseline Settings ... 107
Table 5-2: Full EMSR Settings ... 108
Table 5-3: Comparison of Expected and Observed Results – Full EMSR ... 111
Table 5-4: Full EMSR - Proportional Variation of Forecasts – Leg-based ... 113
Table 5-5: OD RM Methods Baseline ... 124
Table 5-6: Premium Cabin Bid Price Capacity Sharing - Simulation settings ... 124
Table 5-7: Comparison of Expected and Observed Results - PCBP Capacity Sharing Method ... 128
Table 5-8: Method 1 - Proportional Variation of Forecasts ... 130
Table 5-9: Joint Cabin Bid Price Capacity Sharing - Simulation settings ... 138
Table 5-10: Effective Bid Price Capacity Sharing - Simulation settings ... 144
Table 5-11: Comparison of Expected and Observed Results - EBP Capacity Sharing Method ... 147
Table 5-12: Method 3 - Proportional Variation of Forecasts... 149
Table 5-13: Summary of proportional revenue variations for OD-control premium cabin capacity sharing methods at the Medium Demand Level ... 164
Table 5-14: Summary of proportional revenue variations for Full EMSR ... 165
Table 6-1 Revenue Variation on legs operated by Aircraft Type A... 167
Table 6-2: Revenue Variation on legs operated by Aircraft Type B ... 168
Table 6-3: Revenue Variation on the legs operated by Aircraft Type C ... 168
Table 6-4: Comparison of Expected and Observed Results – Full EMSR ... 169
Table 6-5: Summary of proportional revenue variations for Full EMSR ... 170
Table 6-6: Comparison of Expected and Observed Results – Method 1 and Method 2 ... 171
Table 6-7: Comparison of Expected and Observed Results – Method 3 ... 171
Table 6-8: Summary of proportional revenue variations for OD-control Premium Cabin Capacity Sharing Mechanisms ... 172
15
1. Introduction
The operation of a flight by a commercial airline is the result of many decisions taken in different stages of its planning process. In the short to medium term, tactical decisions related to the operation of a flight, such as crew scheduling, maintenance actions and pricing and seat inventory management, are required. In the medium to long term, strategic planning, marketing strategy, commercial alliances, information technology and fleet and route planning are some of the main topics on the agenda of an airline management team. Among these many complexities, there are two dimensions that are particularly relevant to this thesis: on the one hand, the role of differential pricing and revenue management as tools that have been developed to maximize the revenue obtained from the available seat capacity. On the other hand, the definition of the number of seats installed in each of the cabins (premium and economy) of an aircraft affects the total number of seats that can be offered to the travelers. When combined, both dimensions can have a substantial impact on the profitability and competitive position of the airline.
1.1 Differential Pricing and Revenue Management
Airlines are often studied in transportation economics courses as one of the most successful cases of the implementation of differential pricing as a mechanism to increase the producer surplus (through the increased capture of consumer surplus). Differential pricing consists mainly of two different tools: price discrimination and product differentiation. The former consists of charging different prices for the same product based in the estimated willingness to pay of different groups of customers; by contrast, product differentiation refers to the practice of assigning prices to the products based on their characteristics (i.e. higher prices for products with higher value to customers or higher production costs for the airline).
The main challenge associated with this process is that rational travelers would always prefer to pay less for their trips. Therefore, airlines need to find mechanisms that effectively stimulate passengers to buy tickets at a price that is closer to their willingness to pay, instead of selecting a lower fare. The first instrument that airlines have developed to achieve this goal are fare restrictions; some of these restrictions are associated with charging fees for potential changes or cancellations while others are related to requirements such as advanced purchase, minimum stay or round-trip travel. The combination of these restrictions (and different levels of each) leads to a
16
wide variety of fare products. Depending on the specific characteristics of each passenger, the total inconvenience associated with each of these combinations would be perceived as an increased cost of the fare product being purchased. Based on such increased disutilities, a passenger might (or not) prefer to buy a more expensive, but less restricted, fare product to fly between two cities. The second instrument available for airlines to offer different prices is the provision of amenities, in addition to the service of transportation from A to B, that have a direct effect on the utility perceived by the passenger. Some examples of these added value items include the option of carrying checked bags at no additional cost, additional frequent flyer program points, lounge access, pre-assigned seats and preferential check-in lines. Moreover, airlines have the option of dividing their aircraft into cabins; in one or more of these cabins, an enhanced service is offered to satisfy the expectations of passengers with high willingness to pay. The services provided in such cabins often include premium food and drinks, additional space, more comfortable seats and service oriented flight attendants. While Business Class service is the most typical premium cabin service and is provided by many carriers (mostly international), First Class is used exclusively by some world-class carriers; moreover, a small group of airlines has developed cabins that exceed the service usually provided in First Classes through the installation of suites featuring elements such as beds and showers. Another example is the recent introduction of “premium economy” seats, featuring seats that are usually comparable to those in economy cabin, but providing more legroom and other perks (such as free drinks and snacks) to the passengers.
Once products (and their associated prices) are defined by an airline, airlines use revenue management techniques to maximize the revenue captured from the flights in its network. This means managing the seat inventory of the aircraft such that each seat captures as much revenue as possible given the characteristics of the demand for each market. This is achieved by protecting seats for travelers that arrive late in the booking process but are willing to pay some of the highest fares available. As discussed herein, dividing the aircraft in cabins with different service standards helps the airline to incentivize passengers with high willingness to buy high fare products. However, dividing the aircraft in cabins adds an additional restriction to the process of revenue management, since it limits the amount of seats to be protected for the higher fare classes from the lower fare classes to the physical capacity of the premium cabins. In addition, when cabins are managed distinctly, airlines cannot use empty premium cabin seats for accommodating passengers that are willing to buy some of the lower fare classes.
17
1.2 Fleet Planning and Aircraft Configuration Process
Fleet planning is one of the long term decisions faced by an airline in its planning process. Its main objective is to determine the number and type of aircraft required for serving the proposed business plan of the airline for any period in the future. Notwithstanding the approach used for making these choices, incorporating an aircraft type in an airline’s fleet is typically made with a time horizon of at least 10 years of operation. In addition, because of the availability of future slots and the specificities associated with aircraft manufacturing, purchase agreements between aircraft manufacturers and airlines usually involve aircraft to be received four or more years in the future. This means that airlines make fleet decisions that will impact their performance many years ahead of such decisions; as expected, there is high uncertainty about the market conditions prevailing at the time when selected aircraft will be operated.
Once an aircraft type has been chosen, airlines have some other decisions to be made related with the specificities of such airplane. Together with the selection of the engine type to be installed (when alternatives are available), the other major process consists in choosing (or designing, if applicable for the aircraft type) a layout of passenger accommodation (“LOPA”) where the details of the aircraft’s cabin interior are defined. If the option is available, airlines can decide either to stick to the number of seats used as part of the assumptions of the fleet planning process or to proceed with other configuration. Since the final decision is made a couple of years before the delivery of the first aircraft of an order, this option provides the option to the airline of making an adjustment if the characteristics of the markets to be operated by such aircraft type have changed. Furthermore, cabin configuration decisions are not limited to the fleet planning process, as retrofit programs can be undertaken with existing aircraft in the fleet (Nita and Scholz, 2009).
Despite this degree of flexibility, the decision of how many seats to install in each of the cabins is far from simple, as it has implications for the revenues and costs of the airline, as well as in other items that are more difficult to quantify. It should be considered that in order to provide more space and comfort to each of the passengers flying in premium cabin, such seats are typically wider than economy cabin seats and increased pitch is allowed between rows. Therefore, depending on the characteristics of the aircraft type and of the seats, adding a premium cabin seat represents decreasing more than one seat in economy cabin. An example of this trade-off is presented in Figure 1-1Figure 1-1: Major US airline Boeing 767 and Boeing 777 seats by aircraft
18
adapted from the website of a major US airline, for their Boeing 767 and Boeing 777-200 aircraft. In the case of the Boeing 767, the elimination of its First Class (10 seats) plus the removal of 2 Business Class seats from the Low Density configuration allows for the installation of 25 Main Cabin Extra (premium economy) seats and 28 additional Main Cabin seats, resulting in a total of 41 additional seats in the High Density configuration. For the case of the Boeing 777-200, the High Density configuration is able to carry a total of 13 additional passengers as a result of the change of its configuration. Another case is found in the Airbus A320 aircraft characteristics documents, where two different A320 configurations are presented: the first of these has 12 seats in the premium cabin and 138 in the economy cabin (for a total of 150 seats); the other option has 180 seats in a single economy cabin arrangement.
Aircraft
Type Configuration First Class
Business Class
Main Cabin
Extra Main Cabin Total
Boeing 767 Low Density 10 30 - 128 168 High Density - 28 25 156 209 Boeing 777-200 Low Density 16 37 - 194 247 High Density - 45 45 170 260
Figure 1-1: Major US airline Boeing 767 and Boeing 777 seats by aircraft
In order to forecast the operating revenue that will be generated by a specific aircraft type with a determined seat configuration, there are many assumptions that have to be made by the airlines. The first parameter to be forecasted is the traffic effectively carried by the airline on its flights. This traffic forecast (measured in Revenue Passenger Kilometers – RPK) would be affected by the future demand for travel between all the city pairs in the network, the expected market share of the airline in each of such markets, the projected load factors and by the available capacity (measured in Available Seat Kilometers – ASK) offered by the airline and its competitors. On top of the obvious effect of seat configuration of an aircraft on seat availability, it might also have an effect over other parameters mentioned above, such as the load factor. For example, an increase in the total capacity of an aircraft can possibly result in a higher share of travelers carried by the airline, but it does not necessarily imply that the traffic would increase in the same proportion as the increase in seat availability; i.e. load factor is likely to decrease. On the other hand, if the total capacity of an aircraft is reduced, potential demand is rejected and its revenue is not captured (this concept is known as
19
spill and will be reviewed in detail in the following sections of this thesis). In dual cabin aircraft, an increase in the size of the premium cabin of an aircraft type will probably result in an increase in the share of the business passengers that will be off-set by a lower number of economy cabin passengers (and possibly of total passengers as well) transported by the airline.
The decision of how much capacity to allocate to each cabin might also have an effect on the other variable associated with the calculation of operational revenues: yield. Defined as the revenue per RPK, it is the indicator used for measuring the average price paid by the passengers for each kilometer flown. As explained in Section 1.1., premium cabins are installed on aircraft with the expectation of providing a product that incentivizes passengers with high willingness to pay to buy some of the most expensive fare classes available; therefore, the yield would be expected to increase because of the higher price paid by passengers for flying in premium cabin. However, the effect of it is not clear as adding premium capacity might also open space for lower-priced premium fare classes and reduce the availability for some of the highest economy fare classes; this situation is exacerbated by the fact that it is not unusual that the lowest restricted premium fare classes can have a lower price than an unrestricted economy fare class.
The implications of selecting a particular layout configuration also affect the costs of the airline. First, there is some effect on capital costs associated with the installation of different kind of seats in an aircraft type. Because of many factors, including but not limited to the installation of electronic mechanisms that allow premium seats to recline (even lay flat) and the use of customized materials, the unit price paid by an airline to a seat manufacturer for a premium cabin seat can significantly exceed the price of an economy cabin seat. Moreover, as airlines usually add special features to the seats in premium cabins (compartments for laptops, earphones, stowage, etc.), significant one-time fees are charged by the aircraft and seat manufacturer for the design, engineering, testing and certification of such features. In addition, the installation of better devices, such as larger (and more-expensive) in-flight entertainment monitors and handsets for an enhanced passenger experience can make the installation of premium cabin seats a very expensive proposition for an airline.
In addition, different configurations also have an impact on the operating costs of an airline; in that sense, the main effect is represented by the change in fuel consumption. As the physical characteristics of the seats are different, the unit weight of a premium class seat is significantly higher than the commonly simple economy cabin seats; however, since more economy cabin seats can be accommodated, the total weight would depend on the number of seats and their specific
20
features. Of course, fuel consumption is also affected by the number of passengers effectively transported, as each one of them adds its own weight (plus its luggage) to the load carried by the aircraft. Compared to the total weight of an aircraft, these variations in weight can appear to be negligible, but it certainly represents a significant cost item to be considered when evaluating available configurations. Total service costs might also change as a result of the requirement of modifying the number of flight attendants working in the aircraft on each flight or in the provision of a different number of premium meals to be offered in each flight.
Operating costs and operating revenues are the main drivers for selecting an aircraft. Nevertheless, three other aspects involved in the seat configuration decision process are not so easily quantifiable or are more complex, but it is still relevant to mention them as part of the decision making process. First, as part of its brand positioning, an airline might consider strategically attractive to keep offering premium cabin services in order to project a world-class image and to be the preference of business travelers. The availability of space for upgrading passengers to premium cabin can be perceived as a mechanism that increases the fidelity of frequent flyers that usually buy high economy cabin fares. It could also be the case that a low cost carrier identifies the possibility of transporting business travelers if a premium cabin is incorporated in their aircraft, but the decision is to continue with a single cabin configuration in order to be consistent with the strategy of the airline. Second, in a similar approach to the previous item, an airline’s decisions can also be affected by the cabin configuration of its competitors; just as with fares, airlines might need to “match” the services offered by another airline in order to remain competitive. Finally, although certain seat configurations might be favorable for most of the flights operated by an aircraft type, technical aspects such as the payload-range relationship can force the airline to operate the route with a different aircraft type or to restrict the amount of seats that can be made available for sale on such flights; as all the other aspects mentioned before, there could be a significant effect on the captured revenue as a result of this restriction.
Figure 1-2 summarizes the factors presented in this section as elements to be considered when analyzing available seat configurations for an aircraft type.
21
Figure 1-2: Factors considered in the evaluation of aircraft cabin configurations
1.3
Motivation for Research
As mentioned in the previous sections, the selection of an aircraft type in its fleet has long term effects on the profitability of the airline. In a market that keeps changing, such as the commercial aviation industry, any degree of flexibility for adjusting the capacity to match better the demand provides an opportunity for airlines to remain competitive when conditions have changed. If the market expands, airlines have the option of acquiring or leasing additional aircraft; if the demand for air transportation in the airline’s market contracts, airlines might consider retiring or parking aircraft or early terminating leases.
Airlines can also explore alternatives that allow them to use more efficiently the “floor space” of their aircraft. In the short term, a carrier using at least two cabins in its configuration has the opportunity of sharing the capacity of the premium cabins, allowing for passengers that purchased economy fare classes to occupy the seats of such cabins when those seats are not expected to be filled by passengers paying high premium cabin fare classes. However, when capacity is shared there is a risk of displacing some of those passengers with high willingness to pay, reducing the revenue obtained from a sold seat. Another limitation of this approach is that it only allows the
Revenue
Passengers by cabin carried on the fleetPassengers by cabin carried on the rest of the network Fares paid by the carried passengers
Cabin capacity management Revenue Management
Costs
Fuel ConsumptionConfiguration costs Other operational costs
Other
variables
Brand and service considerations Comparison with competitors Aircraft technical characteristics
22
airline to increase the number of economy fare class passengers, but it does not provide an alternative for increasing the number of premium fare class passengers beyond the physical capacity of the premium cabin. A medium to long term solution that can be implemented by airlines consists of retrofitting aircraft in order to readjust the capacity of its cabins in order to match better the conditions of a market. The risks in this case are associated with a reduction of the total (premium + economy) revenue if the revenue lost from the cabin with reduced capacity is not compensated by the additional revenue gained in the enlarged cabin.
The evaluation of these alternatives would follow the same approach proposed in Section 1.2. Following such an approach, the strategy of sharing premium cabin capacity would probably have an effect over the airline’s revenue with almost no effect on its costs. By contrast, the retrofit option would have parallel impacts on the revenue and the cost sides. Moreover, the implementation of a retrofit program has large additional costs involved, since aircraft would require to be grounded for the modification, aircraft LOPA requires to be certified by the aviation authorities and new seats and equipment have to be purchased for installation on the aircraft.
This thesis will focus on understanding the impacts that both strategies would have over the operating revenue of an airline implementing such changes. Instead of relying only on theoretical models for this evaluation, simulation tools will be used to address the complications related with the many assumptions required for calculating revenue (mostly the estimation of yield and traffic); more specifically, the Passenger Origin Destination Simulator PODS, described in Chapter 3 of this document, will be used. The advantage of this simulator is that, instead of considering that the changes only impact the airline implementing the strategy, PODS models a competitive environment where passengers make decisions based on their own characteristics and on the options made available by the airlines competing in the market; as a consequence, PODS allows us to evaluate the impacts on the decisions revenue of the airline and its competitors. Finally, it also presents the effect that a change implemented in a portion of the network (such as a specific aircraft type as part) has over the whole network of an airline, and allows for testing different revenue management techniques.
23
1.4
Thesis Outline
The remainder of the thesis is organized into several chapters: Chapter 2 gives a review of literature related with revenue management techniques, dual-cabin revenue management and spill modeling. Chapter 3 introduces the PODS simulation tool and presents the methodology that will be used in the thesis. Then, Chapter 4 explores the alternative of changing an aircraft’s cabin configuration, and evaluates its impact on revenue. Chapter 5 is dedicated to the evaluation of the impacts of shared availability of premium cabin. Finally, Chapter 6 summarizes the results of the thesis, provides conclusions and suggests possible areas of future research.
24
2. Literature Review
This chapter summarizes the relevant literature and previous work related with the topics addressed in this thesis. First, a general framework of revenue management (“RM”) is presented, focusing on the specific methods used in this study. Second, previous research on the multiple cabin revenue management problem is reviewed. Finally, literature related to spill modeling and its effect on the fleet assignment problem is introduced.
2.1 Revenue Management
As briefly described in Chapter 1, Revenue Management (“RM”) systems are implemented with the objective of maximizing the revenue of an airline by capturing the highest possible revenue from each seat of each flight. As described by Belobaba et al. (2015), there are two main components of airline revenue maximization: differential pricing and revenue management. While the first offers different products at different prices in order to satisfy the demand of potential passengers with diverse willingness to pay, revenue management is the process used to managing the inventory of available seats between fare classes by setting booking limits on low-fare seats.
Demand forecasts for each fare class are one of the main inputs for RM systems. Such forecasts can be either for each flight leg operated by the airline or for each path itinerary. By combining these forecasts with the information of the prices associated with each fare class, RM optimizers and availability control mechanisms determine the expected revenue that would be captured if a seat in an aircraft is allocated to such fare class and/or path. The optimization process considers the trade-off between yields and loads so that the airline can control its seat inventory in a way that maximizes its revenue.
Leg-based RM uses information of the flight legs for its demand forecasts and its optimizer aims to maximize the revenue captured from each individual leg. The rules that are most frequently used in airline leg-based RM systems are based on the Expected Marginal Seat Revenue (“EMSR”) model (Belobaba, 2016). Belobaba proposed the first version of this model, consisting of a heuristic that assumes that the demand for each fare class on each leg is independent of the demand for the other fare classes and that such demand is stochastic and follows a normal distribution (Belobaba, 1987). In addition, EMSR considers that all bookings arrive in a single booking period (static optimization)
25
and that the lowest available class books before the next lower available class, and so on; it should be noted that the relevance of the last two considerations is reduced due to the possibility of calculating the booking limits many times during the booking period.
The EMSR model determines the number of seats to be protected for each fare class by comparing the marginal revenue that is expected to be captured by assigning one more seat to such fare class (considering its probability distribution) with the fare of each of the lower classes available; based on this algorithm, ESMR defines nested booking limits for each fare class. A modification to this heuristic proposes a generation of joint protection levels for higher fare classes relative to lower fare classes and is known as “EMSRb” (Belobaba, 1992). Although EMSR is a leg-based mechanism, it also controls connecting itineraries by restricting bookings in a certain fare class if such fare class is closed (i.e. does not have seats allocated as a result of the optimization process) on at least one of the flight legs included in the itinerary. As a result of this implementation, leg-based RM does not optimize the revenue captured from the network, since a passenger willing to book in a fare class for an itinerary that involves connections could be rejected even if the revenue that would be captured by accepting such a booking request is higher than the sum of the expected revenue to be captured on each of the legs.
This led to the development of network or Origin-Destination (“OD”) revenue management; in contrast to the leg-based approach, OD RM focuses on maximizing the revenue of the whole network of the airline by considering local and connecting bookings simultaneously in the optimization. A key concept in this process is the “displacement cost” imposed by a connecting passenger by potentially displacing other passengers (and their revenues) from the legs included in the itinerary. Hence, the value added by a connecting passenger to the network is equal to the corresponding fare in the connecting market minus the displacement cost levied on the legs to be traversed (Belobaba et al., 2015).
One of the OD control mechanisms is known as Bid Price Control (Belobaba et al., 2015). This methodology determines a minimum price (i.e. the bid price) required to accept a booking request of a connecting passenger. The bid price for each leg traversed by a connecting itinerary is equal to the value of the last seat available on the leg plus the displacement cost on other legs that would be imposed by the connecting passenger on it. Moreover, in order to generate revenue gains for the airline, the fare of such a booking request must be higher than the sum of the bid prices of all the legs that are part of the itinerary.
26
The bid price control technique used in this thesis is Probabilistic Bid Price Control (“ProBP”). This method considers the probabilistic nature of the demand for each fare class and incorporates it by running EMSRb in each of the legs of the network, while considering the connecting itineraries that use the leg in the optimization as well. The value of such connecting itineraries is prorated between legs based on the marginal revenue values incremental available seats (or “EMSRc’s”) of those legs, and such EMSRc’s are also used as the displacement costs for each leg. This process is repeated until the bid prices (displacement costs) converge for every leg in the network (Bratu, 1998).
2.2 Multiple Cabin Revenue Management
The multiple cabin revenue management problem aims to maximize the revenue of an aircraft with multiple cabins by sharing the seats of a higher service cabin with passengers who would book in the fare classes corresponding to a cabin that offers lower service standards. For example, in an aircraft with first class, business and economy cabins, first class seats could be shared with passengers that booked in business and economy cabin but business cabin seats could be shared only with passengers that booked in economy cabin. The main assumption for this approach is that passengers that booked in a certain cabin would always accept to be upgraded to a cabin that offers better service. Hence, the multiple cabin revenue management problem focuses on developing strategies to share the capacity of such higher quality cabins in a way that maximizes the revenue of the aircraft.
Alstrup et al. (1986) develop one of the earliest models found in the literature that splits the passengers in two types, “euro-class” and “tourist-class”. Their model is a two-dimensional stochastic dynamic programming (“DP”) that treats the booking process as a Markovian nonhomogeneous sequential decision process that includes overbooking, cancellations and no-shows. In addition, passengers can be either upgraded from tourist to euro class or downgraded from euro to tourist class (the airline assumes a cost if a passenger is downgraded). The result of their model is a booking policy that defines the maximum number of reservations that can be accepted at a certain time of the booking period for each kind of passenger, given the number of passengers already booked in each cabin.
Lepage (2013) focuses on the single-leg multiple cabin revenue management problem; his thesis explores six different algorithms developed and evaluated using the Passenger Origin-Destination
27
Simulator (“PODS”) that will be described in Chapter 3. Some of the evaluated strategies are based on a dynamic programming formulation and others on heuristics; as a matter of fact, these heuristics are closely related to part of the work that is presented in this thesis. The tested algorithms are the following:
Multiple cabin DP Formulations:
o Multiple Cabin DP:
This approach assumes that the demand for each fare class in each time frame is independent and that booking requests arrive following a Poisson process. Bid prices are computed for each cabin using a DP algorithm. Upon arrival of a booking request for an economy fare class, its fare is compared with the bid prices. If the fare is lower than the economy cabin bid price but higher than the premium cabin bid price, the booking request is accepted and upgraded to premium cabin.
o Multiple Cabin DP with variance:
Similar to the Multiple Cabin DP, but this algorithm assumes higher variances by allowing arrivals of booking requests in batches and by not assuming equal variance for the different fare classes.
Heuristics:
o Shared nesting with EMSR: Shared nesting Full EMSR:
This heuristic applies the EMSRb algorithm to the entire capacity of the aircraft in order to determine the number of premium cabin seats to be protected for premium fare classes from economy fare classes. The booking limits for premium fare classes are adjusted based on premium cabin capacity while the booking limits for economy fare classes are left as calculated under the assumption of a single cabin.
Shared nesting Economy EMSR:
In this case, the EMSRb algorithm is applied to the entire capacity and adjusts the booking limits for premium fare classes based on premium cabin capacity. The number of premium cabin seats to be shared (i.e. the premium cabin seats
28
that are not protected from economy fare classes) are assumed to be added to the economy cabin and EMSRb is applied again considering only the economy fare classes.
Shared nesting EMSRc bid price control:
Following the application of the EMSRb algorithm to each of the cabins separately, the EMSRc is calculated for each cabin and set as its applicable bid price. The number of premium cabin seats to be shared is determined by the largest number of premium cabin seats for which the economy cabin bid price is greater than or equal to the premium cabin bid price (i.e. the expected revenue of an additional seat in economy would be higher than expected revenue of the last available seat of premium). Once the number of premium cabin seats to be shared is determined, EMSRb is then applied adding the shared premium cabin seats to the economy cabin capacity.
o Multiple Cabin DP heuristic:
Bid prices for each cabin are calculated using a DP formulation. In addition, an additional bid price is calculated for all the fare classes considering the total capacity of the aircraft.
Premium fare classes booking requests are always compared to the premium cabin bid price. When the economy cabin has seats available, the economy fare class booking requests are compared with the economy cabin bid price; if economy cabin is sold out, the economy fare class booking requests are compared with the bid price calculated using the total capacity.
In order to compare the performance of the algorithms, these were tested by Lepage in two different networks and fare structures: on the one hand, a “single market” with two competing airlines operating one flight each; on the other hand, a “realistic” network with four airlines that compete in numerous flights and markets. The Multiple Cabin DP Formulations are not tested in this network because the author does not consider it practical due to the complexity and size of the scenario.
Based on the simulations, Lepage found that the Multiple Cabin DP heuristic leads to the highest revenue gains among the strategies evaluated; the revenue increase resulting from this approach can be as high as 2.5% (compared to distinct EMSR), but gains were observed in all the tested
29
scenarios. In addition, Shared nesting Full EMSR reported revenue gains only in the “realistic” network (up to 0.4%). Revenue reductions were obtained from the simulations of all the other algorithms proposed. Overall, the heuristics outperformed the DP methods.
Walczak (2010) hypothesizes that higher flexibility in the mechanisms for sharing the premium cabin capacity results in higher revenue for the airlines. Such flexibility is provided either through availability of fixed size cabins, as in the multiple cabin revenue management problem, or through adjusting the aircraft configuration and the size of each cabin with a movable curtain. The author acknowledges that, in the case of the movable curtain approach, accepting one premium cabin passenger reduces the number of seats available to economy fare classes by more than one due to the seating arrangements.
For the problem in which the capacity of each cabin is fixed, two DP formulations are proposed. An insight from the solution of these formulations is that the output of the model is a two-dimensional matrix of bid prices that is not practical for inventory control because it cannot be implemented readily by existing systems. In addition, it is found that there is a relationship between the bid prices of one cabin and the available seats in the other cabin. The performance of the DP formulations is compared with five heuristics and it is found that, among these, the ones that perform better are the ones that use a joint bid price vector once economy is sold out.
Finally, Gallego and Stefanescu (2009) highlight the role that upgrades can play when there is a mismatch between supply and demand, as in the cases in which there is large premium cabin capacity in a market with low business passenger demand. One of the main results presented is that optimality could be lost if fairness in the upgrade process was to be guaranteed (e.g. if only highest-fare economy class was allowed to be accommodated in premium cabin) because the seller losses flexibility to maximize its revenues. In a separate topic, the authors discuss how a pronounced and persistent mismatch between supply and demand that require the systematic use of upgrades may modify the expectations of the passengers, exacerbating the mentioned mismatch (the authors do not reach any conclusion in this respect).
2.3 Spill Estimation and Impacts on Fleet Assignment
As discussed in Chapter 1, traffic forecasts are a necessary input for assessing the expected revenues that would be captured by an airline if it decides to operate a certain aircraft
30
configuration. Those forecasts are based on the estimation of the demand for air travel in each of the markets operated by the aircraft and on the expected market share captured by the airline in such markets. Observed traffic in the market can be used as one of the parameters for estimating the demand for air travel between two cities. In addition, Belobaba et al. (2015) identify socioeconomic and demographic variables (population, income per capita, etc.), trip purpose characteristics (mainly business versus leisure), prices of travel options (all the available modes of transportation) and other “quality of service” considerations (frequencies, waiting times, safety, etc.) as additional factors affecting the demand for air travel between two cities. Other models presented in the same book incorporate the concepts of price and time elasticity for demand for air travel in order to capture the sensitivity (or insensitivity) of different kinds of passengers to those variables.
It should be emphasized that in the context of passenger airlines there is a difference between “demand” and “traffic”. Belobaba et al. (2015) conceptualize demand (at a given set of prices) as the sum of customers that are able to travel given the available capacity (i.e. effective “traffic”) plus the consumers that were willing to travel but were not able to be accommodated in the available flights due to scarce seat capacity; this rejected demand is known as “spill”. Following this approach, demand is always higher or equal than the observed traffic, so the associated spill is always higher (or equal) than 0. Considering the revenue losses resulting from rejecting a portion of the demand, the role of spill is of particular relevance when determining the adequate aircraft capacities in the aircraft fleet planning and assignment process.
One of the most commonly used methodologies for estimating spill is based on a model developed by Boeing (Boeing, 1978) for understanding the relationship between flight leg loads and passenger spill. Boeing develops a mathematical formulation that works as a base for deriving the demand distribution and estimating the spilled passengers on a flight leg (because of this, it is widely known as the Boeing Spill Model). The model assumes that the distribution of unconstrained total demand (i.e. ignoring the distribution between fare classes) for a flight leg follows a normal distribution; however, since the limited aircraft capacity allows the airline to observe only a portion of the total demand on flights when spill occurs, this normal distribution is truncated. A mathematical expression is provided to calculate the mean of the truncated normal distribution based on the observed load factors and an assumed coefficient of variation (“CV”); the CV describes the shape of the demand distribution and its typical value for the airline industry is suggested to be between
31
0.20 and 0.40. Methodologies based on the load information are also proposed to estimate the coefficient of variation.
Finally, Boeing provides normalized tables of spill as a function of load factors and demand factors for various values of CV. Based on its results, the Boeing Spill Model can be used to theoretically compare the passengers carried and the spill for any alternative capacity offered for each individual flight leg. Therefore, the recorded load distribution can be used by airlines when the aircraft capacity assigned for a flight leg is being decided, as part of the fleet assignment process. As presented by Subramanian et al. (1994), Delta considered the Boeing Spill Model as part of the Coldstart Project that addressed the problem of fleet scheduling.
One of the major shortcomings of the original Boeing Spill Model is that when it uses a single probability distribution for the demand to estimate the spill factor or spilled passengers, it ignores the role of fare classes and RM. Dealing with these shortcomings, Swan (1994) acknowledges that one effect of RM is that low-fare demand is turned away because of the protection of seats for high-fare demand; therefore, a flight does not have to have “full” capacity to reject passengers. In addition, the author references studies that suggest that the average spill fare should be a weighted combination of the lowest fare class (80%) and the average fare (20%). Abramovich (2013) references an unpublished paper by Swan that revisits the Boeing Spill Model and incorporates the effect of RM systems by aggregating the demands for the different booking classes, but still ignoring the booking limits computed by the RM system.
Li and Oum (2000) derive formulations for the expected spill and the spill rates based on four different probability distributions: normal, logistic, log-normal and gamma. The authors then proceed to compare the shape of the demand distribution when different CV values are used. Among other findings, it is reported that the tested distributions have similar behaviors for small CV values. On the other hand, when the CV value becomes larger, it is found that the normal distribution overestimates the true spill and that the difference in spill between the log-normal and gamma distributions is small. Other findings with high CV values are that the shape of the gamma is similar to the shape of an exponential distribution (not good for demand) and that neither a normal nor a logistic distribution are appropriate because these distributions would have a high probability of taking a negative demand (impossible under a Gamma or log-normal distributions). Using two numerical examples, the authors not only suggest that the choice of the demand distribution is a more important issue when demand is volatile but also that the capacity level is not so relevant in order to decide the distribution that should be used. Swan (2002) also contributes in
32
this discussion by suggesting that Gamma shape might be relevant for first and premium cabins, where the mean values are much smaller than the capacities.
Based on insights provided in Farkas (1996), Farkas and Belobaba (1999) discuss the impact of OD RM on the estimation of spill on a single flight leg. As opposed to the aggregate demand approach of the BSM (and its Swan extension), the authors disaggregate the demand by fare class and by departure. The demand for each fare class is assumed to be independent of the demand of all the other fare classes; other assumptions include no cancellations, no recapture and that lower-valued classes book before the higher-valued fare classes. Combining this information with the booking limits previously provided by a RM optimizer, it is possible to estimate the spill by fare class; moreover, considering the fare values of each class the spill costs could be easily calculated instead of requiring estimating an “average spill fare” for the spilled passengers. An additional model that introduces a multi-period representation of fare class demand is also proposed.
Using Monte-carlo simulations of the booking process and under different discount ratios (i.e. the fare of a fare class over the fare of the immediately higher fare class), the proposed models are tested and compared with a method that uses an aggregated demand distribution. While the authors report that the differences between the two models based on disaggregated demand are negligible, the results suggest that spill is underestimated when aggregated demand is used as an input, potentially affecting the aircraft assignment process.
Abramovich (2013) examines some performance measures (total revenue, load factors, marginal revenue, bookings by fare class) resulting from different single cabin aircraft capacities. The scenarios simulate diverse passenger booking scenarios using PODS and implementing different RM systems, forecasting algorithms, fare structures and networks. The author initially evaluates a single flight network with no competition; in general, a decrease in load factors and in marginal revenue is observed as capacity is increased. Moreover, one of the main findings presented is that, under certain scenarios, increasing capacity can result in negative marginal revenues (i.e. more capacity available but less revenue captured by the airline). Similar results are observed when the airline operates two flights but there is still no competition and also when a second airline is introduced in order to evaluate the effect of competition in the results.
An additional set of simulations is presented in order to compare diverse spill models. Another heuristic, extending the Farkas spill model to incorporate sell up probabilities, is compared with the original Farkas spill model, the Swan extended Boeing Spill Model and the spill reported in the
33
simulations. It is found that the proposed heuristic estimated the spill costs better than the Farkas and Swan-extended Boeing models, when compared with the simulated spills from PODS. In addition, the performance of the heuristic is better when a restricted fare structure is used than when a less restricted structure is in place.
2.4 Summary
This chapter has reviewed literature related with revenue management, the multiple cabin revenue management problem and spill modeling; the models and techniques presented herein provide a general picture of the context of this thesis. In addition, this review also helps to identify gaps in the literature that this thesis aims to fill. One of these gaps is identified after finding that there is no available literature that examines the effect of spill on aircraft with multiple cabins and how this information could be used to compare between configurations of an aircraft fleet operating in a network. In addition, this thesis also aims to contribute by proposing additional heuristics for the dual cabin multiple cabin revenue management problem. Finally, new insights can be provided to the revenue management literature by illustrating the impacts of using leg-based or OD-control RM in a dual cabin setting.
34
3. Methodology
This chapter introduces the methodologies that are proposed in this thesis and the tools used for evaluating the scenarios tested. Because of the RM insights provided by the Passenger Origin Destination Simulator (“PODS”), the first section of this chapter summarizes some of the main features of this simulator; this is accompanied by a brief characterization of the network that is used as the baseline for the results of this thesis. The last two sections are dedicated to introducing the proposed approaches for evaluating changes in seat configuration and shared capacity schemes, both of these in dual cabin aircraft.
3.1 Passenger Origin Destination Simulator (PODS)
Originally developed by Boeing, PODS is the simulation tool used for testing the outcome of the scenarios and strategies proposed in this thesis. Running on hypothetical airline networks, this software replicates the interactions between passengers willing to travel in diverse OD markets and airlines offering air transportation services in such markets. The fact that passengers in PODS are able to select between competitors is one of its most relevant features, as it allows us to evaluate the impact of the proposed strategies under the conditions of a competitive environment (like in the real-world).
The architecture of PODS consists of two major components: the Passenger Choice Model and the Revenue Management System. While the former models the passenger demand, characteristics and choices, the latter replicates the process from an airline’s perspective, considering historical information, forecasts and RM optimizers. Interactions between these modules happen in both directions: on the one hand, the Passenger Choice Model feeds the airline’s RM system when passengers book to fly in their chosen itineraries. On the other hand, the choices made by such passengers are based on the availability information provided by the airline, which is based on the Revenue Management System. The described structure is presented in Figure 3-1.
Another important characteristic of PODS is its consideration of the time dimension: the results of the simulation studies in this thesis correspond to the average result of 800 samples of a single departure date (details can be found on Tam et al., 2008). For each sample, there is a booking period of 63 days during which passengers can book their itineraries. This booking period is