Publisher’s version / Version de l'éditeur:
Client Report (National Research Council of Canada. Construction), 2014-12-31
NRC Publications Archive Record / Notice des Archives des publications du CNRC :
https://nrc-publications.canada.ca/eng/view/object/?id=7e02c449-0565-4086-8beb-7147e6487322 https://publications-cnrc.canada.ca/fra/voir/objet/?id=7e02c449-0565-4086-8beb-7147e6487322
NRC Publications Archive
Archives des publications du CNRC
For the publisher’s version, please access the DOI link below./ Pour consulter la version de l’éditeur, utilisez le lien DOI ci-dessous.
https://doi.org/10.4224/21274566
Mid-rise wood constructions: hygrothermal modelling and analysis:
report to Research Consortium for Wood and Wood-Hybrid Mid-Rise
Buildings
NATIONAL RESEARCH COUNCIL CANADA
REPORT TO RESEARCH CONSORTIUM
FOR WOOD AND WOOD-HYBRID
MID-RISE BUILDINGS
Hygrothermal Modelling and
Analysis
CLIENT REPORT: A1-100035-03.7
REPORT TO RESEARCH CONSORTIUM FOR WOOD
AND WOOD-HYBRID MID-RISE BUILDINGS
Mid-Rise Wood Constructions – Hygrothermal
Modelling and Analysis
S.M. Cornick, M.C. Swinton and K. Abdulghani
Report No. A1-100035-03.7 Report date: December 31, 2014 Contract No. B-7000 (A1-100035) Prepared for Canadian Wood Council
FPInnovations
Régie du bâtiment du Québec
HER MAJESTY THE QUEEN IN RIGHT OF ONTARIO as represented by the Minister of Municipal Affairs and Housing
59 pages
This report may not be reproduced in whole or in part without the written consent of both the client and the National Research Council of Canada.
ACKNOWLEDGMENTS
The research consortium has been supported by Natural Resources Canada and the
Ontario and Quebec building authorities, with research being conducted by the National
Research Council (NRC), Canadian Wood Council (CWC) and FPInnovations (FPI).
Two working groups were established, with participants from NRC, CWC, FPI and
Municipal Affairs and Housing (Ontario) – one on fire and building envelope and the
other on structure and acoustics. Working group meetings have been held on a biweekly
basis to develop and design test methods, design test assemblies and select materials for
the test arrangements. The results of tests are discussed on an ongoing basis.
The following staff members of project partner/collaborator organizations have
contributed to the working groups and this progress report:
CWC: Rodney McPhee, Ineke Van Zeeland, Peggy Lepper;
FPI:
Richard Desjardins, Mohammad Mohammad, Christian Dagenais, Chun Ni, Lin
Hu, Lindsay Osborne, Ling Lu, Ciprian Pirvu; Julie Frapper (Nordic);
MAH: Nancy Smith;
NRC: Khaled Abdulghani, Steve Cornick, Bruno Di Lenardo, Gnanamurugan
Ganapathy, Michael Lacasse, Wahid Maref, Travis Moore, Phalguni
Mukhopadhyaya, Mike Nicholls, Hamed Saber, Mike Swinton, and David Van
Reenen
EXECUTIVE SUMMARY
In general for both wall constructions simulation results tended to point to the exterior of the stud in the Lightweight Wood Frame (LWF) and Cross Laminated Timber (CLT) construction cases to be the area most at risk, specifically toward the exterior surface of the stud. Generally the total Moisture Content (MC) of the stud decreased to an acceptable level within the simulation period however the exterior surface appeared to remain at relatively high of moisture content level for significant periods of time. The presence of wood strapping covering the exterior face of the stud seemed to exacerbate the situation. If a support system for the cladding can be designed that does not rely on wood strapping or covers a minimum area of the stud the performance of this critical area could be improved. If the initial moisture content of the wood materials could be reduced before close up the performance would also be improved for all locations that did not show an increase in moisture content and the RHT index in the second year, at least with respect to computer modelling. This work however was not in scope of the work.
Light weight frame construction
With respect to light weight frame construction and based on the results derived from the 2-D and additional 1-D simulations, the following can be stated:
Overall the performance of LWF wall as modelled was marginal and the design should not be used in wet locations (MI ≥ 1) and is potentially risky in drier locations (MI < 1) as well. For wetter locations, such as Quebec City (MI = 1.08), there was a steady accumulation of moisture and RHT past the first year of simulation whereas the other locations showed no further
accumulation of RHT past the first year. For the stud or structural element:
1-D analysis showed that when the cavity behind the cladding had strapping there was an accumulation of RHT at the exterior face of the stud and high moisture content levels. The main difficulty appears to be the presence of wood strapping which when wet did not permit the stud to dry effectively.
Although the 1-D analysis showed that this design may work in wetter locations if the cavity behind the cladding is clear, the performance of the system in terms of drying was marginal at best for locations such as Vancouver, Prince Rupert and Halifax. Even without the strapping
resistance to water penetration through the wall to the exterior of the stud. The risk was not reduced to zero in the cases modelled and the risk to the sheathing appeared to be high. The recommendations for improvement to the design are:
Where possible use a non-porous system that maintains as clear a cavity as possible.
Substitute spray polyurethane foam insulation for some other insulation having a high water vapour permeability to facilitate the drying out the stud.
During construction care should be taken to protect the structural elements and indeed all wood material as much as possible from moisture; i.e. keep the initial moisture content as low as possible before close-up.
If wood strapping must be used it should be treated to withstand prolonged periods of high moisture content.
Cross laminated timber construction
The cross laminated timber construction modelled was essentially the same construction as the LWF construction with three important distinctions. First, an extra layer of cross laminated timber was placed between the two layers of interior gypsum and the insulation layer. Second, the CLT served as the main structural element for the building instead of wood stud. Finally, the insulation layer was replaced with a more vapour open material versus the spray polyurethane foam used in the LWF model wall.
In all cases the exterior layer of the CLT showed no sign signs of elevated moisture content. There was no accumulation of RHT. The CLT dried quickly and remained dry.
The exterior of the stud supporting the insulation however was problematic. For the stud: 1-D analysis showed that when the cavity behind the cladding has was clear (1-D case AS)
there was much less accumulation of RHT, tending towards zero for Vancouver at the exterior face of the stud however the moisture content tended to remain high throughout the simulation period.
1-D analysis showed that when the cavity behind the cladding has strapping (1-D case Strapping/Stud) there was an accumulation of RHT at the exterior face of the stud and a high moisture content level.
1-D analysis showed that this design might work most locations (MI ≤ 1.5).if the cavity behind the cladding is clear, although there was some accumulation of RHT in very wet locations of Prince Rupert (MI = 2.84).
2-D analysis showed that while the CLT exhibited no accumulation of RHT the exterior of the stud was at risk during the first two years of the simulation. There was considerable difference in the accumulation of RHT for Prince Rupert and Vancouver over the 1-D Strapping/Stud case however there was still some accumulation of RHT, unlike the 1-D Air/Strapping case. The trend indicated that lower RHT values occurred at lower values of MI; Quebec City (1.08) and Toronto (0.86) for example.
Substitution of plywood for exterior grade gypsum panel had no effect on the performance of the CLT. Substitution seemed to have a negative effect on the performance of the stud in Prince Rupert and marginally positive effect on the stud in Vancouver. In all the cases modelled the risk was not reduced to zero and the risk to the sheathing appeared to be high.
Overall the performance of CLT wall as modelled was acceptable however the exterior surface of the stud supporting the insulation was potentially at risk for same reasons as the LWF
construction. The CLT construction should perform adequately for locations with an MI < 1. For locations where MI ≥ 1 consideration should be given to keeping the cavity as clear as possible; i.e. not using strapping.
Some recommendations for improvement to the design are:
Where possible use a non-porous system that maintains as clear a cavity as possible. If wood strapping must be used it should be treated to withstand prolonged periods of high
moisture content.
During construction care should be taken to protect the structural elements and indeed all wood material as much as possible from moisture; i.e. keep the initial moisture content as low as possible before close-up.
TABLE OF CONTENTS
1.
INTRODUCTION ... 7
2.
METHODOLOGY... 7
2.1 Approach to Hygrothermal Simulations ...8
2.2 Details as Regards Input to 1-Dimensional Simulation Model ...8
2.2.1 Wall models and material properties ...8
2.2.2 Modelling assumptions ...10
2.2.2.1 Weather data...10
2.2.2.2 Initial conditions ...10
2.2.2.3 Interior conditions...11
2.2.2.4 Boundary and other conditions...11
2.2.2.5 Moisture sources...12
2.2.2.6 Output Focus ...12
3.
RESULTS FROM SIMULATION: 1- AND 2-DIMENSIONAL CONFIGURATIONS
12
3.1 Results from Preliminary Simulation of 1-Dimensional Configurations ...123.2 Results from Simulation of the 1-Dimensional Wall Configurations ...15
3.2.1 LWF Construction ...15
3.2.2 CLT Construction ...20
3.2.3 Sheathing substitutions: Plywood sheathing and exterior grade gypsum ...26
3.2.3.1 LWF Construction...26
3.2.3.2. CLT Construction...28
3.2.3.2. Moisture Performance of the Substitute Sheathings...28
3.3 Results from Simulation of 2-Dimensional Wall Configuration ...33
3.3.1 Results of simulation of the 2-dimensional wall configuration for Light wood framing (LWF) ...35
3.3.2 Results of simulation of the 2-dimensional wall configuration for Cross-laminated timber framing (CLT) ...39
3.3.3 Sheathing substitutions: Plywood sheathing and exterior grade gypsum ...44
4.
DISCUSSION ... 45
4.1 LWF...46
APPENDIX... 50
A.1 – Detailed wall cross sections for LWF and CLT wall assemblies ...50 A.2 – Weather data selection...52 A.3 – Methods for assigning interior relative humidity according to Class (ISO 13788).55 A.4 – Water entry function...57
LIST OF FIGURES
Figure 1 – hygIRC 1D wall model for lightweight wood frame construction, not to scale. An
asterisk indicates material may be substituted... 9
Figure 2 – hygIRC 1D wall model for cross laminated timber construction, not to scale. An
asterisk indicates material may be substituted... 10
Figure 3 – Comparison of the moisture content for different preliminary simulation scenarios
... 14
Figure 4 – Comparison of the accumulated hourly RHT(92) for different preliminary simulation
scenarios. ... 14
Figure 5 – Hourly accumulation of RHT(92) for LWF construction for study locations. 16
Figure 6 – Moisture content at the exterior node of the stud for LWF construction for study
locations... 17
Figure 7 – 30-day running average moisture content at the exterior node of the stud for LWF
construction for study locations... 17
Figure 8 – Total moisture content of the stud for LWF construction for study locations. 18
Figure 9 – Hourly accumulation of RHT(92) for LWF construction (strapping case) for study
locations... 18
Figure 10 – Moisture content at the exterior node of the stud for LWF construction (strapping
case) for study locations. ... 19
Figure 11 – Total moisture content of the stud for LWF construction (strapping case) for study
locations... 19
Figure 12 – Total moisture content of the strapping for LWF construction for study locations
... 20
Figure 13 – Moisture content at the exterior node of the stud for CLT construction, all locations.
... 21
Figure 14 – 30-day running average moisture content at the exterior node of the stud for CLT
construction, all locations... 22
Figure 15 – Total moisture content of the stud for CLT construction, all locations... 22
Figure 16 – Moisture content at the exterior node of the CLT portion of the wall for various
cross-sections, Stud/Strap (SS), Air/Stud (AS), and Air/Insulation (AI)... 23
Figure 17 – Total moisture content of the CLT portion of the wall for various cross-sections,
Stud/Strap (SS), Air/Stud (AS), and Air/Insulation (AI). ... 23
Figure 18 – Moisture content at the exterior node of the stud portion of the wall for various
cross-sections, Stud/Strap (SS), and Air/Stud (AS)... 24
Figure 19 – Total moisture content of the stud portion of the wall for various cross-sections,
Stud/Strap (SS), and Air/Stud (AS) ... 24
Figure 20 – Accumulated RHT(92) at the exterior node of the stud portion of the wall for various
cross-sections, Stud/Strap (SS), and Air/Stud (AS)... 25
Figure 21 – Total moisture content strapping for YVR and YPR for various cross-sections,
Stud/Strap (SS), Air/Stud (AS), and Air/Insulation (AI) ... 25
Figure 22 – 30-day running average moisture content at exterior node of wood stud for LWF
construction, EG – exterior gypsum, P1 and P2 – plywood 1 and 2 respectively... 27
Figure 23 – Total moisture content of wood stud for LWF construction, EG – exterior gypsum,
P1 and P2 – plywood 1 and 2 respectively... 27
Figure 24 – 30-day running average moisture content at the exterior node of CLT, EG – exterior
gypsum, P1 and P2 – plywood 1 and 2 respectively... 29
Figure 25 – Total moisture content of CLT, EG – exterior gypsum, P1 and P2 – plywood 1 and 2
respectively. ... 29
Figure 26 – Moisture content at the exterior, middle, and interior node of the sheathing for LWF
wall constructions for Vancouver BC, LWF. ... 30
Figure 27 – Moisture content at the exterior, middle, and interior node of the sheathing for LWF
wall constructions for Prince Rupert BC... 30
Figure 28 – Moisture content at the exterior, middle, and interior node of the sheathing for CLT
wall constructions for Vancouver BC. ... 31
Figure 29 – Moisture content at the exterior, middle, and interior node of the sheathing for CLT
wall constructions for Prince Rupert BC... 31
Figure 30 – Hourly accumulated RHT(92) of the exterior of the sheathing material for LWF and
both plywood options and exterior gypsum for Vancouver and Prince Rupert. ... 32
Figure 31 – Hourly accumulated RHT(92) of the exterior of the sheathing material for CLT and
both plywood options and exterior gypsum for Vancouver and Prince Rupert. ... 32
Figure 32 – Model with vented cavity two dimensional cross section of LWF wall, section is in
plan, not to scale. The asterisks indicate that the material may be substituted for... 34
Figure 33 – Model with vented cavity two dimensional cross section of CLT wall, section is in
plan, not to scale. The asterisks indicate that the material may be substituted for... 35
Figure 39 – Distribution of moisture content for the CLT wall model at time, 0, 7, 180, 365, 545,
and 730 days for Vancouver... 40
Figure 40 – Total moisture content as a function of time showing moisture dissipation of the
cross-laminated timber for CLT construction for Vancouver (YVR) and Prince Rupert (YPR).
... 40
Figure 41 – Moisture content as a function of time of the CLT at exterior node located at bottom
of intersection between CLT and stud... 41
Figure 42 – Total moisture content as a function of time showing moisture dissipation of stud for
CLT construction for Vancouver (YVR) and Prince Rupert (YPR)... 41
Figure 43 – Moisture content as a function of time of stud at exterior node located at bottom of
intersection between strapping and stud for CLT constructions. ... 42
Figure 44 – – Total moisture content of the strapping for 2D configurations of CLT constructions
in Vancouver and Prince Rupert... 42
Figure 45 – (a) Accumulated RHT(92) for the stud derived from 1- and 2-dimensional
simulations for CLT constructions, (b) Progression of accumulated RHT(92) at the exterior face
of the stud in the CLT construction for Toronto (YYZ), Quebec City (YQB), Vancouver (YVR),
and Prince Rupert (YPR)... 43
Figure 46 – Effect of moisture content changes on RHT. Both measures are for the exterior of
the stud. The 92% line shows the cut off for RHT. Case (a) represents a change in the
pyschrometric calculation method for air, while case (b) represents a change in construction.
... 47
Figure A 1 ─ Cross Sectional Diagram of the Mid-rise Light Wood Frame Assembly to be
assessed for Heat and Moisture Performance (not to scale)... 50
Figure A 2 ─ Cross Sectional Diagram of the Cross-Laminated Timber Assembly to be Assessed
for Heat and Moisture Performance (not to scale)... 51
Figure A 3 – Typical interior and exterior boundary conditions for Vancouver (YVR) wet years
and average year. Values plotted are 24-hr running averages to help smooth out the plots for the
reader... 54
Figure A 4 – Simple model for calculating the outdoor-indoor vapour pressure gradient.56
Figure A 5 – Water entry function for fixed DRWP’s and varying WDR values... 58
Figure A 6 – Water entry function for fixed WDR values above and below the 150 Pa threshold.
... 58
Figure A 7 – Typical moisture source for Vancouver (YVR) wet years and average year.59
LIST OF TABLES
Table 1 – Wall layers (exterior to interior) as configured for simulation of the Light Wood
Frame Construction (LWF) ... 9
Table 2 – Wall layers (exterior to interior) as configured for simulation of the Cross Laminated
Timber Construction (CLT)... 9
Table 3 – Locations for the parametric study... 11
Table 4 – Accumulated value of RHT(92) LWF; hourly basis ... 15
Table 5 – Accumulated value of RHT(92) for CLT; hourly basis... 20
Table 6 – Accumulated value of RHT(92); hourly basis ... 26
Table 7 – Accumulated value of RHT(92); hourly basis ... 33
Table 8 – Accumulated value of RHT(92) of the CLT; hourly basis. ... 44
Table 9 – Accumulated value of RHT(92) of the stud; hourly basis. ... 44
Table 10 – Accumulated value of RHT(92) of the strapping; hourly basis. ... 45
Table 11 – Accumulated value of RHT(92) of the sheathing; hourly basis... 45
Table A.1 – MEWS year selection and environmental conditions... 53
MID-RISE WOOD CONSTRUCTIONS – HYGROTHERMAL
MODELLING AND ANALYSIS
S.M. Cornick, M.C. Swinton and K. Abdulghani,
1.
INTRODUCTION
The objective of the Hygrothermal Modelling and Analysis Task was to estimate the risk of moisture damage to the structural elements of a mid-rise wood building. Specifically, the objective was to characterize the risk of moisture damage to the load-bearing wall components of two wall constructions specified in “MID-RISE WOOD CONSTRUCTIONS – Specifications of Mid-rise Envelopes for Hygrothermal Assessment” ReportA1-100035-03.1 [1] due to trapped construction moisture.
2.
METHODOLOGY
The methodology used in the MEWS project [2] was used to assess the potential risk of moisture damage to load-bearing wood wall components. Briefly, the method consists of using a hygrothermal modeling tool to estimate the drying potential of load-bearing wood-based wall components subjected to “worse-case” environmental conditions. Such an approach might be deemed a conservative means of estimating the vulnerability of wood-based components of a structure to the consequences of inadvertent moisture uptake and expected dissipation of the moisture over time. The risk of damage to a component of an assembly due to moisture was assessed on the basis of an accumulation of the relative
humidity-temperature (RHT) index, for this study RHT(92) [3], and the increase or decrease in moisture content at selected points over the course of the simulation period.
A parametric study was conducted for both wall constructions identified in [1] for the climate locations identified in “Climatological Analysis for Hygrothermal Performance Evaluation: Mid-rise Wood” Report A1-100035-03.2 [4]. Specific methods comprising the methodology will be described below.
1K. Abdulghani et al. (2014), “RESEARCH CONSORTIUM FOR WOOD AND WOOD-HYBRID MID RISE
BUILDINGS; Overall Summary Report - Hygrothermal Assessment Mid-rise Envelopes”, Client Report A1-100035-03.1, National Research Council Canada, Ottawa, 49p.
2Kumaran, M. K.; Mukhopadhyaya, P.; Cornick, S. M.; Lacasse, M. A.; Rousseau, M. Z.; Maref, W.; Nofal, M.; Quirt,
J. D.; Quirt, J. D.; Dalgliesh, W. A. (2003),“An Integrated methodology to develop moisture management strategies for exterior wall systems”, 9th Canadian Conference on Building Science and Technology, 27 February 2003, Vancouver, B.C., pp. 45-62, NRCC # 45987
3Wang, J., et al. "Time to initiation of decay in plywood, OSB, and solid wood under critical moisture
conditions." International Conference on Building Envelope Systems and Technology. 2010.
4Cornick, S.M. and M.C. Swinton (2014), “RESEARCH CONSORTIUM FOR WOOD AND WOOD-HYBRID MID
2.1 Approach to Hygrothermal Simulations
Hygrothermal simulations were undertaken using both hygIRC 1D and hygIRC 2D for which the bulk of the simulation runs for this task were undertaken using hygIRC 1D, a 1-dimensional version of the hygIRC 2D, a 2-dimensional tool. The provenance of hygIRC 1D can be found in the following references: [5], [6]. The primary justification for using a 1-dimnesional simulation tool was that the drying out of construction moisture was considered essentially a 1-dimensional phenomenon. Thus in treating the moisture transport processes that occur across the load-bearing wall elements as one dimensional provided a conservative approach to resolving whether there were any potential moisture related problems. Restricting the path for drying to horizontal direction; i.e. to the interior or the exterior, perpendicular to the grain in the case of the Lightweight Wood Frame (LWF), and through the exterior and interior finishes was a reasonable approximation of the phenomenon considering a vertical cross-section through the wall.
The simulation tool selected for the simulation study was hygIRC, a hygrothermal simulation tool developed at the National Research Council’s Construction Portfolio [7]. Experimental validation of the hygIRC simulation tool can be found in “Hygrothermal Modelling Benchmark: Comparison of hygIRC Simulation Results with Full Scale Experiment Results” Report A1-100035-03.6 [8] and “MID-RISE WOOD CONSTRUCTIONS – Comparison of Experimental Results with Hygrothermal Simulation” Report A1-100035-03.X [9].
2.2 Details as Regards Input to 1-Dimensional Simulation Model
2.2.1 Wall models and material properties
Wall models used for the parametric study were based on the constructions recommended in [1] where detailed descriptions of the wall assemblies can be found. The different components for wall cross sections used for the study are provided below in Table 1 for Light Weight Frame construction (LWF) and in Table 2 for Cross Laminated Timber Construction (CLT).
Material property data for the study were obtained as part of the task to characterize material properties and can be found in “Mid-Rise Wood – Characterization of Hygrothermal Properties” Report
A1-100035-03.4 [10]. Hygrothermal properties of materials not included in [10] were obtained from the
5Cornick, S. M.; Maref, W.; Tariku, F. (2009), “Verification and validation: establishing confidence in hygrothermal
in-house database of material properties; these materials are identified in the respective Tables and are marked with asterisks. Detailed wall cross sections for the wall assemblies to be modelled are given in the Appendix A.1. The hygIRC 1D model configuration for the LWF assembly is given in Figure 1 whereas that for the CLT assembly is shown in Figure 2.
Table 1 – Wall layers (exterior to interior) as configured for simulation of the Light Wood Frame Construction (LWF)
Layer / wall component Depth (mm)
Fibre cement board*, 6
Air space not vented*, 13
30min asphalt impregnated paper*, 0.220
30min asphalt impregnated paper*, 0.220
Exterior grade gypsum 13
Western Red Pine 140
Interior Gypsum*, 12.7
Interior Gypsum Primed*, 12.7
Table 2 – Wall layers (exterior to interior) as configured for simulation of the Cross Laminated Timber Construction (CLT)
Layer / wall component Depth (mm)
Fibre cement board*, 6
Air space not vented*, 13
30min asphalt impregnated paper*, 0.220
30min asphalt impregnated paper*, 0.220
Exterior grade gypsum 13
Mineral Fibre Insulation*, 140
Cross Laminated Timber 5-ply 125
Interior Gypsum*, 12.7
Interior Gypsum Primed*, 12.7
Figure 1 – hygIRC 1D wall model for lightweight wood frame construction, not to scale. An asterisk indicates material may be substituted.
Figure 2 – hygIRC 1D wall model for cross laminated timber construction, not to scale. An asterisk indicates material may be substituted.
2.2.2 Modelling assumptions
2.2.2.1
Weather data
Weather was selected using the MEWS method [11] a brief summary of which appears in Appendix A.2. A two-year weather run was assumed for this study. The sequence of weather years chosen for this study was “Wet” then “Average.” The orientation of the wall was in the orientation of predominate wind-driven rain. No preconditioning was assumed in this case. The scenario modelled was that of a building closed up with relatively wet structural members and then allowed to dry. The specific years selected for each location are given in Appendix A.2. The locations used for the parametric study are given in Table 3. The selection of the locations is reported in [4]. Note that Dorval (Montreal) was not included in the original list but was included as an “extra” in the parametric study.
2.2.2.2
Initial conditions
obtained using the appropriate psychrometric calculation as provided in the ASHRAE Handbook of fundamentals [13].
Table 3 – Locations for the parametric study
Location Code MI
Shearwater A. YAW 1.49
Halifax Int'l. YHZ 1.49
Ottawa Int'l. YOW 0.86
Prince Rupert A. YPR 2.84
Quebec A. YQB 1.04
Dorval Int'l.* YUL 0.85
Vancouver Int'l. YVR 1.44
Winnipeg Int'l. YWG 0.58
Toronto Int'l. YYZ 0.84
Yellowknife A. YZF 0.58
* Dorval was not included in [4] but was an extra location added by the authors.
2.2.2.3
Interior conditions
There are two approaches that can be used for selecting the interior conditions. The first is to use
representative measurements. The second is to use a model based on ambient conditions, occupancy, and building characteristics. Although there are data sets of measured data the use of modelled interior conditions was preferred to insure a consistency of approach when considering different geographic locations. A study by Cornick [14] showed that, generally, the models considered for use in this study tended to overestimate the interior moisture levels: the methods were intended for design purposes and are conservative. Of the methods considered the class method ISO 13788 [15] was selected as it required the minimum number of assumptions. For this study the internal relative humidly class for the building type was assumed to be Class 3, a dwelling with low occupancy. For office spaces and shops, Class 2 internal conditions according to the standard, this assumption was conservative. A summary of the method can be found in Appendix A.3.
2.2.2.4
Boundary and other conditions
The exterior and interior Heat Transfer Coefficients (HTC) and Moisture Transfer Coefficients were the same as those used by Tariku [16]. The exterior HTC and MTC were calculated using the weather file using the method found in the ASHRAE Handbook – Fundamentals [17]. The initial values for the exterior HTC and MTC were assumed to be 30 W/m2K and 2.1E-7 s/m, respectively. The values for the
interior HTC and MTC were assumed to be 8 W/m2K and 5.8E-8 s/m, respectively. The absorptivity and
13ASHRAE (2013), Hand book of Fundamentals, Chapter 1, American Society for Heating Refrigeration and air
Conditioning Engineers, Atlanta, GA, USA
14Cornick, S. M. and Kumaran, M. K. (2008), “A Comparison of empirical indoor relative humidity models with
measured data”, Journal of Building Physics, Vol. 31(3), pp. 243-268; NRCC 49235
15DS/EN ISO 13788 - Hygrothermal performance of building components and building elements - Internal surface
temperature to avoid critical surface humidity and interstitial condensation - Calculation methods
16Tariku, F.; Cornick, S. M.; Lacasse, M. A. (2007), “Simulation of wind-driven rain effects on the performance of a
stucco-clad wall”, Thermal Performance of Exterior Envelopes of Whole Buildings X International Conference: 02 December 2007, Clearwater Beach, FL., pp. 1-15; NRCC 49441
emissivity of the materials were set to 0.5 and 0.9 respectively, typical values for common construction materials. Airflow through the walls due to stack effect, ventilation pressure or wind pressure was not modelled.
2.2.2.5
Moisture sources
A moisture source was considered as part of study. The source of moisture was assumed to be a
deficiency in seal around a through wall penetration. Water was assumed to be deposited on the surface of the water resistive barrier; i.e., the first layer of 30-minute paper. The characterization of water entry for the fibre-cement clad walls considered I the study is given in “Mid-Rise Wood Constructions – Investigation of Water Penetration through Cladding and Deficiencies” Report A1-100035-03.3 [18]. Calculation of the amount of water entry was determined using the method recommended in [18]; the water entry function is given in Appendix A.4. For each location a moisture source input file was created, based on the appropriate weather files. The range of Wind-Driven Rain (WDR) values for each location was checked to ensure that it was within the applicable range of the water entry function.
2.2.2.6
Output Focus
Simulation tools can generate an enormous amount of data. The examination of the output was focused on several locations deemed to be critical. The first layer of the wood in the supporting stud in the LWF wall, and the first of wood in the cross-laminated timber in the CLT wall were examined for moisture content and the accumulation of RHT(92)*. For some weather locations the moisture content and accumulated was reported at the midpoint and interior layer of the structural element as well. The total moisture content of the structural element was reported to indict the overall drying behavior of the element.
3.
RESULTS FROM SIMULATION: 1- AND 2-DIMENSIONAL
CONFIGURATIONS
3.1 Results from Preliminary Simulation of 1-Dimensional Configurations
Preliminary simulations were run to establish or verify some of the basic assumptions as regards to the comportment of the wall assembly to climate loads. The preliminary simulations did not feature water entry behind the cladding. Nor did the wall configurations for these preliminary simulations feature an air cavity: i.e. the cladding was direct applied to the sheathing membrane and panel.
All simulations were run for a Vancouver climate using the wet year/average year approach; the following assumptions were used in these preliminary simulations:
Lightweight wood framed construction; Orientation: East;
Years: 1980 and 1988; Start time (assumed close up) was Oct 1st, the sequence was Oct 1st
1980/1980/1988 through to September 30th,
Initial conditions of all materials except structural elements: 10°C and 83% RH, Initial conditions of structural elements: 19% moisture content,
Time step: 3600s,
Interior moisture conditions; ISO 13788 Class 3; low occupancy dwellings. The following variations were considered:
Change in start time from Oct 1stto January 1st, 1980 and run for two years,
Change in orientation from predominate WD direction to north; this direction has little solar radiation impinging on the cladding,
Change of time step from 1 hour to 360s.
The results of these simulations are shown in Figure 3 show the moisture content of the exterior most node of the wood stud. In Canada a north facing façade does not receive direct solar radiation. North facing facades can be cooler than facades with other orientations and consequently may experience prolonged periods with high moisture contents. For certain hygrothermal phenomenon short time steps are required to capture the moisture transfer [5]. Finding the optimal time step speeds up the simulation process; this information was of importance in completing the parametric study. As compared to the base case, neither the variation in time step (360s) nor change in orientation had any significant effect on the wall response. Similar results are shown in
Figure 4 for RHT(92).
The most significant change occurred when the start time was changed from Oct 1stto Jan 1st.
Significantly different values were obtained for the accumulated RHT(92) as is immediately apparent from this figure. However with respect to moisture content it is evident that after a certain number of hours (i.e. 2200 hours) the behaviour at the exterior node of the wood stud is the same for both the Oct 1st
start and Jan 1ststart. The tracks are shifted by 2200 hours or 3 months. Assuming an Oct 1stclose up of
the structure produced a longer period of elevated moisture content as can be seen in RHT(92) comparison in
Figure 4, hence the larger accumulation of RHT.
Figure 4 – Comparison of the accumulated hourly RHT(92) for different preliminary simulation scenarios.
3.2 Results from Simulation of the 1-Dimensional Wall Configurations
A parametric study was conducted for the two wall assemblies described above and for which there was interest in obtaining their response to the climate of those cities given in Table 3. The configuration of the wall assemblies and modelling assumptions are also given above. Three output values were reported: (i) the moisture content at the exterior most node of the structural members, the stud for the LWF wall and the cross-laminated timber for the CLT; (ii) the total moisture content for the structural member, and; (iii) the accumulated value of RHT(92) at the exterior most node of the structural members.
3.2.1 LWF Construction
For the LWF construction the 1-dimensional results are summarized in Table 4 (column labelled Air), and in
Figure 5 to
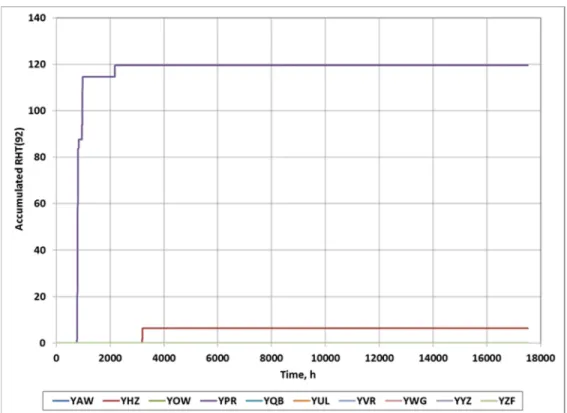
Figure 8. This case represents a section through the wall where there was a clear cavity behind between the cladding and sheathing membrane. The information provided in Table 4 shows that except for the wettest locations in the study, Prince Rupert and Halifax, there was no accumulation of RHT(92) over the simulation period. For the two wettest locations there was a small accumulation of RHT(92) that
occurred during the early part of the first simulated year however after the initial accumulation there were no more hours where the critical conditions were met; this is shown in
Figure 5.
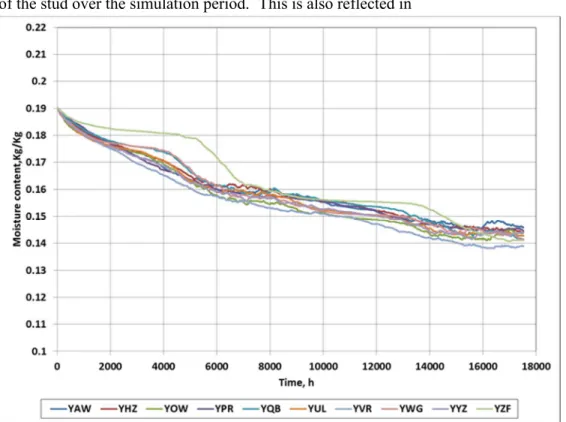
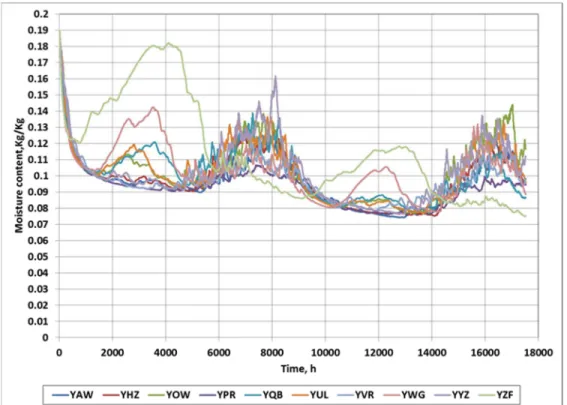
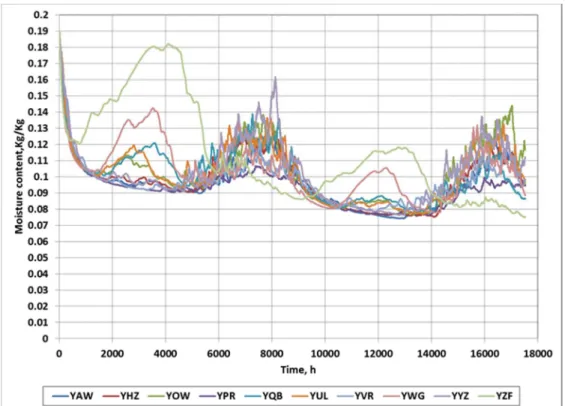
Figure 6 shows the moisture content (kg of water/kg dry weight) for the exterior most node of the stud in the model (see Figure 1) for all locations simulated in the study. Simulation results show that the first layer of wood was quite sensitive to variations in environmental conditions, more specifically:
temperature, atmospheric moisture, and precipitation. However in general there was a drying trend over the two year simulation period despite the large fluctuations in moisture content.
A clearer picture of the trends can be seen in Figure 7 which shows the moisture content for the exterior node for a 30-day running average. All locations, including the four wettest locations (i.e. Prince Rupert BC (YPR), Halifax NS (YHZ), Shearwater NS (YAW) and Vancouver BC (YVR)), show steady drying
of the stud over the simulation period. This is also reflected in
Figure 8 which shows the total moisture content of the stud over the simulation period.
Table 4 – Accumulated value of RHT(92) LWF; hourly basis Location RHT(92) Air StrappingRHT(92)
Shearwater A. 0 29 444 Halifax Int'l. 6.4 161 942 Ottawa Int'l. 0 28 931 Prince Rupert A. 120 348 480 Quebec A. 0 74 020 Dorval Int'l.* 0 23 315 Vancouver Int'l. 0 146 583 Winnipeg Int'l. 0 2 544 Toronto Int'l. 0 14 137 Yellowknife A. 0 9 077
* - Dorval was not included in [4] but was an extra location added by the authors.
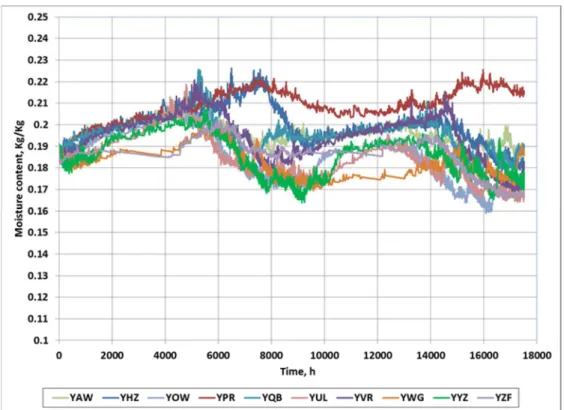
A second set of simulations were run where the air gap was replaced with strapping. The strapping was assumed to have an initial moisture content of 18% by weight. There was no water entry for this case as it would be unreasonable to assume that water had penetrated underneath the strapping. When the air
space was replaced with 13mm wood strapping (western red pine in this case) the simulation results were
Figure 10, Figure 11 and
Figure12). Although the studs appear to dry out when the total moisture content is examined in fact the moisture content of exterior node of the stud was significantly higher for most the of the simulation period when compared to the air gap case. Consequently there was a substantial accumulation of RHT similar to the direct applied cases in the preliminary study (see
Figure 9 and Table 4, column labelled Strapping).
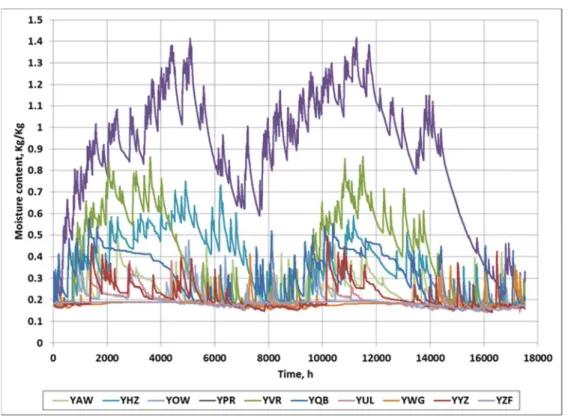
In most cases the moisture content of the strapping was well above 20% moisture content for the duration of the simulation period (see
Figure12). Reducing the initial moisture content of the strapping from 18% to 15% for a test simulation using Vancouver weather data did not significantly change either the moisture performance in the stud or the strapping.
Figure 5 – Hourly accumulation of RHT(92) for LWF construction for study locations.
Figure 6 – Moisture content at the exterior node of the stud for LWF construction for study locations.
Figure 7 – 30-day running average moisture content at the exterior node of the stud for LWF construction for study locations.
Figure 8 – Total moisture content of the stud for LWF construction for study locations.
Figure 9 – Hourly accumulation of RHT(92) for LWF construction (strapping case) for study locations.
Figure 10 – Moisture content at the exterior node of the stud for LWF construction (strapping case) for study locations.
Figure 12 – Total moisture content of the strapping for LWF construction for study locations
3.2.2 CLT Construction
The results from simulation of the 1-dimensional configuration of the CLT construction are summarized in Table 5 (Air/Insul) column and in Figure 13 – Moisture content at the exterior node of the stud for CLT construction, all locations.
Figure 14 – 30-day running average moisture content at the exterior node of the stud for CLT construction, all locations.
Location RHT(92) Air/Insul RHT(92) Air/Stud RHT(92) Strap/Stud Shearwater A. 0 - -Halifax Int'l. 0 0 0 Ottawa Int'l. 0 - -Prince Rupert A. 0 0 0 Quebec A. 0 - -Dorval Int'l.* 0 - -Vancouver Int'l. 0 0 0 Winnipeg Int'l. 0 - -Toronto Int'l. 0 - -Yellowknife A. 0 -
-* - Dorval was not included in [4] but was an extra location added by the authors.
Figure 13 – Moisture content at the exterior node of the stud for CLT construction, all locations.
Figure 14 – 30-day running average moisture content at the exterior node of the stud for CLT construction, all locations.
shows the moisture content (kg of water/kg dry weight) for the exterior most node of the cross laminated timber component (see Figure 2) for all locations simulated in the study. Simulation results show that unlike the response of the exterior most node of the stud of the LWF configuration, the first layer of cross laminated timber was not as sensitive to the variations in environmental conditions as was the case for the LWF assembly. The response of the CLT assembly was damped by the mass of the wall outboard of the
Figure 15 and Figure 16.
Two variations of the air and insulation cross section, case AI, were also analysed; a cross-section with strapping in place of the air gap and a stud in place of the mineral fibre insulation, case SS, and a cross-section with an air space and a stud in place of the mineral fibre, case AS. Prince Rupert (YPR), Halifax (YVR), and Vancouver (YVR) weather data was used for these cases, the wettest locations in the study. Although the studs and strapping case slow the drying of the cross-laminated timber the CLT nevertheless
Figure 17). Simulated moisture contents of the stud and strapping showed the same response as in the LWF cases. Compare
Figure 17 through Error! Reference source not found.with
Figure 13 – Moisture content at the exterior node of the stud for CLT construction, all locations.
Figure 14 – 30-day running average moisture content at the exterior node of the stud for CLT construction, all locations.
Figure 16 – Moisture content at the exterior node of the CLT portion of the wall for various cross-sections, Stud/Strap (SS), Air/Stud (AS), and Air/Insulation (AI).
Figure 18 – Moisture content at the exterior node of the stud portion of the wall for various cross-sections, Stud/Strap (SS), and Air/Stud (AS)
Figure 19 – Total moisture content of the stud portion of the wall for various cross-sections, Stud/Strap (SS), and Air/Stud (AS)
Figure 20 – Accumulated RHT(92) at the exterior node of the stud portion of the wall for various cross-sections, Stud/Strap (SS), and Air/Stud (AS)
3.2.3 Sheathing substitutions: Plywood sheathing and exterior grade gypsum
For two locations, Prince Rupert and Vancouver, simulations were undertaken in which treated plywood was substituted for the exterior grade gypsum sheathing panel for the configuration of the wall assembly. The purpose of the substitutions was to examine whether the moisture content of the structural members would be affected by replacing the exterior gypsum with plywood.
The two types of plywood investigated were: Dricon* or Plywood 1 (P1) and D-Blaze* or Plywood 2 (P2). Material properties for these plywood sheathing panels, each of which had a thickness of 13 mm, can be found in [10].
Undertaking these variations comprised a total of 8 simulation runs and included: 2 locations, 2 wall constructions, and 2 plywood types. The wall assemblies were configured without strapping and the results of simulations were subsequently compared with configurations likewise having no strapping for assemblies incorporating exterior grade gypsum as sheathing panel.
3.2.3.1 LWF Construction
Figure 22 shows the 30-day running moisture content at the exterior node of the stud for the LWF wall configuration. Results from simulation of the wall assembly subjected to the climates of both Vancouver (YVR) and Prince Rupert (YPR) are shown. Switching the sheathing in the wall assembly from gypsum (EG) to plywood (P1 and P2) damped of the response of the wall stud in the LFW assembly.
Overall the drying trend was the same for all cases over the simulation period. This is shown in Figure 23 in which is given the variation in total moisture content of the stud over the course of the simulation. The accumulation of RHT(92) at the exterior node of the stud for LWF assembly was zero in all cases indicating that there was no increased risk to the wall stud by replacing the exterior gypsum sheathing panel with plywood sheathing (Table 6) for the no strapping case. For the case with strapping a single run for Vancouver was done to examine the effect of the strapping on the moisture performance of the stud. As before the response of the stud was damped in the plywood wood cases but otherwise the moisture content of the stud remained the same. The total moisture content of the plywood sheathing still remained high.
Table 6 – Accumulated value of RHT(92); hourly basis Case Vancouver Int'l. Prince Rupert A. LWF Exterior Gypsum 0 0 Plywood P1 0 0 Plywood P2 0 0 CLT Exterior Gypsum 0 0 Plywood P1 0 0 Plywood P2 0 0
Figure 22 – 30-day running average moisture content at exterior node of wood stud for LWF construction, EG – exterior gypsum, P1 and P2 – plywood 1 and 2 respectively.
3.2.3.2. CLT Construction
Figure 24 shows the 30-day running moisture content at the exterior node of the CLT in the CLT wall configuration and for which is provided the response of the wall assembly subjected to the climates of both Vancouver and Prince Rupert. Exchanging the exterior grade gypsum sheathing for plywood has little effect on the moisture content at the exterior node of the CLT given that the CLT is isolated from the exterior sheathing by 140mm of mineral fibre insulation. Over the simulation period the drying trend is, for the most part, identical to that of a wall having gypsum sheathing. This is evident in Figure 25, in which is shown the variation in total moisture content of the CLT over the course of the simulation. The
accumulation of RHT(92) at the exterior node of CLT was zero in all cases (Table 6); hence no increased risk to the CLT by replacing the exterior gypsum with plywood.
As was evident for the LWF construction, for the simulations in which plywood sheathing replaced gypsum panels, the response of the CLT was damped and otherwise the moisture content of the CLT remained the same; however, the total moisture content of the plywood sheathing still remained high.
3.2.3.2. Moisture Performance of the Substitute Sheathings
When the moisture contents of the sheathing panels, that is both types of treated plywood panels and the exterior grade gypsum, were examined a different picture emerged. All the sheathing panels showed elevated levels of moisture content. This was not surprising considering that Vancouver and Prince Rupert have wet climates featuring a considerable amount of year-round rainfall and an overall high level of ambient relative humidity.
Figure 26 shows the moisture content over the course of the simulation for the LWF wall assembly undertaken for Vancouver and a comparable plot, in
Figure 28 and
Figure 29 for the CLT wall assembly.
In both these figures the moisture content of the exterior sheathing panel is provided at three points: the exterior, middle, and interior node. Note that although the moisture content of the gypsum (EG) appeared quite low in comparison to the plywood sheathings (P1 and P2) the equivalent relative humidity at equilibrium for the gypsum is quite high, i.e., 80% RH and above. The significance of this was that when
Table 7. The value of RHT(92) provided in Table 7 is, however, pertinent to assessing the risk of wood-based materials – not that of gypsum. It should be noted that the results are for the case without strapping and hence these configurations should promote drying of the plywood sheathing panels.
The results of the 1-dimensional simulations indicted that although the substitution of plywood for exterior gypsum did not increase the risk of moisture damage to the structural elements, the sheathing panel itself was at risk in these two locations. Of importance, however, is that these outcomes as relate to the increased risk of high moisture content in wood panels were based on results derived from
1-dimensional simulations. No provision was made for the drying of sheathing panels between the studs in either the LWF or CLT case. Consequently the results provided here are localized and conservative.
Figure 24 – 30-day running average moisture content at the exterior node of CLT, EG – exterior gypsum, P1 and P2 – plywood 1 and 2 respectively.
Figure 25 – Total moisture content of CLT, EG – exterior gypsum, P1 and P2 – plywood 1 and 2 respectively.
Figure 26 – Moisture content at the exterior, middle, and interior node of the sheathing for LWF wall constructions for Vancouver BC, LWF.
Figure 27 – Moisture content at the exterior, middle, and interior node of the sheathing for LWF wall constructions for Prince Rupert BC
Figure 28 – Moisture content at the exterior, middle, and interior node of the sheathing for CLT wall constructions for Vancouver BC.
Figure 29 – Moisture content at the exterior, middle, and interior node of the sheathing for CLT wall constructions for Prince Rupert BC.
Figure 30 – Hourly accumulated RHT(92) of the exterior of the sheathing material for LWF and both plywood options and exterior gypsum for Vancouver and Prince Rupert.
Table 7 – Accumulated value of RHT(92); hourly basis Case Vancouver Int'l. Prince Rupert A. LWF Exterior Gypsum 5134 19369 Plywood P1 1704 9368 Plywood P2 1996 9529 CLT Exterior Gypsum 23736 34509 Plywood P1 14822 27214 Plywood P2 15444 32359
3.3 Results from Simulation of 2-Dimensional Wall Configuration
Two-dimensional analysis was carried out to verify the results of the 1-dimensional simulations; both the CLT and LWF wall assemblies were modeled. Two locations, Vancouver BC (YVR) and Prince Rupert BC (YPR), were selected for comparison. Both locations are wet locations with Prince Rupert being the more severe of the locations considered as regards the management of moisture in wall assemblies. Two other drier locations Quebec City and Toronto were modelled to explore possible trends.
The models differ from the 1-dimensional models in that both cross sections are in plan; these cross sections are shown in Figure 32 and Figure 33. The sections represent half a stud space through the opaque portion of a wall. A small 2mm gap was included to simulate the effect of a vented cavity. Three wall sheathings were considered: exterior grade gypsum (EG) and two types of treated plywood, here referred to as Plywood 1 (P1) and Plywood 2 (P2).
A total of
16 2-dimensional
simulations were completed. Sheathing substitutions were not investigated for the Quebec City and Toronto locations. The boundary conditions and assumptions were the same as those taken for the 1-dimensional simulations. There was no heat, air, and moisture transfer assumed at the top and bottom boundaries due to symmetry. In analyzing the results the total moisture content (TMC) of the structural element, the stud in the LWF case and the CLT in the CLT case, were reported as was the moisture content at the exterior node for the structural elements. In the case of the LWF wall construction the exterior bottom node shown in Figure 32 was selected as the focus. For the CLT case the point of interest was the exterior node at the bottom of the join between the exterior stud and CLT, shown in Figure 33. Similar results were reported for the sheathing material.Figure 33 – Model with vented cavity two dimensional cross section of CLT wall, section is in plan, not to scale. The asterisks indicate that the material may be substituted for.
3.3.1 Results of simulation of the 2-dimensional wall configuration for
Light wood framing (LWF)
The results of the 2-dimensional analysis indicated that the stud in the LWF construction dries out. This can be seen in the contour plots shown in Figure 34. It should be noted that the moisture content of the exterior layer of the stud tends to remain elevated. Figure 35 shows the total moisture content of the stud. The upper group of the four drying curves show the results for 1-dimensional variations, specifically 13mm air space with water entry (1D Stud AIR WE), and 13mm strapping without water entry (1D Stud
STR NE). The 2-dimensional results are labelled 2D STR WV and represent a vented 13mm cavity with water entry with strapping but without water entry behind the strapping.
Figure 36 shows the moisture content at the exterior node of the stud towards the bottom of the intersection between the strapping and the stud. The exterior surface of the stud in the 2-dimensional cases lies in between the strapping and no strapping case of the 1-dimensional models. There was some more drying taking place but the strapping was still prevented the stud from drying out quickly.
Figure 37 that there was a significant drop in RHT for the 2-dimensional cases over the 1D strapping case. In all cases the total moisture content of the strapping was high (see
Figure 37). 2-dimensional simulations also show that there was no further accumulation of RHT after the first year, unlike the 1D strapping cases. This is shown in
Figure 38. It should be noted that the initial moisture content of the strapping was high, 18%. A few simulations runs were conducted with a lower value for initial moisture content, 15%. The lowered initial moisture content did not show a significant improvement in moisture performance. The 2-D simulations, although limited in number, confirm the results of the 1-dimensional analysis. The results lie between the worst case scenario of modelling through the strapping and the best case scenario of modelling through the air gap.
Figure 34 – Distribution of moisture content for the LWF wall model at time, 0, 7, 180, 365, 545, and 730 days for Vancouver.
Figure 35 – Total moisture content as a function of time showing moisture dissipation of stud for LWF construction for Vancouver (YVR) and Prince Rupert (YPR).
Figure 36 – Moisture content as a function of time of stud at exterior node located at bottom of intersection between strapping and stud for LWF constructions.
Figure 37 – Total moisture content of the strapping for 2D configurations of LWF constructions in Vancouver and Prince Rupert.
3.3.2 Results of simulation of the 2-dimensional wall configuration for
Cross-laminated timber framing (CLT)
The results of the 2-dimensional analysis indicate that the cross laminated timber in the CLT construction dries out. This can be seen in the contour plots shown in Figure 39. It should be noted that, like the LWF construction, the moisture content of the exterior layer of the stud tends to remain elevated.
Figure40shows the total moisture content of the exterior edge of the cross-laminated timber. The upper group of the four drying curves show the results for 1-dimensional variations, specifically the cases with strapping and stud (SS) and an air gap and a stud (AS). The lower two cases are for the air and insulation 1D case (AI). The 2-dimensional results labelled 2D CLT STR WV and represent a vented 13mm cavity with strapping without water behind the strapping. The 2-dimensional results fell between the worst 1D and best 1-dimnesional cases. In in all the 2-dimensional simulations there was no accumulation RHT at the exterior of the cross-lamented timber.
Figure41shows the moisture content at the exterior node of the cross-laminated timber towards the bottom of the intersection between the CLT and the stud. The exterior surface of the CLT in the 2-dimensional cases lies in between the strapping/stud an air/strapping and no strapping case of the 1-dimensional models. In all modeling cases the risk to the CLT portion of the wall is minimal with no simulations showing any accumulation of RHT.
When the moisture content of the stud and strapping was considered the results were essentially the same as in the LWF cases. This was not unexpected since both wall models were essentially the same from the insulation layer out towards the exterior; compare Figure 32 and Figure 33. The difference between the CLT and LWF wall model was an added CLT layer exterior layer outboard of both sheets of interior gypsum and the substitution of mineral fibre for spray polyurethane. The moisture center at the exterior surface of the stud was high and showed an accumulation of RHT in all case except in the air/strapping
1-dimensional case; essentially a repeat of the LWF air cavity case. Compare
Figure41to Figure 45 for the CLT cases with Figure 35 to
Figure 38 for the LWF cases. The only significant difference was in the total moisture content of the stud of the period of the simulation. While the exterior layer of the stud behaved in a similar fashion to the
Figure 39 – Distribution of moisture content for the CLT wall model at time, 0, 7, 180, 365, 545, and 730 days for Vancouver.
Figure 41 – Moisture content as a function of time of the CLT at exterior node located at bottom of intersection between CLT and stud.
Figure 42 – Total moisture content as a function of time showing moisture dissipation of stud for CLT construction for Vancouver (YVR) and Prince Rupert (YPR).
Figure 43 – Moisture content as a function of time of stud at exterior node located at bottom of intersection between strapping and stud for CLT constructions.
(a)
(b)
Figure 45 – (a) Accumulated RHT(92) for the stud derived from 1- and 2-dimensional simulations for CLT constructions, (b) Progression of accumulated RHT(92) at the exterior face of the stud in the CLT construction for Toronto (YYZ), Quebec City (YQB), Vancouver (YVR), and Prince Rupert (YPR).
3.3.3 Sheathing substitutions: Plywood sheathing and exterior grade gypsum
Similar to the 1-dimensional cases simulations were undertaken in which treated plywood was substituted for the exterior grade gypsum sheathing panel for the configuration of the wall assembly. The same two locations were selected, Prince Rupert and Vancouver. Undertaking these variations comprised a total of 8 simulation runs using the models shown in Figure 32 and Figure 33. The purpose of the substitutions was to examine whether the moisture content of the structural members would be affected by replacing the exterior gypsum with plywood. The simulation matrix comprised 8 runs, 2 wall types, 2 locations, and 2 substitute sheathings. The results were similar to the results of the 1D simulations.
With respect to the structural elements there was no change in the risk of moisture damage to the cross-laminated timber element of the CLT wall. The accumulated RHT at the exterior nodes of the CLT was zero in all cases (Table 8). RHT was calculated at the exterior nodes for material in question. The temperature and moisture content of the nodes corresponding to the horizontal layer of the strapping were averaged for the RHT calculation. For the LWF construction the substitute of plywood for gypsum reduces the accumulation of RHT at the exterior surface of the stud although the risk is not reduced to zero (.
Case Vancouver Int'l. Prince Rupert A. Quebec City Toronto CLT
Exterior Gypsum 0 0 0 0
Plywood P1 0 0 -
-Plywood P2 0 0 -
-Table 9).
With respect to the non-structural elements, strapping, sheathing, and stud in the CLT construction substituting plywood for gypsum has no effect on the performance on the strapping as shown in .
Case Vancouver Int'l. Prince Rupert A. Quebec City Toronto LWF
Exterior Gypsum 2631 14404 3.8 337
Plywood P1 32 12957 – –
CLT
Exterior Gypsum 0 0 0 0
Plywood P1 0 0 -
-Plywood P2 0 0 -
-Table 9). Finally in all cases the accumulated RHT in the sheathing showed there was a risk of moisture damage to the sheathing (.
Case Vancouver Int'l. Prince Rupert A. Quebec City Toronto LWF Exterior Gypsum 246804 235150 192939 129045 Plywood P1 251851 234861 – – Plywood P2 248657 236254 – – CLT Exterior Gypsum 237667 233743 182669 115092 Plywood P1 235488 236429 – – Plywood P2 235488 243507 – – Table 11).
Table 8 – Accumulated value of RHT(92) of the CLT; hourly basis.
Case Vancouver Int'l. Prince Rupert A. Quebec City Toronto CLT
Exterior Gypsum 0 0 0 0
Plywood P1 0 0 -
-Plywood P2 0 0 -
-Table 9 – Accumulated value of RHT(92) of the stud; hourly basis.
Case Vancouver Int'l. Prince Rupert A. Quebec City Toronto LWF Exterior Gypsum 2631 14404 3.8 337 Plywood P1 32 12957 – – Plywood P2 380 14174 – – CLT Exterior Gypsum 31318 45690 5160 425 Plywood P1 26195 94742 – – Plywood P2 27575 80852 – –
Table 10 – Accumulated value of RHT(92) of the strapping; hourly basis. Case Vancouver Int'l. Prince Rupert A. Quebec City Toronto LWF Exterior Gypsum 246804 235150 192939 129045 Plywood P1 251851 234861 – – Plywood P2 248657 236254 – – CLT Exterior Gypsum 237667 233743 182669 115092 Plywood P1 235488 236429 – – Plywood P2 235488 243507 – –
Table 11 – Accumulated value of RHT(92) of the sheathing; hourly basis. Case Vancouver Int'l. Prince Rupert A. Quebec City Toronto LWF Exterior Gypsum 28815 49158 11495 2615 Plywood P1 32467 80091 – – Plywood P2 38546 79590 – – CLT Exterior Gypsum 88477 112155 30055 7925 Plywood P1 110922 201580 – – Plywood P2 107860 195599 – –
4.
DISCUSSION
It should be noted that for this simulation study the assumptions were conservative. The assumption of 19% moisture content for the structural elements and similarly high moisture contents for other wooden elements was a conservative assumption and a worst case scenario. Also of note is that the exterior boundary conditions chosen were also severe, the 1/ in 30 wet year for the exterior boundary was chosen for the first year after close up. Also the modelling of interior conditions was conservative with respect
performance would also be improved for all locations that do not show an increase in moisture content or accumulated RHT in the second year, at least with respect to simulation. This work however was not in scope of the work.
Finally, a note on the interpretation of RHT results is in order. Since accumulated RHT is akin to calculating the area under the moisture content or RH curves it should be noted that small changes in moisture content or RH over time can result in a significant accumulation of RHT. Figure 46 (a) and (b) shows variations on two cases, the first being a variation on the psychrometric calculation of air
properties, and the second a variation of wall construction. In Figure 46 (a) the RH of air is calculated in one case using ASHRAE pyschrometric calculations (Air 24) and in the other case using an assumed sorption/desorption isotherm (Air 199). The latter method was used if a simulation could not converge or sometimes to decrease the simulation run times. Notice that the moisture content reported in either case was similar there is a significant difference in RHT(92). In Figure 46 (b) the difference between the time series was wall construction; LWF vs. CLT. Again the response was similar though in this case the CLT appeared to take longer to dry. The difference in accumulated RHT(92) however is an order of
magnitude. Rather than concentrating on the actual RHT value it is better to using the presence of accumulated RHT to indicate a potential risk of damage.
4.1 LWF
With respect to lightweight frame construction (LWF) and based on the results derived from the 1-D and additional 2-D simulations, the following can be stated:
Overall the performance of LWF wall as modelled was marginal and the design should not be used in wet locations (MI ≥ 1) and is potentially risky in drier locations (MI < 1) as well. For wetter locations, such as Quebec City (MI = 1.08), there was a steady accumulation of moisture and RHT past the first year of simulation whereas the other locations showed no further accumulation of RHT past the first year. For the stud or structural element:
1-D analysis showed that when the cavity behind the cladding has strapping there was an
difficulty appears to be the presence of wood strapping which if wet does not permit the stud to dry
effectively (see Figure 9).
Although the 1-D analysis showed that this design may work in wetter locations if the cavity behind the cladding is clear, the performance of the system in terms of drying is marginal at best for locations such as Vancouver, Prince Rupert and Halifax. Even without the strapping the performance of walls for locations having a MI ≥ 1.4 it was evident that a small or modest increase in moisture content can lead to accumulations of RHT(92) index deemed to indicate a risk of damage to the wood-based components (see
Figure 5 and Figure 38).
2-D analysis showed that there was some limited drying potential through the exterior sheathing, the exterior gypsum. However the presence of strapping still resulted in an accumulation of RHT for locations such as, of Prince Rupert (MI = 2.84), Vancouver (1.44), Quebec City (1.08), and Toronto
(0.86). This can be seen in