Goran Gržinić, Thorsten Bartels-Rausch, Mario Birrer, Andreas Türler, and Markus Ammann*
Production and use of
13
N labeled N
2
O
5
to
determine gas–aerosol interaction kinetics
Abstract: Dinitrogen pentoxide has aroused significant
in-terest in atmospheric chemistry because of its importance in the night time chemistry of nitrogen oxides to influence the tropospheric oxidation capacity. We have used an es-tablished method of13Nproduction to synthesize13N la-beledN2O5for the first time in order to studyN2O5 up-take kinetics on aerosol particles.13Nis producedvia the
16O(𝑝, 𝛼)13Nreaction in a gas target attached to the IP2
endstation of the Injector 2 cyclotron at PSI. The13NO pro-duced in the gas target is transported to a laboratory where it is mixed, under dry conditions, with non-labeled NO andO3 in a gas reactor, giving13NNO5. TheN2O5thus produced is fed into an aerosol flow tube together with a humidified aerosol gas flow. The gaseous species present in the resulting gas flow are selectively separatedvia a nar-row parallel plate diffusion denuder system, while aerosol particles can be trapped on a particle filter placed at the end of the denuder system. The activity of the13Nlabeled species trapped on the denuder plates and in the particle filter can be monitoredvia scintillation counters. A system for the routine online production of13NlabeledN2O5has been assembled and used to assess the conformity of the results by kinetic modeling of gas phaseN2O5chemistry, showing good agreement. A few exemplary experiments of uptake of labelledN2O5to ammonium sulfate and cit-ric acid particles are presented that are in good agreement with results obtained with other methods reported in the literature.
Keywords: N2O5, Nitrogen-13, Aerosols, Kinetics, Atmo-spheric Chemistry.
*Corresponding author: Markus Ammann, Laboratory
of Radiochemistry and Environmental Chemistry, Paul Scherrer Institute, 5232 Villigen, Switzerland, e-mail: [email protected]
Thorsten Bartels-Rausch, Mario Birrer: Laboratory of
Radiochemistry and Environmental Chemistry, Paul Scherrer Institute, 5232 Villigen, Switzerland
Goran Gržinić, Andreas Türler: Laboratory of Radiochemistry and
Environmental Chemistry, Paul Scherrer Institute, 5232 Villigen, Switzerland; and Department of Chemistry and Biochemistry, University of Bern, 3012 Bern, Switzerland
DOI 10.1515/ract-2014-2244
Received December 20, 2013; accepted June 10, 2014
1 Introduction
During the last two decades the compoundN2O5has been the topic of many studies in the field of atmospheric chem-istry due to its significant role in the nighttime tropo-sphericNOxchemistry. Its formation starts with oxidation ofNO2toNO3radicals by ozone (R1) followed by a reac-tion withNO2that yieldsN2O5(R2).
NO2+ 𝑂3 → NO3+ O2 (R1)
NO3+ NO2 N2O5 (R2)
Daytime formation of N2O5 is inefficient because of the short photolytic lifetime of NO3 (∼1 s); however, dur-ing the night N2O5 can reach concentrations of up to
10–15 ppb in polluted atmospheres and thus may play an important role in nighttime tropospheric chemistry [1]. During nighttime the concentration of N2O5 (as well as
NO3 andNO2) is controlled by the equilibrium
estab-lished betweenN2O5formation andN2O5loss due to ther-mal decomposition (R2).
The importance ofN2O5stems from its role as aNO3 radical reservoir as well as being a major sink for NOx species due to the fast heterogeneous hydrolysis reaction with water molecules (R3) on aerosol and ice surfaces [2,
3].
N2O5+ H2O → 2HNO3 (R3) Particle phase nitric acid formedvia this heterogeneous re-action may then be removed from the atmospheric cycle
via wet or dry deposition. Due to the equilibrium that
ex-ists betweenNO2,NO3andN2O5, removal of the latter reduces the first two which leads to a reduction of tropo-spheric ozone, thus lowering the oxidizing capacity of the troposphere [1,4,5].
Because of the impact ofN2O5 on ozone formation and the effect that removalvia hydrolysis on aerosol par-ticles has on the overall budget, uptake kinetics ofN2O5 on aerosols have been an important topic of study. The
loss rate of N2O5 to aerosol particles is determined by the available surface area and the efficiency of the gas phase-aerosol interaction process. It is characterized by the uptake coefficient𝛾, defined as the probability that a gas kinetic collision of a molecule leads to its up-take at the interface. Studies have been conducted on various types of aerosol particles such as NaCl/sea salt aerosols [6], ammonium sulfate or nitrate particles [7–9], organic aerosols [10], mineral dust [2, 11] and soot [12]. Various detection methods have been used; Cavity Ring-Down Spectroscopy (CRDS) [13] and Chemical Ionization Mass Spectrometry (CIMS) [14] have been particularly pop-ular. CRDS is an optical method that uses a dye laser to inject a laser beam between two mirrors of high reflectiv-ity placed in a cavreflectiv-ity. The concentration of the analyte is determined by monitoring the decay of the laser intensity within the cavity with time, the decay rate being directly proportional to the species concentration (in this case
NO3). Thermal conversion ofN2O5toNO3in a second, heated channel provides simultaneous measurements of the sum ofNO3andN2O5. The method provides very low detection limits (down to the1–5 pptvrange), and allows for parallel measurements ofNO3andN2O5. It can oper-ate at ambient pressure and is relatively compact and thus suitable for field studies. CIMS is based on a selective ion-ization process resulting from a reaction between a reagent ion and the analyzed species followed by mass spectrom-etry of the resulting ions. Also this method is highly sen-sitive (10 pptvrange) and the reagent ion used forN2O5 studies (I−) is reasonably specific for eitherNO3orN2O5, ionizing both species toNO3− detected at62 amu. The principal drawback of the method is that it cannot differ-entiate betweenNO3andN2O5, and under typical oper-ating conditions often non negligible background noise at
62 amuappears.
While the above mentioned measurement methods have many advantages, they still present some disadvan-tages that are non negligible, such as difficult operation under high relative humidity or the fact that in laboratory studiesN2O5uptake by aerosol particles can only be de-rived by following its loss from the gas phase. Instead, we have used the short lived13Nradioactive tracer technique developed at the Paul Scherrer Institute [15,16]. This tech-nique has been used already to study the uptake kinetics of other nitrogen oxides such asHNO3[17] andNO2[18] to aerosols and ofNOy to ice surfaces [19–21], by label-ing them with13N, a short-lived isotope with a half-life of10 min.13Nis well known as a positron emitter and also used in positron emission tomography (PET) for med-ical purposes [22]. In our application, we trace uptake in the particulate phase by monitoring the radioactive decay
of13NlabeledN2O5absorbed on aerosol particles while working under realistic ambient temperature and humid-ity conditions. In this study we will detail the method of production of13N2O5and the experimental setup to study the uptake kinetics on aerosol particles as well as report a few exemplary measurements on aerosol particles to benchmark against other methods. To our knowledge this is the first time that13NlabeledN2O5has been produced for experimental purposes.
2 Experimental
2.1 General layout of the experiment
Using the shortlived radioactive tracer13Nallows for the study of heterogeneous kinetics under realistic conditions, and experiments can be performed at very low trace gas concentrations (down to a hundred pptv) and in presence of high relative humidity.13Nlabeled NO is mixed withO3 in a first reactor to produce13N2O5, which is then fed into an aerosol flow tube where it can be mixed with aerosols to perform heterogeneous kinetics experiments. The
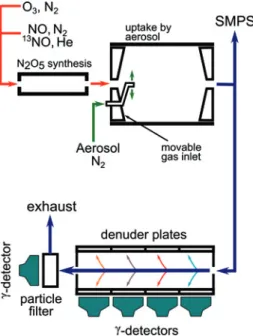
result-Fig. 1: Schematic representation of the experimental arrangement.
N2O5is synthesized in the first reactor. Mixing with aerosol is achieved in an aerosol flow tube with movable inlets which allows to adjust the reaction time. The resulting gas flow is directed into the paralel plate denuder system where 4 sets of plates covered with denuder coatings (citric acid and NDA) are used to selectively separate the gas phase products. The particle phase products are trapped on the particle filter. Gamma detectors are used to monitor the activity of the products. SMPS denotes the scanning mobility particle sizer.
ing flow is then directed into a parallel plate diffusion de-nuder system where the gaseous and particle phase prod-ucts can be selectively separated and trapped on coated denuder plates and a particle filter, respectively. By moni-toring the decay of13Non each trap it is possible to derive simultaneously the concentration of the various13N la-beled species in the gas and particle phase. Figure1shows a schematic diagram of our experimental arrangement.
2.2 Production and transport of
13NO
At the Paul Scherrer Institute13NOhas been produced for the purpose of tracer experiments in atmospheric chem-istry since about two decades. A detailed description of the method has been described earlier [15]. Briefly,13N is producedvia the16O(𝑝, 𝛼)13Nreaction in a gas-target by irradiating16Owith about11 MeVprotons at around
10 𝜇Aintensity. Developed from an earlier design [15], the gas-target is a conically shaped aluminium flow reactor at-tached to the Isotope Production Station IP2 at a branch of the Injector II cyclotron at PSI. The primary proton beam with an energy of72 MeVis passed through a first de-grader to bring the energy down to35 MeV. The window into the 13Ntarget, consisting of two water cooled alu-minium windows, is designed such that the energy of the protons at the entry into the gas volume is further de-graded down to about11 MeV. The further degradation within the gas target depends on pressure, which was kept at2.5 bar, and a continuous1 l/minSTP flow of20% O2in He (all flow rates are given in volumetric flow normalized to standard temperature and pressure) is passed through the target. This pressure was also constrained by other boundary conditions of our experiments and not adjusted to optimize13Nproduction according to the detailed struc-ture of the excitation function for the 16O(𝑝, 𝛼)13N re-action [23,24]. Highly oxidized and reactive forms of ni-trogen oxides are produced and chemically converted to
13NOover a Mo converter (at∼380∘C) connected to the
gas-target in order to facilitate transport. As discussed in our earlier study [15], quantitative13Noutput is difficult to achieve, likely due to chemical losses on surfaces be-fore the Mo converter. Non-labeled nitrogen oxide species (at around 8 ppbv) are also produced from nitrogen im-purities in the carrier gas and likewise converted to NO. Only a very small fraction of the overall NO produced con-tain the tracer atoms (below ppt levels), Additionally, trace amounts of carbon monoxide or carbon dioxide are formed from organic impurities present in the gas feed. The result-ing13NOcontaining gas is then continuously transported
to the laboratoryvia a580 mlong PVDF tube (inner diam-eter4 mm).
2.3 Production of
13N
2O
5In the laboratory, selected amounts of the target gas flow (typically50 ml/min) can be mixed with variable amounts of N2 and certified amounts (1 ml/min) of non-labeled NO from a gas cylinder (10 ppminN2) allowing to cover a wide range of NO concentrations in the ppb range. Pos-sible traces of HONO are removed by using aNa2CO3trap. The 13NO gas flow is directed into theN2O5 reac-tor where it is mixed with a flow (50 ml/min) contain-ing ozone (∼4 ppmvin this reactor) in order to generate
13NlabeledN
2O5via reactions (R1) and (R2).O3is
pro-duced by passing a flow of10% O2inN2over a UV lamp (185 nmwavelength). The N2O5 reactor is covered with a shroud in order to preventNO3photolysis and thus loss ofN2O5. Additionally, in order to minimize losses due to heterogeneous hydrolysis on the walls,N2O5production is conducted under dry conditions, and the walls of the reactor are covered with PTFE foil. The resulting gas flow (101 ml/min) is then fed into the flow tube reactor, where it is mixed with the aerosol flow (720 ml/min).
2.4 Modeling of gas phase
13N
2O
5production
As a support tool for the design of the experiment and to address issues such as the slow formation ofN2O5via re-actions (R4), (R1) and (R2)vs. the radioactive decay of13N with a half-life of10 min, a modeling study of gas phase
N2O5 formation has been carried out. The kinetics was
based on the recommendations of the IUPAC Task Group on Atmospheric Chemical Kinetic Data Evaluation [25] and the NASA Panel for Data Evaluation [26]. Modeling work has been performed in Matlab using ODE (ordinary differ-ential equation) solvers and using temperature, pressure, time, reactor geometry and starting concentrations for NO andO3as input variables. Wall loss was also incorporated into the model. Overall 12 reactions have been included in the model (R4–R15). The rate coefficients listed beside the reactions are given at standard temperature and pressure. In the computer model pressure and temperature depen-dence of the rate coefficients as recommended in the above mentioned data bases has been included.
NO + O3→ NO2+ O2
NO2+ O3→ NO3+ O2 𝑘 = 3.5 × 10⁻¹⁷cm3molecule−1s−1 (R5) NO2+ NO3 → NM 2O5 𝑘 = 8.8 × 10⁻¹¹cm3molecule−1s−1 (R6) N2O5→ NOM 2+ NO3 𝑘 = 6.9 × 10⁻²s−1 (R7) 2NO + O2→ 2NO2 𝑘 = 2.0 × 10−38cm6molecule−2s−1 (R8) NO + NO2→ NM 2O3 𝑘 = 7.66 × 10⁻¹⁵cm3molecule−1s−1 (R9) N2O3→ NO + NOM 2 𝑘 = 3.6 × 10⁸s−1 (R10) NO + NO3→ 2NO2 𝑘 = 2.6 × 10⁻¹¹cm3molecule−1s−1 (R11) 2NO2 → NM 2O4 𝑘 = 1.0 × 10⁻¹²cm3molecule−1s−1 (R12) N2O4→ 2NOM 2 𝑘 = 4.4 × 10⁶s−1 (R13) NO2+ NO3 → NO + NO2+ O2 𝑘 = 6.76 × 10⁻¹⁶cm3molecule−1s−1 (R14) 2NO3 → 2NO2+ O2 𝑘 = 2.42 × 10⁻¹⁶cm3molecule−1s−1 (R15)
The model allowed us to analyze the influence ofO3and NO concentrations onN2O5production and its tempera-ture dependence as well as estimating theN2O5/NO3 ra-tio in the gas phase. The resulting estimates and predic-tions were used in the experimental design phase to opti-mize the production ofN2O5as well as to benchmark our
N2O5production process to the known gas phase kinetic
data.
2.5 Aerosol generation and characterization
The aerosol was produced by nebulizing a 0.7% (by weight) solution of citric acid (HQ, Fluka, >99%) or of
0.69% wt. solution of ammonium sulfate in MilliQ wa-ter by means of an ultrasonic nebulizer. Citric acid was used as a proxy for a generic organic aerosol while ammo-nium sulfate was chosen because of the wealth of exper-imental data already available in the literature. The mist droplets formed were dried by passing the flow through a Nafion membrane diffusion dryer. The sheath gas
out-side the Nafion membrane was humidified such that the resulting aerosol flow had the relative humidity intended for the experiment by avoiding efflorescence of the parti-cles in experiments below the deliquescence relative hu-midity. In order to avoid uncontrolled losses of charged aerosol particles to the insulating walls of tubing and the aerosol flow reactor, the aerosol flow was passed through a85Krion source, to establish an equilibrium charge distri-bution, followed by an electrostatic precipitator removing all charged particles. After that the aerosol flow was fed into the aerosol flow tube.
When aerosol was used in the experiments, measure-ment of its surface area to gas volume ratio was per-formed with a Scanning Mobility Particle Sizer (SMPS). This system consists of a homemade85Krsource to estab-lish charge equilibrium of the aerosol, a differential mo-bility analyzer (DMA, TSI 3071) and a condensation parti-cle counter (CPC, TSI 3022). Since the aerosol water con-tent and consequently the particle diameter and aerosol surface to volume ratio strongly depend on relative hu-midity, filtered carrier gas from the flow tube was used as sheath gas in the DMA in order to keep the two flows in equilibrium. Aerosol sampling was conducted at an outlet directly behind the aerosol flow tube, where additionally other instruments such asNOxorO3analyzers could be connected as well.
2.6 Aerosol flow tube
The aerosol andN2O5containing gas flow were mixed to-gether in the cylindrical aerosol flow tube composed of a PFA tube with an inner diameter of7 cm and a mov-able inlet and outlet that allow adjusting the length of the aerosol – gas interaction zone and thus the reaction time inside the flow tube. The gas flow is introducedvia a coni-cally shaped gas inlet along the axis of the flow tube. The aerosol flow is introduced into the flow tubevia a fixed in-jector which protrudes from the side of the conical inlet. The injector is a6 mm diameter Inox steel tube bent in such a way that the injector nozzles are equidistant from the reactor walls and the aerosol flow is injected perpen-dicularly to the gas flow. When the outlet is pushed all the way in to the minimum position inside the flow tube, the reaction time is minimum (∼10 s), while pulling the outlet to the maximum position one can achieve a reaction time of60 s. The flow tube is operated under laminar flow con-ditions and it is assumed that a laminar flow profile is es-tablished a few cm downstream of the aerosol injector. PFA has been chosen in an attempt to minimizeN2O5losses to the wall. While losses are lower than with a glass tube
reac-tor, they are still substantial when operating under humid conditions.
2.7 Detection system
Following the aerosol flow tube, the combined gas flow was directed towards the parallel plate diffusion denuder system. A T-connector was placed between the two in order to allow connecting the SMPS system or aNOxorO3 detec-tor. Upon entering the denuder train the gaseous species (N2O5 and NO2) are separated on different chemically selective coatings by lateral diffusion. The sub-micron aerosol particles have a small diffusivity and pass through the denuder unobstructed with almost100%efficiency. GaseousN2O5 (and the small amounts ofNO3 present) was collected on the first set of denuder plates coated with citric acid, prepared from a 2 wt %solution in50% methanol/water. Citric acid has well documented hygro-scopic properties [27] and mixes well with water, thus facil-itating coating preparation. It also forms a solution down to low relative humidity and thus maintains reactivity also in experiments at low relative humidity. The citric acid coating was applied to the first and second denuder plate set; the former to captureN2O5, the latter to monitor the interference ofNO2 on the citric acid coating. The third and fourth sets of denuder plates were coated with NDA (N-(1-naphtyl) ethylene diamine dihydrochloride) mixed with KOH (1%solution with1%KOH and10% water in methanol). NDA absorbsNO2very efficiently and the ba-sic coating assures that the nitrite product stays on the surface. Two denuder plate sets with NDA were used, be-cause NDA is sensitive to ozone present in our system and is depleted rapidly, so the second denuder plate is used to extend the available experimental time. Fresh coatings were prepared and applied every day. After passing the denuder system, the aerosol particles were captured by a glass fiber filter. 13N decay results in the emission of a positron, which, upon annihilation with an electron, re-sults in the coincident emission of two𝛾-rays in opposite directions. To each trap (the coatings and filter) a sepa-rate CsI scintillator crystal with integsepa-rated PIN diode tector was attached (Carroll and Ramsey, USA), which de-tects the gamma quanta emitted after decay of the 13N atoms. The detector signal is converted to the flux of the gaseous species into the trap using the inversion proce-dure reported earlier [16,28]. This flux is proportional to the concentration of the species in the gas phase. The rel-ative counting efficiency of the various 𝛾-detectors was determined by exposing in turn each of the detectors to a glass fiber filter on which a drop of a22NaIsolution was
deposited, in a way that closely mimics the geometrical configuration at each trap. Additional information about coating preparation, traps and measurement efficiencies can be found elsewhere [15,16].
3 Results and discussion
3.1 Gas phase production of
13N
2O
5Our experiments dealing with production of13N2O5were conducted with a4 minresidence time in theN2O5 reac-tor and1 minresidence time in the aerosol flow tube in order to simulate default operating settings also used for the aerosol experiments reported further below. These set-tings resulted in an NO concentration of99 ppbvand an
O3concentration of∼4 ppmvin theN2O5reactor. The re-sulting gas flow was fed into the flow tube, together with the flow from the aerosol gas line. The ultrasonic nebulizer connected to this gas flow line was turned off (and thus no aerosol was generated) since only gas phase kinetics were studied in this step. The humidity inside the aerosol flow tube was kept at∼27%RH (humidified aerosol gas flow). Figure2shows the resultingN2O5andNO2gas phase sig-nals measured at the parallel plate diffusion denuder sys-tem.
N2O5andNO3are absorbed on the first denuder plate
set coated with citric acid. The second citric acid coated plate set, which is placed after the first, shows theNO2 interference signal on the citric acid coating. Finally, the NDA coated denuder plate set gives theNO2signal. When
13NOand non labeled NO were fed into the system (12:46),
the activity on all coatings increased. The signals originate from the background of13NOdecaying in the gas phase while passing through the denuder system and the filter and from small amounts of13NO2 andHO13NOformed along the flow system that were trapped in the first cit-ric acid coating. WhenO3was turned on for the first time a marked increase of the signal on the first citric acid de-nuder plate set occurred due toN2O5(andNO3, see be-low) that was formed. The signal derived from the second citric acid plate set shows a modest increase that is due to theNO2interference on the citric acid coating. Lastly, the
NO2signal shows a significant increase due to its forma-tion from NO andO3. WhenO3was turned off, theN2O5 signal dropped rapidly while the other two signals did so gradually. The dynamic response of theNO2signal in be-tween is discussed below. The certified NO flow was then doubled to2 ml/min(14:23,196 ppbvin N2O5 reactor) andO3 was turned on again. The signals have a behav-ior similar to the earlier ones, but with an increase in
lev-Fig. 2: Production of gas phase13N2O5: dark blue: first citric acid denuder signal (gas phaseN2O5); light blue: second citric acid denuder signal (NO2interference on citric acid denuder); red: NDA denuder signal (gas phaseNO2).
els that can be attributed to the higher NO concentration (see model calculations below). The plotted signals also give some indication of the transient behavior of the gas phase system. In particular, peaks in theNO2signal can be noticed shortly afterO3was turned on and off. This is due to the kinetics of the reactions involved and in par-ticular (R1), (R2) and (R4). WhenO3 was turned on we observed the fast titration of NO to yieldNO2 (R4). The subsequent reaction ofNO2withO3to giveNO3 (R1) is about 3 orders of magnitude slower than (R4). AsNO2was transformed intoNO3theNO2signal diminished until it reached a steady-state level. WhenO3was turned off, the faster reaction R4 consumed the remainingO3 to effec-tively suppress reaction R1 and thusNO2was no longer converted toNO3. This brought about another increase of theNO2signal before it gradually decreased as the rest of theO3was consumed.
3.2 Comparison with model
In order to obtain a quantitative value for theN2O5 sig-nal measured at the parallel plate denuder system we con-nected aNOxanalyzer (ML 9841A) at the T connector be-hind the aerosol flow tube reactor. In this way we were able to measure theNO2concentration in the system and consequently calculate theN2O5concentration in the gas and particle phase from the13NO2and13N2O5signals ob-served on the denuder plates and particle filter. Thus we were able to calibrate the setup and assign a concentration value to the denuder plate and particle filter signals.
The next step in the process was to evaluate the wall loss in the aerosol flow tube. The wall uptake represents
Fig. 3: Decay plot ofN2O5vs. reactor length fitted to the measured
data using the CKD method.
the loss of gas phaseN2O5due to hydrolysis on the walls of the flow tube. Measurements were performed by vary-ing the flow tube length (residence time) and measurvary-ing the gas phaseN2O5concentration in the reactor at each length. Flow tube lengths from0 cm(10 s) to20 cm(60 s) were evaluated, using the 10 s position as the starting point as shown in the resulting decay plot (Figure3).
The measured, pseudo-first order loss rate constant
𝑘wall was determined to be equal to 9.5 × 10⁻³s−1, giv-ing an effective coefficient of uptake on the wall (𝛾wall) of
2.8 × 10⁻⁶. A correction of the observed uptake rate for
dif-fusion in the gas phase using the Cooney-Kim-Davis (CKD) method was applied [29], which yielded an uptake coeffi-cient of3.7 × 10−6.
Finally, a data comparison of N2O5 formation from
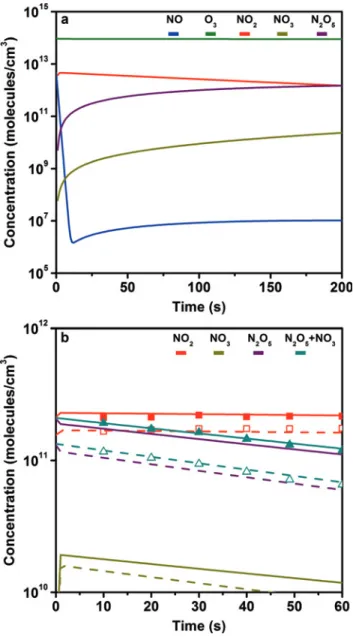
NOandO3 with the model calculation was performed. First, a model calculation was made for theN2O5 reac-tor using the initialNO andO3concentrations therein. The resulting gas phase concentrations obtained from the model (Figure4a) were then corrected for dilution by the aerosol flow into the aerosol flow tube. The model calcula-tions were then performed again, this time for the aerosol flow tube, taking into account the experimentally mea-sured𝑘wall(Figure4b). Thus the whole experimental sys-tem can be accounted for (N2O5reactor+flow tube reac-tor) and modeled as a single entity. The experimental re-sults appear in good agreement with the data obtained from model calculations, although the expected concen-trations were slightly lower than the measured ones. Note that the slope was constrained by the𝑘wallmeasurement
Fig. 4: Gas phase model graphs: (a)N2O5reactor with residence time of195 sec; (b) flow tube reactor with residence time of 60 sec (calculated using the measured𝑘wall). Full lines represent modeled values using196 ppb initial NO concentration, dashed lines using 148 ppb initial NO concentration. The data points represent measured values using initial NO concentrations of196 ppb (full points) and148 ppb (open points).
and thus consistency of the modeled slope with the mea-sured slope forN2O5 with time is not surprising. How-ever, the model estimates the absolute concentration level fairly well. The difference between model and measure-ment is probably at least in part due to the value of𝑘wall (and𝛾wallrespectively) for theN2O5reactor that we used in the model calculations and that remained an adjustable parameter. It should be noted that, as mentioned in the experimental section, it is not possible to distinguish be-tweenN2O5andNO3in the gas phase since both are taken
up efficiently on the denuder coating. The contribution of
NO3to the overall signal depends primarily on tempera-ture, since the decomposition ofN2O5to its precursors is a thermally driven process. At STP theNO3concentration is roughly one order of magnitude lower than that ofN2O5. Figure4b shows this contribution.
The uptake coefficient on the wall for theN2O5 reac-tor was not measured; however, taking into consideration the values obtained for the aerosol flow tube and the fact thatN2O5synthesis is performed under dry conditions, a conservative value in the range of1–5 × 10⁻⁷has been assumed by fitting the model to the experimental data. As mentioned above, this has given good results. Changing the value to10−8 givesN2O5levels slightly above those measured, while theNO2levels show negligible changes. On the other hand, when using a value of10−6, theN2O5 level is lower by roughly a factor of two compared to mea-sured results, while theNO2 levels decrease as well, al-beit not so strongly. As far as the aerosol flow tube is con-cerned, increases in𝛾walland𝑘wall(for example in cases of higher humidity) bring about a strong drop inN2O5levels, whileNO2levels show negligible changes.
3.3 Uptake by aerosol
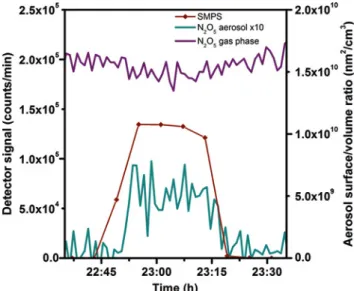
An exemplary measurement of13NlabeledN2O5uptake by citric acid aerosol particles at 27%relative humidity and a N2O5 concentration of ∼5 ppbv is shown in Fig-ure5. When aerosol was fed into the system by switching on the ultrasonic nebulizer, uptake was observed by mea-suring an increase in activity on the particle filter. At the same time the gas phaseN2O5signal slightly decreased, corresponding to a drop in gas phase concentration by
0.31 ppbv. However the resulting aerosol signal accounts for only0.16 ppbvlost from the gas phase. This is the re-sult of the complex interplay of wall loss and uptake by the particles under conditions where the apparent wall loss is larger than the loss to the particles.
By applying the principles of gas-aerosol interaction kinetics (E1), we can analyze the net uptake kinetics from the signal in the aerosol phase and the measured wall loss rate constant in absence of aerosol.
𝐶p(𝑡) 𝐶p(𝑡=0) = 1 − 𝑒−(𝑘w+𝑘p)𝑡 1 +𝑘w 𝑘p (E1)
where 𝐶g(𝑡=0) is the initial gas-phase concentration of
N2O5at time zero,𝐶p(𝑡)is the concentration ofN2O5in the particulate phase,𝑘pis the constant for the heteroge-neous reaction between gaseousN2O5acid and aerosol
Fig. 5:N2O5interacting with citric acid aerosol (295 K, 26% RH): purple: first citric acid denuder signal (gas phaseN2O5); dark yellow: signal from particle filter multiplied by a factor of 10 (particle phaseN2O5or nitrate); dark red: SMPS signal (aerosol
surface/volume ratio).
particles and𝑘wdescribes theN2O5loss to the wall [16]. The heterogeneous rate constant𝑘pis related to the uptake coefficient𝛾according to E2:
𝛾 = 4𝑘p
𝑆p𝜔 𝜔 = √
8𝑅𝑇
𝜋𝑀 (E2)
where𝑆p is the aerosol surface to volume ratio,𝜔is the mean thermal velocity ofN2O5,𝑅is the gas constant,𝑇 is the absolute temperature and𝑀is the molar weight of
N2O5.
In the experiments that were conducted, the surface to volume ratio of the aerosol was varied by changing the set-tings at the ultrasonic nebulizer. From the obtained exper-imental data the value of the uptake coefficient for citric acid at27%RH has been estimated at1.4 ± 0.4 × 10⁻³.
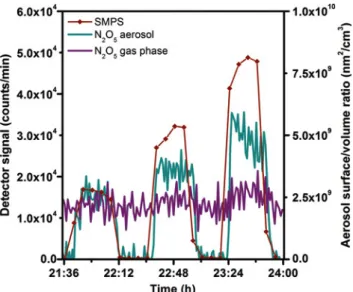
An experiment was also conducted using ammonium sulphate aerosol at52%relative humidity (Figure6). It be-comes immediately apparent that the signal on the par-ticles scales with the aerosol surface area. Since this ex-periment has been performed at higher humidity than the one with citric acid shown above, the background signal of
N2O5in absence of aerosol is lower due to a larger value of𝑘wall. Surprisingly, we observe a small but significant in-crease in theN2O5 (g) signal in presence of aerosol. The characteristic gas – aerosol separation time in the denuder is about30 msper pair of coated plates. Since the time scale for diffusion of a dissolved species through the sub-micron particles is on the order of microseconds, there is
enough time for any dissolvedN2O5to escape and being trapped. However, we also see a corresponding increase of the signal in the second pair of denuder plates we use for assessing theNO2interference. This indicates that there is also a slow process leading to evaporation ofN2O5. The fate of dissolvedN2O5is the disproportionation into
NO2+andNO
3−. It is therefore likely that the slow
evapo-ration ofN2O5out of the particles over time scales of about
100 msor more may be limited by the kinetics of the back reaction ofNO2+andNO3−. There is also the possibility thatHNO3, the product ofN2O5 uptake, is evaporating from the particles [9,30]. In spite of its strong degree of dissociation, a small amount of undissociatedHNO3 ex-ists within the particles that remains in equilibrium with the gas phase. However, we would expect that stripping off excessHNO3would only be limited by the time scale of diffusion through the particles, which is on the order of microseconds. The fact that the increase in signal also occurs on the second citric acid coating could thus only result from additionalHNO3formed from the reaction of
NO2+with water after passing through the first denuder
plate set, the extent of which is in turn again limited by how longNO2+remains available before being converted back toN2O5.
Using the data obtained we calculated the uptake coef-ficient for ammonium sulphate at52%RH, which is equal to1.45 ± 0.35 × 10⁻². This is in excellent agreement with previously reported results [31].
As can be seen in Figure6, the particle signal in the case of ammonium sulphate is stronger than in the case of citric acid. This is consistent with the increased water con-tent in ammonium sulphate vs. citric acid aerosol (40 vs.
10 M) as calculated using the Extended AIM Aerosol Ther-modynamics Model [32] and a parameterization of the hy-groscopic studies of citric acid [33]. Assuming that the Henry’s Law coefficient (H) does not change with the ionic strength of the solution, the increased water content in-creases the amount of dissolvedN2O5, and thus also the extent of the reversible disproportionation reaction of dis-solved N2O5 with water to giveNO2+ andNO3− in the aerosol phase. In turn, this leads to an increased extent of reaction ofNO2+with water and thus increased net up-take ofN2O5from the gas phase.
4 Conclusions and outlook
We have produced13NlabeledN2O5for the first time. An experimental setup has been assembled for the study of uptake kinetics ofN2O5on aerosol particles and has been successfully tested. Gas phaseN2O5production data has
Fig. 6:N2O5interacting with ammonium sulphate particles at different aerosol S/V ratios (295 K, 52% RH): purple: first citric acid denuder signal (gas phaseN2O5); dark yellow: signal from particle filter (particle phaseN2O5or nitrate); dark red: SMPS signal (aerosol surface/volume ratio).
shown good agreement with results obtained with a ki-netic model. Measured data has shown that the experi-mental method also gives insight into the dynamics of the gas phase system. Routine production ofN2O5in the ppb range has been achieved, allowing for further studies in-volving13NlabeledN2O5.
Additionally, aerosol uptake experiments were con-ducted in order to test the experimental setup under re-alistic conditions. Uptake on citric acid aerosol has been observed and quantified. Uptake on ammonium sulphate aerosol has likewise been observed and an uptake coeffi-cient has been measured that is consistent with that re-ported in the literature for deliquesced ammonium sul-phate. Since the method allows tracing uptake in the par-ticulate phase, this opens the way for further experiments with other types of aerosols at a wider range of humidities as well as temperatures. Of particular interest would be the possibility to monitor the exchange with the particulate ni-trate pool in nini-trate aerosols.
Overall the study has shown the viability of the pro-posed method to produce 13N labeled N2O5 for atmo-spheric science related experimental studies, and in par-ticular the assembled setup and the related operating pro-cedures will be used in future studies ofN2O5uptake ki-netics on aerosol particles.
Acknowledgement: The authors would like to thank the
staff of the PSI accelerator facilities and of the isotope pro-duction facility IP-2 for their invaluable help. This work
is supported by the Swiss National Science Foundation (grant no. 130175).
References
1. Finlayson-Pitts, B. J., Pitts Jr., J. N.: Chemistry of the upper and
lower atmosphere, Academic Press, San Diego 2000.
2. Wagner, C., Hanisch, F., Holmes, N., de Coninck, H., Schus-ter, G., Crowley, J. N.: The interaction ofN2O5with mineral dust: aerosol flow tube and Knudsen reactor studies. Atmos. Chem. Phys.8(1), 91–109 (2008).
3. Chang, W. L., Bhave, P. V., Brown, S. S., Riemer, N., Stutz, J., Dabdub, D.: Heterogeneous atmospheric chemistry, ambient measurements, and model calculations of N(2)O(5): a review. Aerosol Sci. Technol.45(6), 665–695 (2011).
4. Dentener, F. J., Crutzen, P. J.: Reaction ofN2O5on tropospheric aerosols: impact on the global distributions ofNOx,O3and OH. J. Geophys. Res. 98(D4), 7149–7163 (1993).
5. Evans, M. J., Jacob, D. J.: Impact of new laboratory studies of N2O5hydrolysis on global model budgets of tropospheric nitrogen oxides, ozone and OH. Geophys. Res. Lett.32(9),
L09813 (2005).
6. Thornton, J. A., Abbatt, J. P. D.:N2O5reaction on submicron sea salt aerosol: kinetics, products, and the effect of surface active organics. J. Phys. Chem. A109(44), 10004–10012 (2005).
7. Badger, C. L., Griffiths, P. T., George, I., Abbatt, J. P. D., Cox, R. A.: Reactive uptake ofN2O5by aerosol particles con-taining mixtures of humic acid and ammonium sulfate. J. Phys. Chem. A110(21), 6986–6994 (2006).
8. Wagner, R., Naumann, K. H., Mangold, A., Mohler, O., Saathoff, H., Schurath, U.: Aerosol chamber study of optical constants andN2O5uptake on supercooled H2SO4/H2O/HNO3solution droplets at polar stratospheric cloud temperatures. J. Phys. Chem. A109(36), 8140–8148
(2005).
9. Wahner, A., Mentel, T. F., Sohn, M., Stier, J.: Heterogeneous reaction ofN2O5on sodium nitrate aerosol. J. Geophys. Res.-Atmos.103(D23), 31103–31112 (1998).
10. Griffiths, P. T., Badger, C. L., Cox, R. A., Folkers, M., Henk, H. H., Mentel, T. F.: Reactive uptake ofN2O5by aerosols containing dicarboxylic acids. effect of particle phase, composition, and nitrate nontent. J. Phys. Chem. A113(17), 5082–5090 (2009).
11. Tang, M. J., Thieser, J., Schuster, G., Crowley, J. N.: Kinet-ics and mechanism of the heterogeneous reaction ofN2O5 with mineral dust particles. Phys. Chem. Chem. Phys.14(24),
8551–8561 (2012).
12. Karagulian, F., Rossi, M. J.: Heterogeneous chemistry of the NO3free radical andN2O5on decane flame soot at ambient temperature: reaction products and kinetics. J. Phys. Chem. A111(10), 1914–1926 (2007).
13. Brown, S. S., Dube, W. P., Fuchs, H., Ryerson, T. B., Wollny, A. G., Brock, C. A., Bahreini, R., Middlebrook, A. M., Neuman, J. A., Atlas, E., Roberts, J. M., Osthoff, H. D., Trainer, M., Fehsenfeld, F. C., Ravishankara, A. R.: Reactive uptake coefficients forN2O5determined from aircraft measure-ments during the Second Texas Air Quality Study: comparison to current model parameterizations. J. Geophys. Res.-Atmos.
14. Gross, S., Iannone, R., Xiao, S., Bertram, A. K.: Reactive uptake studies ofNO3andN2O5on alkenoic acid, alkanoate, and polyalcohol substrates to probe nighttime aerosol chemistry. Phys. Chem. Chem. Phys.11(36), 7792–7803 (2009).
15. Ammann, M.: Using13N as tracer in heterogeneous atmo-spheric chemistry experiments. Radiochim. Acta89, 831–838
(2001).
16. Guimbaud, C., Arens, F., Gutzwiller, L., Gaggeler, H. W., Am-mann, M.: Uptake ofHNO3to deliquescent sea-salt particles: a study using the short-lived radioactive isotope tracer N-13. Atmos. Chem. Phys.2, 249–257 (2002).
17. Vlasenko, A., Sjogren, S., Weingartner, E., Stemmler, K., Gäggeler, H. W., Ammann, M.: Effect of humidity on nitric acid uptake to mineral dust aerosol particles. Atmos. Chem. Phys.
6, 2147–2160 (2006).
18. Sosedova, Y., Rouvière, A., Gäggeler, H. W., Ammann, M.: Up-take ofNO2to deliquesced dihydroxybenzoate aerosol parti-cles. J. Phys. Chem. A113, 10979–10987 (2009).
19. Bartels-Rausch, T., Eichler, B., Zimmermann, P., Gäggeler, H. W., Ammann, M.: The adsorption of nitrogen oxides on crystalline ice. Atmos. Chem. Phys.2(3), 235–247
(2002).
20. Bartels-Rausch, T., Ulrich, T., Huthwelker, T., Ammann, M.: A novel synthesis of the N-13 labeled atmospheric trace gas peroxynitric acid. Radiochim. Acta99(5), 285–292 (2011).
21. Ulrich, T., Ammann, M., Leutwyler, S., Bartels-Rausch, T.: The adsorption of peroxynitric acid on ice between230 K and 253 K. Atmos. Chem. Phys.12(4), 1833–1845 (2012).
22. Miller, P. W., Long, N. J., Vilar, R., Gee, A. D.: Synthesis of C-11, F-18, O-15, and N-13 radiolabels for positron emission tomogra-phy. Angew. Chem.-Int. Edit.47(47), 8998–9033 (2008).
23. Sajjad, M., Lambrecht, R. M., Wolf, A. P.: Cyclotron isotopes and radiopharmaceuticals .37. Excitation-functions for the O-16(𝑝, 𝛼)N-13 and N-14(𝑝, 𝑝𝑛)N-13 reactions. Radiochim. Acta
39(3), 165–168 (1986).
24. Qaim, S. M.: Nuclear data relevant to the production and appli-cation of diagnostic radionuclides. Radiochim. Acta89(4–5),
223–232 (2001).
25. Atkinson, R., Baulch, D. L., Cox, R. A., Crowley, J. N., Hamp-son, R. F., Hynes, R. G., Jenkin, M. E., Rossi, M. J., Troe, J.: Eval-uated kinetic and photochemical data for atmospheric
chem-istry: Volume I – gas phase reactions ofOx,HOx,NOxandSOx species. Atmos. Chem. Phys.4(6), 1461–1738 (2004).
26. Sander, S. P., Abbatt, J., Barker, J. R., Burkholder, J. B., Friedl, R. R., Golden, D. M., Huie, R. E., Kolb, C. E.,
Kurylo, G. M. J., Moortgat, K., Orkin, V. L., Wine, P. H.: Chem-ical kinetics and photochemChem-ical data for use in atmospheric studies, Evaluation no. 17. JPL Publication, Jet Propulsion Labo-ratory, Pasadena, USA10(6) (2011).
27. Peng, C., Chan, M. N., Chan, C. K.: The hygroscopic properties of dicarboxylic and multifunctional acids: measurements and UNIFAC predictions. Environ. Sci. Technol.35(22), 4495–4501
(2001).
28. Kalberer, M., Tabor, K., Ammann, M., Parrat, Y., Weingartner, E., Piguet, D., Rossler, E., Jost, D. T., Turler, A., Gaggeler, H. W., Baltensperger, U.: Heterogeneous chemical processing of (NO2)-N-13 by monodisperse carbon aerosols at very low con-centrations. J. Phys. Chem.100(38), 15487–15493 (1996).
29. Murphy, D. M., Fahey, D. W.: Mathematical treatment of the wall loss of a trace species in denuder and catalytic-converter tubes. Anal. Chem.59(23), 2753–2759 (1987).
30. Mentel, T. F., Sohn, M., Wahner, A.: Nitrate effect in the het-erogeneous hydrolysis of dinitrogen pentoxide on aqueous aerosols. Phys. Chem. Chem. Phys.1(24), 5451–5457 (1999).
31. Ammann, M., Cox, R. A., Crowley, J. N., Jenkin, M. E., Mel-louki, A., Rossi, M. J., Troe, J., Wallington, T. J.: Evaluated ki-netic and photochemical data for atmospheric chemistry: Volume VI - Heterogeneous reactions with liquid substrates. Atmos. Chem. Phys.13, 8045–8228 (2013).
32. Clegg, S. L., Brimblecombe, P., Wexler, A. S.: Thermodynamic model of the systemH+-NH4+-SO42−-NO3−-H2O at tropo-spheric temperatures. J. Phys. Chem. A102(12), 2137–2154
(1998).
33. Zardini, A. A., Sjogren, S., Marcolli, C., Krieger, U. K., Gy-sel, M., Weingartner, E., Baltensperger, U., Peter, T.: A com-bined particle trap/HTDMA hygroscopicity study of mixed in-organic/organic aerosol particles. Atmos. Chem. Phys.8(18),