Developmental Stability in House Mice Heterozygous for Single Robertsonian Fusions
7
0
0
Texte intégral
(2) translocation: FA was analyzed in two chromosomal races (2n ⫽ 40 and 2n ⫽ 38) of house mice differing by one Rb fusion [Rb(4.12)], as well as in their F1 and backcross progeny. In addition, the spontaneous occurrence of a new balanced rearrangement due to a whole-arm reciprocal translocations (WART ) between an Rb fusion and an acrocentric chromosome [WART typeb in Hauffe and Pialek (1997)] in the laboratory crosses allowed us to study two further aspects of the relation between chromosome change and genomic coadaptation. The new rearrangement [Rb(4.19)] was detected in the bone marrow of an F1 (2n ⫽ 39) female that when backcrossed to an all-acrocentric male (2n ⫽ 40), produced three types of offspring: all-acrocentric mice and heterozygotes for one of the two Rb fusions [Rb(4.12) or Rb(4.19)], thereby indicating mosaicism of the germline (Catalan et al. 2000). Despite the small sample size of WART carriers, the comparative analysis of fluctuating asymmetry of mice in this lineage provided the opportunity to detect an effect of a spontaneous chromosomal rearrangement on developmental stability and to compare with the one of a stable rearrangement. Furthermore, as the extremely low frequency of Rb fusions involving chromosome 19 in wild mice is thought to be related to a high selective disadvantage ( Nachman and Searle 1995), its specific effect on developmental stability was investigated.. Materials and Methods Mating Design All crosses involved laboratory offspring of wild-trapped house mice from different localities in Belgium. Three of these localities [Assesse (50.22N, 5.02E), Natoye (50.20N, 5.04E), and Space (near Gesves (50.24N, 5.04E)] yielded 2n ⫽ 40 all-acrocentric individuals, and one [Corroy-leGrand (50.40N, 4.40E)] yielded 2n ⫽ 38 homozygotes for Rb(4.12) [Dallas et al. 1998; see Bauchau (1990) for information on Rb races in Belgium]. Six types of crosses were performed: two were intraracial ones (2n ⫽ 40 ⫻ 2n ⫽ 40) and (2n ⫽ 38 ⫻ 2n ⫽ 38), two were reciprocal interracial crosses (2n ⫽ 40 ⫻ 2n ⫽ 38), and two were reciprocal backcrosses with all-acrocentric mice (2n ⫽ 39 ⫻ 2n ⫽ 40). Each type of cross involved four pairs of mice. Mice of the different crosses were reared under identical conditions in the same animal. 24 The Journal of Heredity 2001:92(1). room. Food and water were provided ad libitum. The progeny were grouped into eight samples. Two of these corresponded to the parental types, the all-acrocentric mice with 2n ⫽ 40 (coded ST40), and the Robertsonian ones homozygous for the Rb(4.12) fusion (RB38); two to the F1 generation (2n ⫽ 39) separated according to the karyotype of the mother (40F1) when the mother was all-acrocentric (2n ⫽ 40) and (38F1) when the mother was Robertsonian (2n ⫽ 38). As the F1 individuals were all backcrossed to all-acrocentric mice, the offspring were either all-acrocentric ( BC40) or heterozygous for the Rb(4.12) fusion ( BC39). Each of these groups was subdivided into two samples according to the sex of the F1 parent: (39BC40) and (39BC39) when the mother was an F1 individual and (40BC40) and (40BC39) when the mother was all-acrocentric. Only the progeny from the first two litters were examined and all the animals studied were at least 4 weeks old. A total of 257 individuals were analyzed and sample sizes are provided in Table 1. WART Lineage The mosaic female in which the WART mutation was detected was paired to an allacrocentric male and gave birth to six litters, the second, fifth, and sixth of which contained four carriers of the WART mutation and 20 noncarriers, that is, all-acrocentric or 2n ⫽ 39 individuals carrying Rb(4.12). These mice were grouped into two samples, the first one (WART ) consisting in the five WART carriers including the mosaic female, and the second one (CONT ), the control sample, grouping the 20 other mice from the same litters and six siblings of the mother. Chromosomal Analysis Mice were assigned to the different samples on the basis of karyotypes prepared from yeast-stimulated ( Lee and Elder 1980) bone marrow cells using the air-drying technique. For each individual, diploid numbers were determined on conventionally stained slides by analyzing 3–30 metaphase plates under a Zeiss Axiophot microscope. Identification of chromosomes according to the nomenclature of Cowell (1984) was performed using the G-banding method (Seabright 1971) and the karyotypes were established with the Genevision software. Tooth Characters All mandibles were manually cleaned. Fluctuating asymmetry was estimated on. the maximum length and width of the three lower molars ( LM1, WM1, LM2, WM2, LM3, and WM3). These measurements are currently used in studies of FA in rodents (Alibert et al. 1994, 1997; Auffray et al. 1996, 1999; Bader 1965; Chatti et al. 1999), and levels of developmental stability in teeth and skull have recently been shown to be well related ( Debat et al. 2000). The third lower molar was absent in some individuals either due to natural causes or to the cleaning procedure, leading to unequal sample size among traits ( Table 1). Although the age at which the animal was sacrificed was not standardized, it was an unlikely source of bias since tooth size is definite once it has erupted into the oral cavity, that is, 18 and 28 days after birth for M1-M2 and M3, respectively ( Bader 1965). To estimate the error of measurement, measurements were taken twice during two independent sessions with a Nikon measuroscope (1 m accuracy). Preliminary Treatments Statistical treatments of FA were largely based on Palmer (1994). Preliminary tests involved Shapiro–Wilks (W) tests of normality for each trait of each of the 10 samples. Rejection of normality would potentially suggest the presence of antisymmetry, which corresponds to the bilateral variation in which one side is systematically larger than the other, but this side varies at random among individuals. These tests were performed on (R—L) distributions, R and L representing the mean right and the mean left values, respectively, of the trait over the two sessions of measurement. Skewness and kurtosis were also assessed. For each trait, size dependence of FA within samples was tested by linear regression of 円R—L円 on (R ⫹ L)/ 2 and, among samples, by linear regression of log(var(R—L)) on (R ⫹ L)/2. The significance of directional asymmetry— when one side is larger than the other one, resulting in the mean right measurement being statistically different from the left one—and the level of the error of measurement relative to FA were appraised for each trait within each sample, using the now classical two-way mixed model ANOVA (Palmer and Strobeck 1986). The importance of sex as a potential source of variation of 円R—L円 was appraised trait by trait using a two-way fixed model ANOVA involving sample, sex, and their interaction as effects. The relation between asymmetry and litter size was tested by a linear regression pooling all samples trait by.
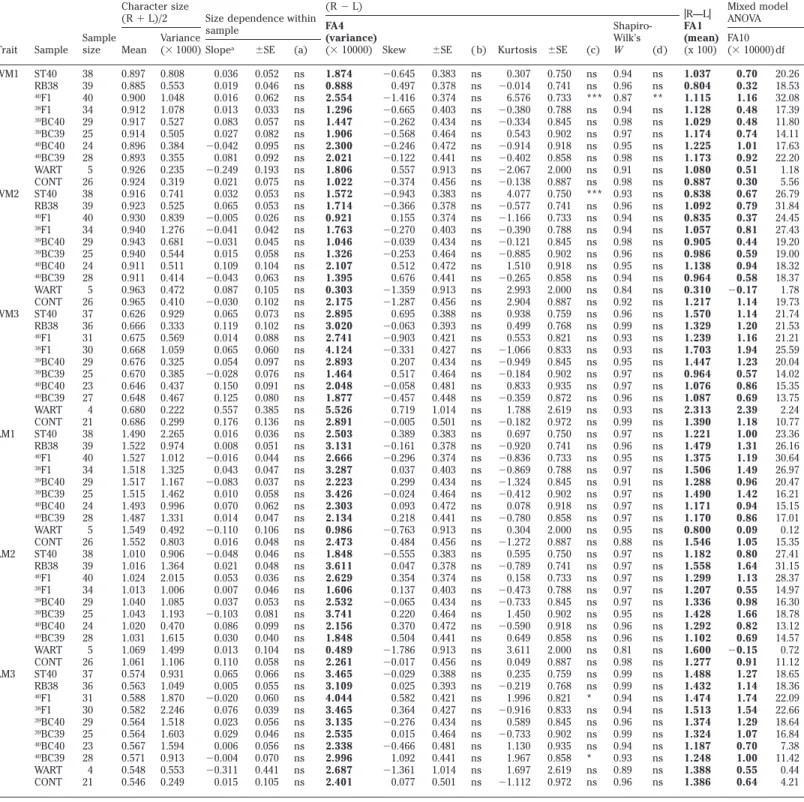
(3) Table 1. Detailed presentation of trait size and fluctuating asymmetry results for tooth traits Fluctuating asymmetry. Trait. Sample. Sample size Mean. (R ⫺ L) Size dependence within FA4 sample Variance (variance) a (⫻ 1000) Slope ⫾SE (a) (⫻ 10000) Skew. WM1. ST40 RB38 40 F1 38 F1 39 BC40 39 BC39 40 BC40 40 BC39 WART CONT ST40 RB38 40 F1 38 F1 39 BC40 39 BC39 40 BC40 40 BC39 WART CONT ST40 RB38 40 F1 38 F1 39 BC40 39 BC39 40 BC40 40 BC39 WART CONT ST40 RB38 40 F1 38 F1 39 BC40 39 BC39 40 BC40 40 BC39 WART CONT ST40 RB38 40 F1 38 F1 39 BC40 39 BC39 40 BC40 40 BC39 WART CONT ST40 RB38 40 F1 38 F1 39 BC40 39 BC39 40 BC40 40 BC39 WART CONT. 38 39 40 34 29 25 24 28 5 26 38 39 40 34 29 25 24 28 5 26 37 36 31 30 29 25 23 27 4 21 38 39 40 34 29 25 24 28 5 26 38 39 40 34 29 25 24 28 5 26 37 36 31 30 29 25 23 28 4 21. 0.808 0.553 1.048 1.078 0.527 0.505 0.384 0.355 0.235 0.319 0.741 0.525 0.839 1.276 0.681 0.544 0.511 0.414 0.472 0.410 0.929 0.333 0.569 1.059 0.325 0.385 0.437 0.467 0.222 0.299 2.265 0.974 1.012 1.325 1.167 1.462 0.996 1.331 0.492 0.803 0.906 1.364 2.015 1.006 1.085 1.193 0.470 1.615 1.499 1.106 0.931 1.049 1.870 2.246 1.518 1.603 1.594 0.913 0.553 0.249. Character size (R ⫹ L)/2. WM2. WM3. LM1. LM2. LM3. 0.897 0.885 0.900 0.912 0.917 0.914 0.896 0.893 0.926 0.924 0.916 0.923 0.930 0.940 0.943 0.940 0.911 0.911 0.963 0.965 0.626 0.666 0.675 0.668 0.676 0.670 0.646 0.648 0.680 0.686 1.490 1.522 1.527 1.518 1.517 1.515 1.493 1.487 1.549 1.552 1.010 1.016 1.024 1.013 1.040 1.043 1.020 1.031 1.069 1.061 0.574 0.563 0.588 0.582 0.564 0.564 0.567 0.571 0.548 0.546. 0.036 0.019 0.016 0.013 0.083 0.027 ⫺0.042 0.081 ⫺0.249 0.021 0.032 0.065 ⫺0.005 ⫺0.041 ⫺0.031 0.015 0.109 ⫺0.043 0.087 ⫺0.030 0.065 0.119 0.014 0.065 0.054 ⫺0.028 0.150 0.125 0.557 0.176 0.016 0.008 ⫺0.016 0.043 ⫺0.083 0.010 0.070 0.014 ⫺0.110 0.016 ⫺0.048 0.021 0.053 0.007 0.037 ⫺0.103 0.086 0.030 0.013 0.110 0.065 0.005 ⫺0.020 0.076 0.023 0.029 0.006 ⫺0.004 ⫺0.311 0.015. 0.052 0.046 0.062 0.033 0.057 0.082 0.095 0.092 0.193 0.075 0.053 0.053 0.026 0.042 0.045 0.058 0.104 0.063 0.105 0.102 0.073 0.102 0.088 0.060 0.097 0.076 0.091 0.080 0.385 0.136 0.036 0.051 0.044 0.047 0.037 0.058 0.062 0.047 0.106 0.048 0.046 0.048 0.036 0.046 0.053 0.081 0.099 0.040 0.104 0.058 0.066 0.055 0.060 0.039 0.056 0.046 0.056 0.070 0.441 0.105. ns ns ns ns ns ns ns ns ns ns ns ns ns ns ns ns ns ns ns ns ns ns ns ns ns ns ns ns ns ns ns ns ns ns ns ns ns ns ns ns ns ns ns ns ns ns ns ns ns ns ns ns ns ns ns ns ns ns ns ns. 1.874 0.888 2.554 1.296 1.447 1.906 2.300 2.021 1.806 1.022 1.572 1.714 0.921 1.763 1.046 1.326 2.107 1.395 0.303 2.175 2.895 3.020 2.741 4.124 2.893 1.464 2.048 1.877 5.526 2.891 2.503 3.131 2.666 3.287 2.223 3.426 2.303 2.134 0.986 2.473 1.848 3.611 2.629 1.606 2.532 3.741 2.156 1.848 0.489 2.261 3.465 3.109 4.044 3.465 3.135 2.535 2.338 2.996 2.687 2.401. ⫺0.645 0.497 ⫺1.416 ⫺0.665 ⫺0.262 ⫺0.568 ⫺0.246 ⫺0.122 0.557 ⫺0.374 ⫺0.943 ⫺0.366 0.155 ⫺0.270 ⫺0.039 ⫺0.253 0.512 0.676 ⫺1.359 ⫺1.287 0.695 ⫺0.063 ⫺0.903 ⫺0.331 0.207 0.517 ⫺0.058 ⫺0.457 0.719 ⫺0.005 0.389 ⫺0.161 ⫺0.296 0.037 0.299 ⫺0.024 0.093 0.218 ⫺0.763 0.484 ⫺0.555 0.047 0.354 0.137 ⫺0.065 0.220 0.370 0.504 ⫺1.786 ⫺0.017 ⫺0.029 0.025 0.582 0.364 ⫺0.276 0.015 ⫺0.466 1.092 ⫺1.361 0.077. ⫾SE. ( b). Kurtosis ⫾SE. (c). ShapiroWilk’s W (d). 0.383 0.378 0.374 0.403 0.434 0.464 0.472 0.441 0.913 0.456 0.383 0.378 0.374 0.403 0.434 0.464 0.472 0.441 0.913 0.456 0.388 0.393 0.421 0.427 0.434 0.464 0.481 0.448 1.014 0.501 0.383 0.378 0.374 0.403 0.434 0.464 0.472 0.441 0.913 0.456 0.383 0.378 0.374 0.403 0.434 0.464 0.472 0.441 0.913 0.456 0.388 0.393 0.421 0.427 0.434 0.464 0.481 0.441 1.014 0.501. ns ns ns ns ns ns ns ns ns ns ns ns ns ns ns ns ns ns ns ns ns ns ns ns ns ns ns ns ns ns ns ns ns ns ns ns ns ns ns ns ns ns ns ns ns ns ns ns ns ns ns ns ns ns ns ns ns ns ns ns. 0.307 ⫺0.014 6.576 ⫺0.380 ⫺0.334 0.543 ⫺0.914 ⫺0.402 ⫺2.067 ⫺0.138 4.077 ⫺0.577 ⫺1.166 ⫺0.390 ⫺0.121 ⫺0.885 1.510 ⫺0.265 2.993 2.904 0.938 0.499 0.553 ⫺1.066 ⫺0.949 ⫺0.184 0.833 ⫺0.359 1.788 ⫺0.182 0.697 ⫺0.920 ⫺0.836 ⫺0.869 ⫺1.324 ⫺0.412 0.078 ⫺0.780 0.304 ⫺1.272 0.595 ⫺0.789 0.158 ⫺0.473 ⫺0.733 1.450 ⫺0.590 0.649 3.611 0.049 0.235 ⫺0.219 1.996 ⫺0.916 0.589 ⫺0.733 1.130 1.967 1.697 ⫺1.112. ns ns *** ns ns ns ns ns ns ns *** ns ns ns ns ns ns ns ns ns ns ns ns ns ns ns ns ns ns ns ns ns ns ns ns ns ns ns ns ns ns ns ns ns ns ns ns ns ns ns ns ns * ns ns ns ns * ns ns. 0.94 0.96 0.87 0.94 0.98 0.97 0.95 0.98 0.91 0.98 0.93 0.96 0.94 0.94 0.98 0.96 0.95 0.94 0.84 0.92 0.96 0.99 0.93 0.93 0.95 0.97 0.97 0.96 0.93 0.99 0.97 0.96 0.95 0.97 0.91 0.97 0.97 0.97 0.95 0.88 0.97 0.97 0.97 0.97 0.97 0.95 0.96 0.96 0.81 0.98 0.99 0.99 0.94 0.94 0.96 0.99 0.94 0.93 0.89 0.96. 0.750 0.741 0.733 0.788 0.845 0.902 0.918 0.858 2.000 0.887 0.750 0.741 0.733 0.788 0.845 0.902 0.918 0.858 2.000 0.887 0.759 0.768 0.821 0.833 0.845 0.902 0.935 0.872 2.619 0.972 0.750 0.741 0.733 0.788 0.845 0.902 0.918 0.858 2.000 0.887 0.750 0.741 0.733 0.788 0.845 0.902 0.918 0.858 2.000 0.887 0.759 0.768 0.821 0.833 0.845 0.902 0.935 0.858 2.619 0.972. ns ns ** ns ns ns ns ns ns ns ns ns ns ns ns ns ns ns ns ns ns ns ns ns ns ns ns ns ns ns ns ns ns ns ns ns ns ns ns ns ns ns ns ns ns ns ns ns ns ns ns ns ns ns ns ns ns ns ns ns. Mixed model 円R—L円 ANOVA FA1 (mean) FA10 (x 100) (⫻ 10000) df 1.037 0.804 1.115 1.128 1.029 1.174 1.225 1.173 1.080 0.887 0.838 1.092 0.835 1.057 0.905 0.986 1.138 0.964 0.310 1.217 1.570 1.329 1.239 1.703 1.447 0.964 1.076 1.087 2.313 1.390 1.221 1.479 1.375 1.506 1.288 1.490 1.171 1.170 0.800 1.546 1.182 1.558 1.299 1.207 1.336 1.428 1.292 1.102 1.600 1.277 1.488 1.432 1.474 1.513 1.374 1.324 1.187 1.248 1.388 1.386. 0.70 0.32 1.16 0.48 0.48 0.74 1.01 0.92 0.51 0.30 0.67 0.79 0.37 0.81 0.44 0.59 0.94 0.58 ⫺0.17 1.14 1.14 1.20 1.16 1.94 1.23 0.57 0.86 0.69 2.39 1.18 1.00 1.31 1.19 1.49 0.96 1.42 0.94 0.86 0.09 1.05 0.80 1.64 1.13 0.55 0.98 1.66 0.82 0.69 ⫺0.15 0.91 1.27 1.14 1.74 1.54 1.29 1.07 0.70 1.00 0.55 0.64. 20.26 18.53 32.08 17.39 11.80 14.11 17.63 22.20 1.18 5.56 26.79 31.84 24.45 27.43 19.20 19.00 18.32 18.37 1.78 19.73 21.74 21.53 21.21 25.59 20.04 14.02 15.35 13.75 2.24 10.77 23.36 26.16 30.64 26.97 20.47 16.21 15.15 17.01 0.12 15.35 27.41 31.15 28.37 14.97 16.30 18.78 13.12 14.57 0.72 11.12 18.65 18.36 22.09 22.66 18.64 16.84 7.38 11.42 0.44 4.21. Regression slope of 円R—L円 on (R ⫹ L)/2. Statistical significance of (a) regression slope, ( b) skewness, (c) kurtosis, and (d) departure from normality. * P ⬍ .05; ** P ⬍ .01; *** P ⬍ .001; ns, nonsignificant. a. trait. At each step of these preliminary treatments involving the 10 samples, sequential Bonferroni tests (Rice 1989) were conducted on sets of k ⫽ 10 tests corresponding to the 10 samples. Finally, the ef-. fect of parental pairs of a potential source of variation within samples was appraised using a nested ANOVA, corrected for unequal sample size (Sokal and Rohlf 1995), considering pair effect nested into sample. one. However, within each of the WART and CONT samples, individuals originated from a single parental pair. These two samples were thus not involved in the later analysis.. Auffray et al • Developmental Stability and Rb Fusions 25.
(4) Fluctuating Asymmetry Estimates and Testing Three indices of FA were considered for each trait and each sample, FA1 which corresponded to the mean of 円R—L円, FA4 which was the variance of (R—L), and FA10 which resulted from the two-way mixed model ANOVA, and partitioned out the error of measurement as assessed from the two replicates from the FA estimate. The differences in FA levels were tested using the modified Levene’s test (Palmer 1994) on the 円R—L円 dataset. It corresponds to a two-way fixed model ANOVA involving sample, trait, and their interaction as effects. The concordance of FA estimates for all traits across samples was tested using a Kendall test of concordance on the three types of FA indices separately.. Results Preliminary Results In this section the P values provided were corrected by the Bonferroni procedure and are coded as follows: P ⬎ .05, ns; P ⬍ .05, *; P ⬍ .01,**; P ⬍ .001, ***. Normality was not rejected except for one distribution out of the 60 considered here ( Table 1). Skewness was not detected in these distributions, but kurtosis was in two of them. The two-way mixed model ANOVAs showed that the side effect was significant in four of the 60 cases (appendix), suggesting a low occurrence of directional asymmetry. As the very few cases of departure from perfect normality centered on zero did not affect a particular trait or sample, neither directional asymmetry nor antisymmetry could be considered as affecting the estimates of FA in this study and all data were retained in further analyses. Individual asymmetry was not dependent on character size, either within samples ( Table 1) or among them (0.19 ⬍ F[1, 9] ⬍ 1.84, all P values ns). For all samples except WART, the interaction term of the two-way mixed model ANOVA was significant for all traits (appendix). The nonsignificance of the interaction term for five of the six traits in the WART group (appendix) was likely due to several causes: a more important error of measurement for this sample (although all measurements were taken by the same operator) and a lesser sensitivity of F tests, both causes being potentially related to the extremely low sample size. However, the WART mutation was detected once all animals had been sacrificed. It was thus impossible to increase the sample size. Re-. 26 The Journal of Heredity 2001:92(1). sults concerning this sample should then be considered with caution as representing an indication rather than an evidence. This artifact led, however, to few negative values of FA10 in this sample. Two-way fixed model ANOVAs demonstrated that sex had no effect on the level of FA when considered alone (sex effect, 0.08 ⬍ F[1, 243–268] ⬍ 1.52, all P values ns) or in interaction with the sample (interaction sex sample, 0.32 ⬍ F[1, 243–268] ⬍ 1.39, all P values ns). For no trait was linear regression of 円R—L円 on litter size significant (0.05 ⬍ F[1, 261–286] ⬍ 1.27, all P values ns). Nested ANOVAs indicated that the differences among the progenies of the different parental pairs were not significant (parental pair effect nested in sample one, 0.50 ⬍ F[24, 206–225] ⬍ 1.59, all P values ns). Fluctuating Asymmetry Levene’s test showed that (1) some traits were repeatedly less developmentally stable than others (trait effect, F[5, 1619] ⫽ 7.95***), (2) the extent of FA variation among samples did not depend on the trait (interaction sample trait, F[45, 1619] ⫽ 0.93ns), and (3) samples did not exhibit statistically different levels of developmental stability (sample effect, F[9, 1619] ⫽ 0.75 ns). Even if FA levels were not significantly different, the ranking of samples for FA levels could have been concordant across traits. Such a pattern would have suggested a trend for differences in developmental stability among the samples. However, Kendall tests of concordance were not significant whatever the FA index considered ( FA1, W ⫽ 0.119 ns; FA4, W ⫽ 0.125 ns; FA10, W ⫽ 0.174 ns). These results suggested that the presence of the stable chromosomal rearrangement [Rb(4.12)], whether heterozygous (in 40F1, 38F1, 39BC39, and 40BC39 samples) or homozygous (in RB38), did not impair the developmental stability of carriers as compared to the all acrocentric group (ST40 sample). In addition, although based on a small sample size, the spontaneous WART mutation did not lead to a detectable increase in FA of carriers (in the WART sample) as compared to the control group (CONT ) and to all other samples.. Discussion No differences in FA were found between hybrid and parental groups of mice from Belgium differing by Rb(4.12). This indicated that this structural rearrangement did not impair developmental stability in. the chromosomal hybrids. These data contrast with those of a previous study showing a decrease in developmental stability of teeth in hybrids between Tunisian chromosomal races of the house mouse diverging for nine Rb fusions (Chatti et al. 1999). Thus the genomic incompatibility evidenced between races diverging with a large difference in the number of fusions is not detected between those differing for a single fusion. This differential effect on developmental stability of hybrids between chromosomal races could arise from several causes that are not mutually exclusive: the number of Rb fusions differentiating the two races, the level of genic divergence between them, and/or the type of Rb fusion involved. The contrasting results of heterozygosity for one versus many Rb fusions suggest that the interphase chromosomal reorganization induced by only one of these rearrangements has no deleterious effect on genome expression. Alternately, it may indicate that although heterozygosity for one Rb fusion may in fact result in an effect, the latter is not sufficient to perturb developmental stability or for it to be detected. In this case, an additive and/or threshold relationship would be expected between the number of heterozygous Rb fusions and disruption of genomic coadaptation. A similar gradient in hybrid unfitness is observed in fertility assays of chromosome heterozygosity in house mice. Whereas the presence of one Rb fusion in a heterozygous state has only a small effect on the fertility of mice, the latter decreases drastically when many Rb fusions are involved ( Nachman and Searle 1995). The difference in hybrid developmental stability between the Belgian and Tunisian chromosomal races, if not due to chromosome structure, may be related to their level of genic differentiation. This level is a function of the extent of reproductive isolation and the maximum time since divergence, which is appraised by the date of colonization by house mice of regions in which chromosomal divergence is observed. Colonization dates, c.5000 years ago for Tunisia, and c.2000 years for Belgium (Auffray 1993; Auffray et al. 1990) and hybrid infertility estimates ( Tunisia, Saı¨d et al. 1993; Belgium, Viroux and Bauchau 1992) suggest that the level of genic differentiation is expected to be higher between the Tunisian races than the Belgian ones. This is supported by estimates from allozyme studies indicating a higher level of differentiation in the Tunisian races.
(5) (Saı¨d and Britton-Davidian 1991) than in European ones (Saı¨d et al. 1999). Thus the contrasting results in levels of developmental stability between the chromosomal hybrids of these two regions could be due to different levels of genic differentiation, resulting in a higher degree of genomic incompatibility in the Tunisian than in Belgian hybrids. Furthermore, it has been suggested that the absence of differences in fluctuating asymmetry levels between homozygous chromosomal races may be due to selective processes that restore developmental stability in the initially impaired derived race (Auffray et al. 1999). Such a selective process has received support from studies showing that an impaired developmental stability was rapidly restored following disruption of coadaptation due to the appearance of a mutant allele (Clarke and McKenzie 1987). If a perturbation of developmental stability had occurred in the recently formed Rb race from Belgium, the similar FA levels between the Rb and allacrocentric races suggests that the restoration would have already taken place. That such a process (perturbation followed by restoration) is unlikely is suggested by results on mice carrying the spontaneous WART mutation, which showed no detectable increase in FA levels compared to those heterozygous for Rb(4.12). Although developmental instability of teeth has been shown to be impaired by a spontaneous chromosomal abnormality in Down syndrome patients ( Barden 1980; Shapiro 1983), our study is the first one to report the neutral effect of a spontaneous balanced chromosomal rearrangement on developmental stability. Thus neither spontaneous nor stable single structural rearrangements seem to perturb developmental stability in chromosomal hybrid mice. Even if based on a small sample size, the absence of a detectable effect related to the Rb(4.19) fusion is remarkable in itself in that it involves chromosome 19, which is only very rarely present in fusions in wild house mice ( Britton-Davidian et al. 2000; Nachman and Searle 1995). This rare occurrence, compared to all other autosomes, was thought to be associated with the high selective disadvantage of Rb fusions involving this chromosome. The present study has demonstrated that such a counterselection, if it exists, does not involve impairment of developmental processes. Further studies should address the question of the nature and extent of this selective disadvantage.. The absence of an effect on developmental stability in hybrids carrying Rb(4.12) and Rb (4.19) may be related to the set of chromosomes present in these Rb fusions. Although the genetic basis of developmental stability is for the most part unknown, recent studies in house mice have detected a few quantitative trait loci (QTLs) for FA of mandibular traits, notwithstanding an overall low genetic variability and heritability for FA ( Leamy et al. 1997, 1998). These QTLs were localized on many different autosomes including chromosomes 4, 12, and 19. Of interest, QTLs for a given trait FA were not located close to those for size or directional asymmetry of the trait but were adjacent, in some cases, to growth hormone and receptor loci. Even though chromosomes 4, 12, and 19 carry several loci related to growth factors (Mouse Genome Database 1999), our data show that a change in their structure did not lead to a detectable developmental instability of tooth traits. Similarly, Chatti et al. (1999) reported that none of the nine heterozygous Rb fusions they studied appeared to contribute preferentially to the high level of FA in the chromosomal hybrids. In this case, however, since all autosomes were involved except one, the specific effect of one or several Rb fusions could not be accurately tested as they were all partly associated. Thus the influence of individual Rb fusions and/or of specific chromosomal arm combinations on developmental stability has yet to be addressed. In conclusion, we have shown that, contrary to chromosomal abnormalities, a single balanced rearrangement does not disturb genome activity at any stage of its fixation in populations. Further crossing experiments are now required to determine if the developmental instability observed in hybrids between highly divergent chromosomal groups is due to genic differentiation between them, to one or several specific heterozygous rearrangements and/or to an additive effect of the accumulation of Rb fusions.. References Alibert P, Fel-Clair F, Manolakou K, Britton-Davidian J, and Auffray J-C, 1997. Developmental stability, fitness, and trait size in laboratory hybrids between European subspecies of the house mouse. Evolution 51:1284– 1295. Alibert P, Renaud S, Dod B, Bonhomme F, and Auffray J-C, 1994. Fluctuating asymmetry in the Mus musculus hybrid zone: a heterotic effect in disrupted co-adapted genomes. Proc R Soc Lond B 258:53–59. Auffray J-C, 1993. Chromosomal divergence in house. mice in the light of paleontology: a colonization-related event? Quat Int 19:21–25. Auffray J-C, Alibert P, Renaud S, Orth A, and Bonhomme F, 1996. Fluctuating asymmetry in Mus musculus subspecific hybridization: traditional and Procrustes comparative approach. In: Advances in morphometrics, vol. 284 (Marcus LF, Corti M, Loy A, Slice D, and Naylors G, eds). New York: Plenum; 275–283. Auffray J-C, Renaud S, Alibert P, and Nevo E, 1999. Developmental stability and adaptive radiation in Spalax ehrenberghi superspecies in the Near East. J Evol Biol 12:207–221. Auffray J-C, Vanlerberghe F, and Britton-Davidian J, 1990. The house mouse progression in Eurasia: a paleontological and archaeozoological approach. Biol J Linn Soc 41:13–25. Bader RS, 1965. Fluctuating asymmetry in the dentition of the house mouse. Growth 29:219–300. Barden HS, 1980. Fluctuating dental asymmetry: a measure of developmental stability in Down syndrome. Am J Phys Anthropol 52:169–173. Bauchau V, Smet S, Viroux M-C, Nootens D, and De Caritat A-K, 1990. Robertsonian translocations in free living populations of the house mouse in Belgium. Biol J Linn Soc 41:193–201. Britton-Davidian J, Catalan J, Ramalhinho MG, Ganem G, Auffray J-C, Capela R, Biscoito M, Searle JB, and Mathias ML, 2000. A case of non-adaptive island radiation. Nature 403:158. Capanna E and Redi C, 1994. Chromosomes and microevolutionary processes. Boll Zool 61:285–294. Catalan J, Auffray J-C, Pellestor F, and Britton-Davidian J, 2000. Spontaneous occurrence of a Robertsonian fusion involving chromosome 19 by single whole-arm reciprocal translocation (WART ) in wild-derived house mice. Chromosome Res 8:593–601. Chatti N, Said K, Catalan J, Britton-Davidian J, and Auffray J-C, 1999. Developmental instability in wild chromosomal hybrids of the house mouse. Evolution 53: 1268–1279. Clarke GM, 1993. The genetic basis of developmental stability. I. Relationships between stability, heterozygosity and genomic coadaptation. Genetica 89:15–23. Clarke GM and McKenzie JA, 1987. Developmental stability of insecticide resistant phenotypes in blowfly; a result of canalizing natural selection. Nature 325:345– 346. Cowell JK, 1984. A photographic representation of the variability of G-banded structure of the chromosomes of the house mouse. Chromosoma 89:294–320. Dallas JF, Bonhomme F, Boursot P, Britton-Davidian J, and Bauchau V, 1998. Population genetic structure in a Robertsonian race of house mice: evidence from microsatellite polymorphism. Heredity 80:70–77. Debat V, Alibert P, Paradis E, David P, and Auffray J-C, 2000. Independence between developmental stability and canalisation in the skull of the house mouse. Proc R Soc Lond B Biol 267:423–430. Graham JH, 1992. Genomic coadaptation and developmental stability in hybrid zones. Acta Zool Fennica 191: 121–131. Hauffe HC and Pialek J, 1997. Evolution of the chromosomal races of Mus musculus domesticus in the Rhaetian Alps: the roles of whole-arm reciprocal translocation and zonal raciation. Biol J Linn Soc 62:255–278. Heslop-Harrison JS and Bennet MD, 1990. Nuclear architecture in plants. Trends Genet 6:401–405. Leamy L, Routman EJ, and Cheverud JM, 1997. A search for quantitative trait loci affecting asymmetry of mandibular characters in mice. Evolution 51:957–969. Leamy LJ, Routman EJ, and Cheverud JM, 1998. Quantitative trait loci for fluctuating asymmetry of discrete skeletal characters in mice. Heredity 80:509–518. Lee MR and Elder FFB, 1980. Yeast stimulation of bone. Auffray et al • Developmental Stability and Rb Fusions 27.
(6) marrow mitosis for cytogenetic investigations. Cytogenet Cell Genet 26:36–40.. try: measurement, analysis, patterns. Annu Rev Ecol Syst 17:391–421.. mouse populations (Mus musculus domesticus) of Tunisia. J Evol Biol 3:409–427.. Marshall WF, Fung JC, and Sedat JW, 1997. Deconstructing the nucleus: global architecture from local interactions. Curr Opin Genet Dev 7:259–263.. Park PC and De Boni U, 1998. A specific conformation of the territory of chromosome 17 localities ERBB-2 sequences to DNase-hypersensitive domain at the nuclear periphery. Chromosoma 107:87–95.. Saı¨d K, Saad A, Auffray J-C, and Britton-Davidian J, 1993. Fertility estimates in the Tunisian all-acrocentric and Robertsonian population of the house mouse and their chromosomal hybrids. Heredity 71:532–538.. Milot E, Fraser P, and Grosveld F, 1996. Position effects and genetic disease. Trends Genet 12:123–126. Mouse Genome Database, 1999. Mouse genome informatics. Bar Harbor, ME: The Jackson Laboratory. World Wide Web, URL: http://www.informatics.jax.org/.. Qumsiyeh MB, 1995. Impact of rearrangements on function and position of chromosomes in the interphase nucleus and on human genetic disorders. Chromosome Res 3:455–465.. Nachman MW and Searle JB, 1995. Why is the house mouse karyotype so variable? Trends Ecol Evol 10:397– 402.. Rice WR, 1989. Analyzing table of statistical tests. Evolution 43:223–225.. Palmer AR, 1994. Fluctuating asymmetry analysis: a primer. In: Developmental instability: its origin and evolutionary implications ( TA Markows, ed). Dordrecht: Kluwer Academic; 335–364.. Saı¨d K, Auffray J-C, Boursot P, and Britton-Davidian J, 1999. Is chromosomal speciation occurring in the house mouse from Tunisia? Biol J Linn Soc 68:387–399. Saı¨d K and Britton-Davidian J, 1991. Genetic differentiation and habitat partition of Robertsonian house. Palmer RA and Strobeck C, 1986. Fluctuating asymme-. Seabright M, 1971. A rapid technique for human chromosomes. Lancet 11:971. Shapiro BL, 1983. Down syndrome—a disruption of homeostasis. Am J Med Genet 14:241–269. Sokal RR and Rohlf FJ, 1995. Biometry, 3rd ed. New York: Freeman. Viroux MC and Bauchau V, 1992. Segregation and fertility in Mus musculus domesticus heterozygous for the Rb(4.12) translocation. Heredity 68:131–134. Received December 15, 1999 Accepted August 30, 2000 Corresponding Editor: William S. Modi. Appendix. Results of the two-way mixed model ANOVAs Effect Individual. Side (df ⫽ 1). Interaction. Error. Trait. Sample. df. MS (⫻ 10000) F. MS (⫻ 10000) F. MS (⫻ 10000) F. df. MS (⫻ 10000). WM1. ST40 RB38 40 F1 38 F1 39 BC40 39 BC39 40 BC40 40 BC39 WART CONT ST40 RB38 40 F1 38 F1 39 BC40 39 BC39 40 BC40 40 BC39 WART CONT ST40 RB38 40 F1 38 F1 39 BC40 39 BC39 40 BC40 40 BC39 WART CONT. 37 38 39 33 28 24 23 27 4 25 37 38 39 33 28 24 23 27 4 25 36 35 30 29 28 24 22 26 3 20. 32.33 22.12 41.93 43.13 21.08 20.21 15.35 14.22 9.39 12.75 29.63 21.00 33.57 51.04 27.26 21.77 20.46 16.57 18.90 16.39 37.18 13.31 22.75 42.37 12.99 15.40 17.46 18.67 8.86 11.96. 0.25 8.92 2.50 12.91 4.36 7.67 0.00 7.56 0.24 1.06 0.28 0.86 0.48 4.49 4.68 2.53 10.80 0.01 0.04 0.48 51.14 3.09 5.54 0.10 3.01 0.04 0.00 3.31 8.85 0.01. 1.87 0.89 2.55 1.30 1.45 1.91 2.30 2.02 1.81 1.20 1.57 1.71 0.92 1.76 1.05 1.33 2.11 1.40 0.30 2.55 2.89 3.02 2.74 4.12 2.89 1.46 2.05 1.88 5.53 3.17. 76 78 80 68 58 50 48 56 10 52 76 78 80 68 58 50 48 56 10 52 74 72 62 60 58 50 46 54 8 42. 0.47 0.26 0.23 0.34 0.48 0.43 0.28 0.18 0.79 0.60 0.23 0.14 0.18 0.15 0.17 0.14 0.22 0.24 0.64 0.28 0.62 0.63 0.42 0.25 0.43 0.33 0.33 0.49 0.74 0.81. WM2. WM3. * P ⬍ 05; ** P ⬍ .01; *** P ⬍ .001; ns, nonsignificant.. 28 The Journal of Heredity 2001:92(1). 17.25*** 24.90*** 16.42*** 33.27*** 14.57*** 10.61*** 6.67*** 7.04*** 5.20ns 10.59*** 18.86*** 12.25*** 36.45*** 28.95*** 26.07*** 16.42*** 9.71*** 11.87*** 62.38** 6.42*** 12.84*** 4.41*** 8.30*** 10.27*** 4.49*** 10.51*** 8.53*** 9.95*** 1.60ns 3.77**. 0.13ns 10.04* 0.98ns 9.96* 3.02ns 4.03ns 0.00ns 3.74ns 0.13ns 0.88ns 0.18ns 0.50ns 0.53ns 2.54ns 4.48ns 1.91ns 5.13ns 0.00ns 0.13ns 0.19ns 17.67** 1.02ns 2.02ns 0.02ns 1.04ns 0.03ns 0.00ns 1.76ns 1.60ns 0.00ns. 4.02*** 3.47*** 10.96*** 3.81*** 3.00*** 4.46*** 8.25*** 10.95*** 2.29ns 2.00* 6.91*** 12.03*** 4.99*** 11.53*** 6.01*** 9.28*** 9.50*** 5.90*** 0.47ns 9.16*** 4.67*** 4.82*** 6.48*** 16.71*** 6.69*** 4.42*** 6.27*** 3.83*** 7.50** 3.92***.
(7) Appendix. Extended. Effect Individual. Side (df ⫽ 1). Interaction. Error. Trait. Sample. df. MS (⫻ 10000) F. MS (⫻ 10000) F. MS (⫻ 10000) F. df. MS (⫻ 10000). LM1. ST40 RB38 40 F1 38 F1 39 BC40 39 BC39 40 BC40 40 BC39 WART CONT ST40 RB38 40 F1 38 F1 39 BC40 39 BC39 40 BC40 40 BC39 WART CONT ST40 RB38 40 F1 38 F1 39 BC40 39 BC39 40 BC40 40 BC39 WART CONT. 37 38 39 33 28 24 23 27 4 25 37 38 39 33 28 24 23 27 4 25 36 35 30 29 28 24 22 27 3 20. 90.60 38.98 40.47 52.98 46.70 58.48 39.83 53.24 19.68 32.13 36.23 54.54 80.59 40.22 43.39 47.73 18.79 64.61 59.95 44.24 37.23 41.97 74.82 89.86 60.71 64.13 63.77 36.51 22.14 9.97. 2.53 0.78 0.02 0.96 0.00 0.83 0.17 1.40 0.16 7.11 10.42 5.96 4.39 19.05 4.36 2.31 13.65 3.40 12.80 1.21 10.22 3.33 0.16 0.00 0.78 1.85 3.68 0.05 7.70 0.84. 2.50 3.13 2.67 3.29 2.22 3.43 2.30 2.13 0.99 2.64 1.85 3.61 2.63 1.61 2.53 3.74 2.16 1.85 0.49 2.66 3.47 3.11 4.04 3.47 3.13 2.53 2.34 3.00 2.69 2.65. 76 78 80 68 58 50 48 56 10 52 76 78 80 68 58 50 48 56 10 52 74 72 62 60 58 50 46 56 8 42. 0.50 0.52 0.30 0.31 0.31 0.59 0.42 0.42 0.80 0.55 0.25 0.33 0.38 0.50 0.58 0.42 0.51 0.47 0.78 0.84 0.93 0.82 0.56 0.39 0.56 0.40 0.93 1.00 1.59 1.36. LM2. LM3. 36.19*** 12.45*** 15.18*** 16.12*** 21.01*** 17.07*** 17.29*** 24.95*** 19.97* 12.16*** 19.60*** 15.11*** 30.65*** 25.04*** 17.14*** 12.76*** 8.71*** 34.96*** 122.67** 16.63*** 10.74*** 13.50*** 18.50*** 25.93*** 19.37*** 25.30*** 27.27*** 12.18*** 8.24ns 3.76**. 1.01ns 0.25ns 0.01ns 0.29ns 0.00ns 0.24ns 0.07ns 0.65ns 0.16ns 2.69ns 5.64ns 1.65ns 1.67ns 11.86* 1.72ns 0.62ns 6.33ns 1.84ns 26.19ns 0.45ns 2.95ns 1.07ns 0.04ns 0.00ns 0.25ns 0.73ns 1.57ns 0.02ns 2.87ns 0.32ns. 5.05*** 6.07*** 9.01*** 10.64*** 7.10*** 5.81*** 5.49*** 5.03*** 1.24ns 4.80*** 7.38*** 10.79*** 7.00*** 3.22*** 4.40*** 8.87*** 4.26*** 3.93*** 0.62ns 3.15*** 3.73*** 3.79*** 7.24*** 8.82*** 5.62*** 6.35*** 2.50** 3.01*** 1.69ns 1.95*. Auffray et al • Developmental Stability and Rb Fusions 29.
(8)
Figure
Documents relatifs