See discussions, stats, and author profiles for this publication at: https://www.researchgate.net/publication/286314088
Structural and optical studies of GaAs nanocrystals embedded into polymer
host
Article in OPTOELECTRONICS AND ADVANCED MATERIALS-RAPID COMMUNICATIONS · May 2012
CITATIONS 3
READS 51 4 authors:
Some of the authors of this publication are also working on these related projects:
Fe 2 O 4 /ZnO-nanowires synthesis by dip-coating for Orange II-dye photodegradationView project
NanoscienceView project Nassim Touka University of Bouira 5PUBLICATIONS 39CITATIONS SEE PROFILE Boubekeur Boudine University of Constantine 1 71PUBLICATIONS 411CITATIONS SEE PROFILE Ouahiba Halimi University of Constantine 1 48PUBLICATIONS 216CITATIONS SEE PROFILE Miloud Sebais University of Constantine 1 57PUBLICATIONS 235CITATIONS SEE PROFILE
All content following this page was uploaded by Nassim Touka on 09 June 2016.
Structural and optical studies of GaAs nanocrystals
embedded into polymer host
N. TOUKAa,*, B. BOUDINEb, O. HALIMIb, M. SEBAISb
aUniversity of BOUIRA, Institute of Sciences, BOUIRA 010000, Algeria
bLaboratory of Crystallography, Department of Physics, University of Constantine, Road Ain El bey 25000, Algeria
GaAs nanocrystals (NCs) were prepared using a colloidal solution and dispersed in polystyrene (PS) matrix. Using spin coating technique, thin films deposited on glass substrates were prepared. Their structural and optical properties were investigated by X-ray diffraction, spectroscopy Raman, UV-visible absorption and photoluminescence respectively. The absorption spectra of these dispersed NCs exhibit excitonic peak resulting from the electron-hole coupling transitions. Due to a quantum confinement effect, a blue shift was deduced by comparison of such transition with respect to reported bulk band gap. Assuming a spherical like shape for these NCs, the crystallites radius (R) was estimated by applying the effective mass approximation model and was about ~ 3 nm. Such a weak radius value compared to Bohr radius (RB = 19 nm) leads
to a strong quantum confinement regime. Moreover, the influence of this confinement effect on Raman and photoluminescence properties was also studied.
(Received December 27, 2011; accepted June 6, 2012)
Keywords: Nanocrystals GaAs, Polystyrene (PS), Quantum confinement, Photoluminescence.
1. Introduction
Semiconductor nanocrystals deserve special attention due to their unique structural [1,2], optical [3,4] and electrical properties [5,6]. Since the properties are size dependent, vigorous research activities have been carried out aiming at the production of nanoparticles with narrow size distribution. There exist a lot of reports, describing the
synthesis of very good quality semiconductor
nanostructures both by physical and chemical methods. The III-V class of semiconductor like GaAs having direct bulk band gap 1.42 eV and Bohr exciton diameter 19 nm [7] has drawn a great attention due to its wide range of applicability in device physics. GaAs is the most suitable candidate for fabrication of photovoltaic devices, hetero structures, semiconductor lasers and light emitting diodes [7]. The association of semiconductors with other materials such as metals or oxides in the same core/shell heterostructure allows for the design of NCs combining different physical properties, for example, fluorescence, magnetism, different decay lifetimes, and so on. In such a manner, novel functional building blocks can be generated for applications in fields ranging from optoelectronics to information technology to healthcare [8]. The NCs doped thin films can be prepared by various deposition techniques like chemical vapour deposition (CVD), sputtering, electro deposition, vacuum evaporation, sol-gel process and colloidal solution.
We report in this work the synthesis, the structural characterization, and optical properties of GaAs-NCs dispersed into a transparent polystyrene matrix by
colloidal solution and deposited on a glass substrate using spin coating technique. Structural characterization is achieved though XRD and micro- Raman spectroscopy, while the optical properties are determined using optical absorption and photoluminescence. The low dimension of NCs size induces a quantum confinement effect leading to the size dependence of the band gap energy described well by the effective mass approximation (E.M.A) [9,10].
2. Experimental
GaAs-NCs doped polystyrene system was prepared by colloidal solution. A host solution was prepared by dissolving amorphous polymer Polystyrene (PS) in
chloroform (CHCl3) with a concentration of 0.02 g/ml.
This solution was stirred at 50°C for 2 hours. A guest solution was prepared with 0.20 g of mechanically crushed GaAs powder dispersed in 10 ml of chloroform. Finally, both solutions were mixed and homogenized by magnetic agitation for 24 h.
Glass slabs used as a substrate were degreased, rinsed thoroughly with distilled water before deposition of few droplets of NCs-GaAs doped PS solution. Thin films were deposited by spin coating technique performed under various conditions depending on the viscosity of the mixture. The rotational speed ranged from 300 to 2000 rpm in order to control the thickness. The deposition principle is based on homogeneous spreading using appropriate conditions. All experiments were performed at room temperature and ambient pressure.
584 N. Touka, B. Boudine, O. Halimi, M. Sebai
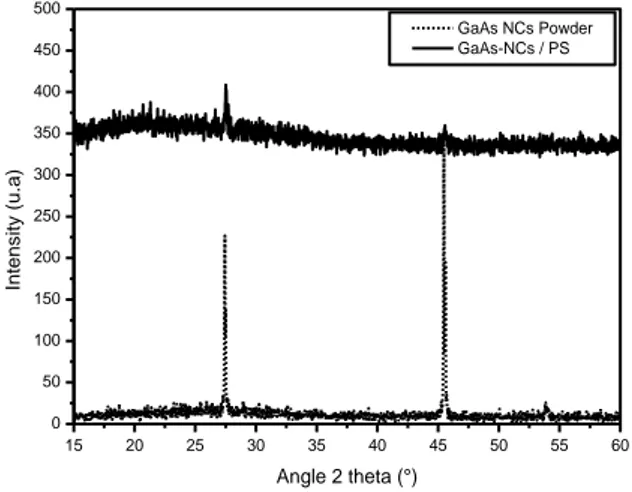
Table 1. GaAs NCs Radius calculation using the Scherrer formula (E 1). 2θ (°) Diffraction planes Δθ (°) Full width at half maximum (FWHM) Radius size (nm) (R) 27.55 (111) 0.2136 20.18 45.50 (220) 0.2259 17.59
X-ray diffraction patterns of the GaAs- NCs dispersed PS films were measured using an X-ray diffractometer model D8 Advance, Bruker with Ni filtered Cu radiation
generated at 40 kV and 30 mA (CuKα =1.542 A) as the
X-ray source. Film samples were cut into rectangular pieces (1cm×2 cm), mounted on the holder and used for analyses. The diffraction patterns were determined over a range of diffraction angles 2θ = 15 to 65° at a rate of 2° (in 2θ) per minute. Raman spectra were recorded in a back scattering configuration with a Jobbin Yvon micro Raman spectrometer coupled to a DX40 Olympus microscope. The samples of the polystyrene pure film and the composite film are excited with a 632.8 nm wavelength with an output of 20 mw. The absorption spectrum of the thin films was recorded using a UV-visible/NIR spectrophotometer (Perking Elmer, model Lambda 19) in
the spectrum range from 300 to 900 nm.
Photoluminescence data were obtained by exciting the sample at room temperature with a 350 nm radiation generated by an Argon laser.
3. Results and discussion
3.1. X-ray diffraction analysis
The X-ray diffraction (XRD) patterns of GaAs-PS guest host films (see Fig. 1) point the nanometric scale of the incorporated GaAs particles and its cubic structure
belonging to the
F 3
4
m
space group. The XRD patternsexhibit two sharp peaks at 2θ equal to: 27.55° and 45.50° which correspond respectively to the (111) and (220) cubic phase diffraction planes. The observation of two peaks indicates that the thin films consist of randomly oriented GaAs-crystallites, as there is no preferential orientation of the crystals. We can notice a considerable broadening of peaks this indicating low dimension of the incorporated GaAs-NCs in the PS matrix.
The average radius of the dispersed particles in the PS matrix was estimated using the Scherrer formula (E 1) in which the crystallites are assumed to possess a spherical shape.
cos
89
.
0
2
R
(1)R is particle radius, λ corresponds to CuKα tube
wavelength emission, θ is the diffracted angle and ∆θ the
full width at half maximum (FWHW) in radians of the peak. The calculated average value of the size of the particles was about 18.88 nm (Table 1) justifying hence the nanometric size of the particles.
Fig. 1. X-ray diffraction patterns of GaAs – PS nanocomposite thin film.
3. 2. Raman analysis
Fig. 2 shows the Raman spectrum of the PS pure and the composite thin films. As can be seen, Raman spectra have two peaks, which are assigned to the
longitudinal-optic (LO) mode at 286 cm-1 and transverse-optic (TO)
mode at 264 cm-1 of the GaAs nanocrystals embedded in
PS thin films, respectively. The positions of these two peaks shift to lower frequency with respect to bulk GaAs
(ωLO = 292 cm-1, ωTO = 268 cm-1) [11]. Furthermore, the
peaks are broadened; the LO mode-frequency red shift
ΔωLO (6 cm
-1
) is larger than that (4 cm-1) of the TO mode.
The shift and broadening of the Raman peaks decrease as the mean nanocrystal size increases. These effects may be explained by the phonon confinement model [12]. And
finally the resonance observed at 362 cm-1 originated from
amorphous As2O3 [13,14].
Fig. 2. Room-temperature Raman spectrum of (a) PS pure and (b) PS/ GaAs NCs composite thin film.
15 20 25 30 35 40 45 50 55 60 0 50 100 150 200 250 300 350 400 450 500 Int en s ity (u.a) Angle 2 theta (°) GaAs NCs Powder GaAs-NCs / PS 200 300 400 500 600 700 800 900 362 286 264 (b) (a) In te n si ty (a . u ) Raman shift (cm-1 )
3. 3. Absorption optical analysis
The absorption spectrum represents a signature of the studied material. Polystyrene polymer was used as host matrix because of its transparency in the visible wavelength range. Fig. 3 shows the optical absorption spectrum of the GaAs NCs-PS composite thin film. The observed spectrum exhibits an exciton absorption peak at 525 nm, showing a blue-shift of fundamental absorption edge to shorter wavelength due to quantum confinement effect. The excitonic peak broadening and the blue shift of its spectral position with respect to the bulk band gap depend upon the concentration of polymer matrix [15]. Depending on the ratio of NCs radius R to the
bulk-exciton Bohr radius aB, the quantum size effect is
theoretically classified into three different regimes; strong
confinement regime (R/aB<<1), weak confinement regime
(R/aB>>1), and intermediate confinement regime (R/aB~1)
[16]. The Bohr radius is the size of the region in which the individual motions of the electron and the hole are quantized. The amount of blue-shift can be explained quantitatively by means of the parabolic-band model [14]. In this system, the shift energy ΔEg is expressed as:
kR
e
R
m
E
r g 2 2 2 28
.
1
2
(2)Where R is the radius of NCs. In the above equation, k =
4πεrε0 where εr = 13.2 [17] and ε0 are dielectric constant of
NCs and permittivity of free space, respectively. And mr is
the reduced mass of electron–hole pair, mr = memh / (me
+mh), where me = 0.067m0 and mh = 0.46m0 [18] are the
effective masses of the electron and hole, respectively.
Fig. 3. Absorption spectra of GaAs NCs-PS composite thin film.
In order to get a better accuracy of the optical gap of GaAs-NCs, it was determined from the second derivatives of optical absorption spectra we found that Eg = 2.36 eV (Fig. 4) (bulk band gap 1.42 eV). We note that the optical band gap energy increases with a corresponding decrease of crystallite size [19]. Using Brus’s formula (E 2) the average radius was R (GaAs) ~ 3 nm. By comparing the
GaAs NCs average size to the Bohr radius of the exciton
which is about rB = 19 nm, we obtain R < rB corresponding
to a strong confinement regime.
Fig. 4. Second derivative of optical absorption of GaAs NCs-PS.
3. 4. Photoluminescence analysis
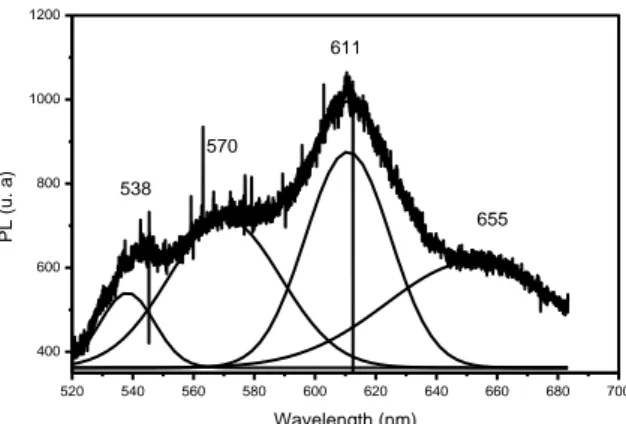
Photoluminescence (PL) of the GaAs NCs-PS guest host were carried out at room temperature (300 K) using 514.5 nm exciting radiation available from a Hg-Xe lamp. PL spectra exhibits a multiple band structure with four luminescence bands (Fig. 5). The first band occurring at 538.19 nm (2.30 eV) is in the proximity of first excitonic peak of the optical absorption spectra and has the minimum intensity [7]. Hence, this may be identified as the band edge luminescence and the other three peaks are attributed to the transitions involving surface states and shallow traps. Due to large surface to volume ratio a large number of unsaturated dangling bonds may create surface traps which influence the PL properties.
Fig. 5. photoluminescence spectra of GaAs NCs – PS composite.
In addition to this, the intensity of PL peaks as marked at 610 and 570 nm can be explained by arguing that electron and hole wave function of the GaAs-NCs get localized and better overlapped near the impurity site
500 520 540 560 525 nm Optical density (a. u) Wavelength (nm) 520 540 560 580 600 620 640 660 680 700 400 600 800 1000 1200 655 611 570 538 PL (u. a) Wavelength (nm) 400 450 500 550 600 650 -0,0004 0,0000 0,0004 525.26 nm (2.36 eV) Second d erivatives (a. u) wavelength (nm)
586 N. Touka, B. Boudine, O. Halimi, M. Sebai resulting in increased recombination cross section and
hence large intensity of luminescence [20].
4. Conclusions
The preparation of GaAs NCs using colloidal solution and their good incorporation in a polymer matrix is reported and supported by complementary investigations. Structural characterization by using X-ray diffraction indicates the incorporation of GaAs-NCs in the host matrix of PS. The results of the Raman scattering showed that two peaks assigned to (TO) and (LO) phonon of GaAs-NCs. These GaAs-NCs exhibit both a blue shift and discrete energy states at low crystallites size. A strong quantum confinement was established. Photoluminescence spectra of the GaAs NCs – Polymer exhibits multiband structure due to HOMO – LUMO transition and defect states. Transition impurity gives rise to deep trap and enhances the luminescence intensity.
References
[1] X. F. Yu, X. Liu, K. Zhang, Z. Q. Hu, J. Phys.
Condens. Matter.11, 739 (1999).
[2] X. S. Zhao, Y. R. Ge, J. Schroeder, P. D. Persans, Appl. Phys. Lett. 65(16), 2033 (1994).
[3] G. C. John, V. A. Shing, Phys. Rev. B 50(8), 5329 (1994).
[4] D. Zhang, R. M. Kolabs, Appl. Phys. Lett. 65(21), 2684 (1994).
[5] D. L. Klein, P. L. McEuen, J. E. Bowen katari, R. Roth, A. P. Alivisatos, Appl. Phys. Lett 68(18), 2574 (1996).
[6] T. Barron, P. Gentile, N. Magnea, P. Mur, Appl. Phys. Lett. 79(8), 1175 (2001).
[7] J. Nakay, S. N. Sahu, Applied Surface Science. 182, 407 (2001).
]8] P. Reiss, M. Protière, L. Li, small, 5(2), 154 (2009). [9] D. J. Norris, A. L. Efros, M. Rosen, G. Bawendi. Phys. Rew. B. 53, 16347 (1996).
[10] L. E. Brus, J. Chem. Phys. 79, 5566 (1983). [11] I. M. Tiginyanu, G. Irmer, J. Monecke, Semicond. Sci. Technol. 12, 491 (1997).
]12[ H. Richter, Z. P. Wang, L. Ley, Solid State Commun 39(5) 625 (1981).
[13] S. Zangooie, M. Schubert, T. E. Tiwald, J. A. Woollam, J. Mater. Res. 16, 5 (2001). [14] D. J. Lockwood, P. Schmuki, H. J. Labbé, J. W. Fraser, Physica E 4, 102 (1999).
[15] J. Nayak, S. N. Sahu, Physica E 30, 107 (2005). [16] H. S. Nalwa, Handbook of Nanostructured Materials and Nanotechnology, Academic Press, San Diego, 4(482-496), 555 (2000).
[17] C. Kittel, Introduction to Solid State Physics, 7th edition, John Wiley & Sons, INC, New York, 214 (1996).
[18] D. U. Saenger, Phys. Rev. B 54, 14604 (1996). ]19[ A. Chaieb, O. Halimi, A. Bensouici, B. Boudine, B. Sahraoui, J. Optoelectron. Adv. Mater. 11, 104 (2009).
[20] R. N. Bhargava, D. Gallagher, X. Hang, A. Nurmikko, Phys. Rev. Lett. 72, 416 (1994).
_________________________
*Corresponding author: [email protected]
View publication stats View publication stats