HAL Id: hal-01503539
https://hal.archives-ouvertes.fr/hal-01503539
Submitted on 7 Apr 2017HAL is a multi-disciplinary open access archive for the deposit and dissemination of sci-entific research documents, whether they are pub-lished or not. The documents may come from teaching and research institutions in France or abroad, or from public or private research centers.
L’archive ouverte pluridisciplinaire HAL, est destinée au dépôt et à la diffusion de documents scientifiques de niveau recherche, publiés ou non, émanant des établissements d’enseignement et de recherche français ou étrangers, des laboratoires publics ou privés.
Greenhouse gas intensity of three main crops and
implications for low-carbon agriculture in China
Wen Wang, Yuebin Lin, Liping Guo, Yingchun Li, Man Su, Christian de
Perthuis, Xiaotang Ju, Erda Lin, Dominic Moran
To cite this version:
Wen Wang, Yuebin Lin, Liping Guo, Yingchun Li, Man Su, et al.. Greenhouse gas intensity of three main crops and implications for low-carbon agriculture in China. Climatic Change, Springer Verlag, 2015, 128 (1-2), �10.1007/s10584-014-1289-7�. �hal-01503539�
Les Cahiers de la Chaire Economie du Climat
Greenhouse gas intensity of three main crops and
implications for low-carbon agriculture in China
Wen Wang
1,2, Yuebin Lin
1, Liping Guo
1, Yingchun Li
1,2, Man Su
3,
Christian de Perthuis
2, Xiaotang Ju
4, Erda Lin
1,6, Dominic Moran
5China faces significant challenges in reconciling food security goals with the objective of becoming a low-carbon economy. Agriculture accounts for approximately 11% of China's national greenhouse gas (GHG) emissions with cereal production representing a large proportion (about 32%) of agricultural emissions. Minimizing emissions per unit of product is a policy objective and we estimated the GHG intensities (GHGI) of rice, wheat and maize production in China from 1985 to 2010. Results show significant variations of GHGIs among Chinese provinces and regions. Relative to wheat and maize, GHGI of rice production is much higher owing to CH4 emissions, and is more closely related to yield levels. In general, the south and central has been the most carbon intensive region in rice production while the GHGI of wheat production is highest in north and northwest provinces. The southwest has been characterized by the highest maize GHGI but the lowest rice GHGI. Compared to the baseline scenario, a 2% annual reduction in N inputs, combined with improved water management in rice paddies, will mitigate 17% of total GHG emissions from cereal production in 2020 while sustaining the required yield increase to ensure food security. Better management practices will entail additional gains in soil organic carbon further decreasing GHGI. To realize the full mitigation potential while maximizing agriculture development, the design of appropriate policies should accommodate local conditions.
Keywords : food security, low-carbon agriculture, greenhouse gas intensity, China.
n° 2014-09
Working Paper Series
1. Institute of Environment and Sustainable Development in Agriculture, Chinese Academy of Agricultural Sciences, Beijing 100081, China
2. Climate Economics Chair, Paris-Dauphine University, Paris 75002, France 3. Graduate School of the Chinese Academy of Agricultural Sciences, Beijing
100081, China
4. College of Resources and Environmental Sciences, China Agricultural University, Beijing 100193, China
5. Land Economy and Environment Research Group, Scotland’s Rural College, Edinburgh EH9 3JG, Scotland
6. Corresponding author: Erda Lin, e-mail: lined@ami.ac.cn; telephone: +8610 82105998; fax: +8610 82105998; address: Room 303, Institute of Environment and Sustainable Development in Agriculture, Chinese Academy of Agricultural Sciences, Beijing 100081, China
1
Title 1
Greenhouse gas intensity of three main crops and implications for low-carbon agriculture in China
2 3
Author names and affiliations 4
Wen Wanga,b, Yuebin Lina, Liping Guoa, Yingchun Lia, Man Suc, Christian de Perthuisb, Xiaotang Jud,
5
Erda Lina,*, Dominic Morane 6
a
Institute of Environment and Sustainable Development in Agriculture, Chinese Academy of
7
Agricultural Sciences, Beijing 100081, China, b Climate Economics Chair, Paris-Dauphine University,
8
Paris 75002, France, c Graduate School of the Chinese Academy of Agricultural Sciences, Beijing
9
100081, China, d College of Resources and Environmental Sciences, China Agricultural University,
10
Beijing 100193, China, e Land Economy and Environment Research Group, Scotland’s Rural College,
11
Edinburgh EH9 3JG, Scotland.
12
*Corresponding author: Erda Lin, e-mail: lined@ami.ac.cn; telephone: +8610 82105998; fax: +8610
13
82105998; address: Room 303, Institute of Environment and Sustainable Development in Agriculture,
14
Chinese Academy of Agricultural Sciences, Beijing 100081, China.
15 16
2
Abstract: 17
China faces significant challenges in reconciling food security goals with the objective of becoming a
18
low-carbon economy. Agriculture accounts for approximately 11% of China's national greenhouse gas
19
(GHG) emissions with cereal production representing a large proportion (about 32%) of agricultural
20
emissions. Minimizing emissions per unit of product is a policy objective and we estimated the GHG
21
intensities (GHGI) of rice, wheat and maize production in China from 1985 to 2010. Results show
22
significant variations of GHGIs among Chinese provinces and regions. Relative to wheat and maize,
23
GHGI of rice production is much higher owing to CH4 emissions, and is more closely related to yield
24
levels. In general, the south and central has been the most carbon intensive region in rice production
25
while the GHGI of wheat production is highest in north and northwest provinces. The southwest has
26
been characterized by the highest maize GHGI but the lowest rice GHGI. Compared to the baseline
27
scenario, a 2% annual reduction in N inputs, combined with improved water management in rice
28
paddies, will mitigate 17% of total GHG emissions from cereal production in 2020 while sustaining
29
the required yield increase to ensure food security. Better management practices will entail additional
30
gains in soil organic carbon further decreasing GHGI. To realize the full mitigation potential while
31
maximizing agriculture development, the design of appropriate policies should accommodate local
32
conditions.
33
Key words: food security, low-carbon agriculture, greenhouse gas intensity, China 34
3
Research highlights 35
►Greenhouse gas intensity (GHGI) of rice, wheat and maize production are estimated on provincial,
36
regional and national scales in China
37
►Substantial variation in GHGI of cereal production exists among provinces and regions
38
► Reducing GHG emissions, ensuring food security and improving soil fertility can be achieved
39
simultaneously
40
►GHGI of cereal production stabilized or decreased after 2005 and should further decline to ensure the
41
successful transition towards low-carbon agriculture
42
4
1. Introduction
44
China has made substantial efforts to increase crop production to feed about 20% of the global
45
population with only 8% of the world’s arable land (World Bank 2013). From 1961 to 2010, total
46
cereal production has increased almost five-fold from 107 to 497 million tons (Mt) and crop yields
47
have improved at almost the same pace (FAO 2013). Looking towards 2020, the government set a
48
target of increasing national grain production capacity to over 545 Mt to meet growing demands for
49
higher animal protein diets and to maintain the domestic food self-sufficiency rate at 95% (NDRC
50
2009). This implies that while constrained by limited arable land, grain yield must grow by at least 0.9%
51
annually in the period 2011-2020. While facing this food security challenge China is also grappling
52
with related constraints in terms of declining water availability, an increasing opportunity cost of rural
53
labour and the challenges of climate change. The latter has emerged as a significant threat to
54
agricultural production, altering weather conditions and causing more frequent extreme weather events
55
and disasters (IPCC 2007a).
56
While vulnerable to climate change agriculture is also a significant source of anthropogenic
57
greenhouse gases (GHG) emissions (IPCC 2007b). The sector emitted approximately 820 Mt CO2
58
equivalent (CO2e) in 2005, or 11% of the national total (NCCC 2012). Agriculture was the largest
59
source of nitrous oxide (N2O) and methane (CH4) emissions, arising mainly from livestock enteric
60
fermentation, Nitrogen (N) additions to cropland, rice cultivation and animal waste management.
61
Cropland N2O emissions produced in soils through the microbial processes of nitrification and
62
denitrification was responsible for 25% of agriculture GHG emissions in 2005 and CH4 emissions from
63
rice cultivation contributed 20%. Cereal production (rice, wheat and maize) accounted for about 47%
64
of national N fertilizer consumption (Heffer 2009) and generated around 32% of GHG emissions from
65
agriculture.
66
The sector is now under increasing scrutiny for its ability to mitigate climate change through both
67
emissions reduction and carbon (C) sequestration. A range of abatement measures have been identified
68
as applicable in the arable sector (e.g. IPCC 2007b; Oenema et al 2001; Smith et al 2008), which can
69
be broadly grouped into increased nitrogen use efficiency (NUE), improving water regimes in rice
70
paddies and sequestering C into cultivated soils. Many mitigation measures could actually be cost
71
saving, simultaneously reducing input costs and/or enhancing productivity (Wreford et al. 2010).
72
Further, in recent decades soil organic carbon (SOC) content of cropland has increased along with
5
improved crop yields in most regions of China (Huang and Sun 2006; Pan et al. 2010; Yan et al. 2011;
74
Yu et al. 2012) and is predicted to continue to increase in the next 40 years (Yu et al. 2013). These
75
findings highlight the important role of cropland in achieving emission reduction, safeguarding food
76
security and enhancing carbon sequestration.
77
The Chinese government has recently put more effort into combating climate change and national
78
mitigation aspirations have been outlined in the 12th Five-Year Plan (FYP) to cut the carbon intensity
79
of the economy by 17% in 2015 compared with 2010 levels. The 12th FYP also called for controls on
80
agricultural GHG emissions. In response, the Ministry of Agriculture (MOA) has initiated programs to
81
improve fertilizer use efficiency by 3% and enhance irrigation water use efficiency by 6% by 2015
82
from 2010. In addition, the government has planned to bring an additional 11.3 Mha of croplands
83
under conservation tillage between 2009-2015 in north China (MOA 2009). The growing desire to
84
integrate climate change dimensions into agricultural policies reflects the government’s willingness to
85
pursue low carbon development in agriculture, characterized by higher productivity, more efficient use
86
of resources and low GHG emissions intensity (Norse 2012).
87
The concept of GHG intensity (GHGI), expressed as the overall GHG emissions per unit of
88
product, is suggested as a useful metric to evaluate NUE and to help identify mitigation strategies
89
(Chen et al. 2011; Venterea et al. 2011; Tubiello et al. 2012). Applying such an indicator can encourage
90
better management practices resulting in higher crop production per area and reduced N losses and
91
GHG emissions (van Groenigen et al. 2010).
92
In this context, the Global Research Alliance on Agricultural Greenhouse Gases was launched in
93
December 2009 to help reduce the GHGI of agricultural production. FAO (Tubiello et al. 2014)
94
reported that over the period 1961-2010 the world average GHGI of rice decreased by 49% while that
95
of main cereals (wheat and maize) increased by 45%, and suggested that effective mitigation strategies
96
are needed to achieve sustainable intensification, ensuring that further efficiency improvements can
97
lead to reduced absolute emissions. Bonesmo et al. (2012) investigated the GHGI of 95 arable farms in
98
Norway and suggested that increased gross margins in grain and oilseed crop production could be
99
achieved with decreasing GHGI. The GHGI of cereal production on experimental sites was also
100
quantified to compare the overall mitigation effects of different abatement measures. Findings (e.g.
101
Mosier et al. 2006; Shang et al. 2011; Huang et al. 2013; Ma et al. 2013) indicated that economic and
102
climate benefits can be simultaneously achieved by improved management practices. But to date there
6
is no synthetic estimate of current and historical GHGI of cereal production on a national, regional or
104
provincial level in China. Such information is crucial for identifying efficient regional mitigation
105
strategies and actions tailored to local agricultural production systems and management practices.
106
This paper provides estimates of GHGI for rice, wheat and maize production using agro-statistics
107
data for the national, regional and provincial scale for 2006. To illustrate the trends and the evolution
108
of intensity we quantity national and regional GHGI from 1985 to 2010 at 5-year intervals and analyze
109
emission reduction and carbon sequestration potentials from cereal production. The aim is to provide
110
suggestions on possible national or regional policies to foster sustainable intensification in rural China.
111
The paper is structured as follows. Section two describes the derivation of GHGI and outlines data
112
sources for projecting intensities. Section three discusses the results before a conclusion in section
113
four.
7
2.
Materials and methods
115
2.1.Methodology
116
GHGI refers to the climatic impacts of agriculture practices in terms of per unit of product and is
117
calculated by dividing total Global Warming Potential (GWP)-weighted emissions of cereal production
118
by crop yield. N2O emissions are accounted for quantifying GHGI of wheat and maize production
119
while both CH4 and N2O are considered for rice paddies. Carbon sequestration is not directly included
120
in the estimate of GWP-weighted emissions due to large uncertainties in SOC content and limited data
121
availability. Despite consensus on the average SOC increment in China’s cropland, discrepancies in
122
annual intensity change rates have been reported using various methods (Huang and Sun 2006; Sun et
123
al. 2010 ; Pan et al. 2010; Yan et al. 2011; Yu et al. 2012). In addition, SOC density change data at the
124
provincial level is unavailable. Nevertheless, SOC change patterns and interactions with GHGI will be
125
analyzed in the discussion section. The analysis focuses on emissions within the farm gate, i.e. they are
126
not full life-cycle assessment (e.g. emissions related to energy use and fertilizer manufacture and
127
transportation).
128
We followed the 2006 IPCC Guidelines for National Greenhouse Gas Inventories (IPCC, 2006) to
129
estimate N2O emissions from rice, wheat and maize production (Eqn (S1)). We considered direct N2O
130
emissions from the three major N input sources - synthetic fertilizers, organic manure and crop
131
residues. Due to high uncertainty and relatively minor contribution, indirect N2O emissions via N
132
deposition (associated with ammonia volatilization) and nitrate leaching and runoff were not taken into
133
account. Quantification of CH4 emissions from rice paddies was based on regional CH4 flux from
134
comprehensive studies conducted by Zhang et al. (2011a).
135 N O2 CH 4 44 28 GWP GWP 2 4 2 4 4 N O CH (FR) input N O 2 1(FR) CH (FR) CH (FR) input 2 SN AW CR Emissions + Emissions GHGI = Yield Emissions = N O - N EF Emissions = Flux N O - N = F + F + F (S1) 136
GHGI is the GHG intensity of crop production (kgCO2e/t). EmissionsN2O is the per hectare N2O
137
emissions from rice, wheat or maize fields (kgCO2e/ha). EmissionsCH4(FR) is the per hectare CH4
138
emissions from rice paddies(kgCO2e/ha).Yield denotes the per hectare average production (t/ha).
139
N2O-Ninput represents the per hectare total N inputs (kgN/ha). EF1 and EF1(FR) are the emission factors
8
for N2O emissions from N input for uplands and rice paddies, respectively (kg/kg). 44/28 is to convert
141
emissions from kg N2O-N to kg N2O. FluxCH4(FR) represents the CH4 flux from rice paddies (kgCH4/ha).
142
GWPN2O and GWPCH4denote the direct GWP of N2O and CH4 respectively at the 100yr horizon, 298
143
and 25. FSN, FAW, FCR represent per hectare N input from synthetic fertilizers, animal manure and crop
144
residues, respectively (kgN/ha).
145
FAW was estimated following Eqn (S2).
146 1- ) 365 1000 _ _ 365 365 T Grazing T T Loss T) T AW eqv T T rate(T) S T T T T
eqv veg fruit other
N 1 - Frac Nex Frac F
CA TAM
Nex N
N
N Days alive if Days alive CA = a CA +b CA +CA = = = <
∑
() ( () ( ) ( (S2) 147NT is the annual population of livestock T. T denotes livestock category. FracGrazing(T) is the fraction
148
of grazing population (%). NexT represents the annual N excretion (kgN/animal/yr). FracLoss(T)
149
represents the amount of managed manure N that is lost in the manure management system (%). CAeqv
150
denotes the equivalent cropping area (kha). Nrate(T) denotes the default N excretion rate (kgN/(1000 kg
151
animal mass/day)). TAMT is the typical animal mass (kg/animal). Days_aliveT is the average breeding
152
days before slaughter. NS(T) is the average number slaughtered (or use stock number if average
153
breeding days exceed a complete year). CAveg, CAfruit and CAother are the cropping areas of vegetables,
154
fruits and other crops (total excluding vegetable and fruits), respectively (kha). a and b is the ratio of
155
organic manure received by respectively vegetable fields and fruits compared with other crop lands.
156
FCR was estimated following Eqn (S3).
157 ( ) CR- AG(i) CR- BG(i) i CR i i
i ST -GR(i) i SR(i) BG - AG(i) i i i F + F F CA Pdt R N R R CA = + =
∑
∑
∑
∑
(S3) 158FCR-AG(i) and FCR-BG(i) represent the N input from aboveground and belowground crop residues,
159
respectively (kgN/ha). i denotes crop type (rice, wheat, maize). CAi is the annual cropping area (kha).
160
Pdti is the annual harvestedproduct (kt). RST-GR(i) is the ratio of straw to grain in terms of dry matter. Ni
9
is the N content of crop i residue (g/kg). RSR(i) is the proportion of above-ground residue returned to
162
land (%). RBG-AG(i) is the ratio of below-ground residue weight to above-ground plant weight.
163
Since N application rates for the three main cereals are only available for 2005 and 2010 at 5-year
164
intervals, Eqn (S4) was formulated to estimate the N application rate in a given year.
165
• SNj • j • 2005
SN(i)j SN(i)2005 SN(i)2005
SN2005 j 2005 F TN TCA F F F F TCA TN = = (S4) 166
FSN(i)j is the N application rate in year j in a province (kgN/ha). i denotes crop type (rice, wheat,
167
maize) and j denotes year. FSN(i)2005 is the N rate of crop i in 2005(kgN/ha). FSNj and FSN2005 denote the
168
crop-wide average N rate in year j and 2005, respectively (kgN/ha). TNj and TN2005 are the provincial
169
total synthetic N consumption in year j and 2005(kt). TCAj and TCA2005 represent the total cropping
170
area in year j and 2005(kha).
171
2.2. Data sources and treatment
172
We used the three-year average of 2005-2007 to represent 2006 conditions to avoid large interannual
173
variations in the dataset. Agriculture activity data (cropping area, production, yield, total N fertilizer
174
consumption and livestock number) were extracted from the China Rural Statistical Yearbooks (MOA
175
1986-2013) and the China Livestock Yearbooks (MOA 2001-2011). Per hectare N application rates for
176
individual crops were collected from the China Agricultural Products Cost-Benefit Yearbooks (NDRC
177
1998-2011), and we adopted N fraction of 30% in the reported compound and mixed fertilizers (Sun
178
and Huang, 2012). China-specific emission factors for direct N2O emissions from croplands were
179
obtained from studies by Gao et al. (2011), which are 0.0105 and 0.0041 for upland fields and rice
180
paddies, respectively. CH4 fluxes of rice paddies were direct CH4MOD modeled results from studies
181
by Zhang et al. (2011a), which were employed for compiling National GHG Emission Inventories.
182
The annual number of livestock slaughtered was collected for pigs, hens, broiler chicken and
183
rabbits with the average breeding days standing at 158, 65, 352 and 105, respectively (MOA
184
2001-2011). For other types of animals, annual stock numbers were used. The fraction of grazing cattle
185
or sheep was the ratio of total grazing animals (the sum of livestock numbers in grazing areas and
186
half-grazing areas) to the total stock number (MOA 2001-2011). a and b in Eqn (S2)were assigned 4
187
and 5 since survey results (Huang and Tang 2010; Zhang et al. 2013) reported that vegetable and fruit
188
fields generally received respectively 4 and 5 times more organic manure than cereal cropping lands in
10
the 2000s.
190
Other information required in Eqn (S2) was selected from relevant literature and IPCC default
191
values corresponding to conditions in China as displayed in Table 1a. Values for parameters in Eqn
192
(S3) were mainly obtained from the research by Gao et al. (2011) and are summarized in Table 1b. The
193
proportion of above-ground straw residues returned to land in 2006 was derived from results report by
194
Gao et al. (2009). The nationwide ratio of straw retuned to land was reported at 15.2% in 1999 (Han et
195
al. 2002) and rose to 24.3% in 2006 (Gao et al. 2009), implying an annual rate of increase of 6.93%.
196
This rate was employed to estimate the percentage of straw recycled to farmland in target years.
197
Table 1a Selected values for estimating N input to croplands from animal manure
198 Non-dairy cattle Milk cows Sheep
(goats) Horses Asses Mules Pigs Chicken Rabbits FracGrazing a 17% 35% Nrate 0.34 0.47 1.27 0.46 0.46 0.46 0.50 0.82 TAM 319 350 29 238 130 130 50b 2 Nex 39.6 60.0 13.4 40.0 21.8 21.8 9.1 0.5 8.1 FracLoss 40% 40% 67% 50% 50% 50% 35% 50% 50% Days_alivec 158 180 105
a Data in this table represents the national average.
199
b IPCC default value for Asia is 28. Here we adopted 50 according to Chinese conditions.
200
c
Days_alive of chicken is the weighted number of broiler chicken (65 days) and hens (352 days), which account
201
for 60% and 40% of chicken population, respectively.
202
Table 1b Selected values for estimating N input to croplands from crop residues
203
Rice Wheat Maize
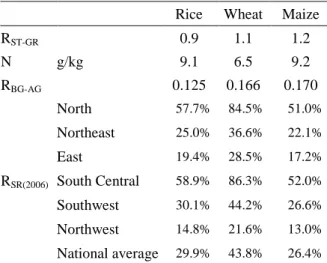
RST-GR 0.9 1.1 1.2 N g/kg 9.1 6.5 9.2 RBG-AG 0.125 0.166 0.170 RSR(2006) North 57.7% 84.5% 51.0% Northeast 25.0% 36.6% 22.1% East 19.4% 28.5% 17.2% South Central 58.9% 86.3% 52.0% Southwest 30.1% 44.2% 26.6% Northwest 14.8% 21.6% 13.0% National average 29.9% 43.8% 26.4%
Note: North region includes Beijing, Tianjin, Hebei, Shanxi and Inner Mongolia; Northeast region includes
204
Heilongjiang, Liaoning and Jilin; East region includes Shanghai, Anhui, Fujian, Jiangsu, Jiangxi, Shandong and
205
Zhejiang; South Central region includes Guangdong, Hainan, Henan, Hubei, Hunan and Guangxi; Southwest
206
region includes Chongqing, Guizhou, Sichuan, Yunnan and Tibet; Northwest region includes Gansu, Qinghai,
207
Shaanxi, Ningxia and Xinjiang.
11
Regional level SOC data for rice paddy and upland in 2010 were derived from Yu et al. (2013) to
209
represent 2006 levels, and historic SOC contents were derived from similar research by Yu et al.
210
(2012).
211
2.3. Design of emission scenarios for future cereal production
212
To project total GHG emissions and investigate mitigation potential from cereal production in China to
213
2020, we designed four agricultural management scenarios based on historical trends and the increase
214
in expected future productivity. Total GHG emissions shall be affected by the GHGI and grain
215
production, or N input and CH4 flux levels, yield and cultivated area of each crop. The annual rates of
216
change for these factors over 2010-2020 are summarized in Table 2.
217
Table 2 Emission scenarios (annual rates of change) for cereal production
218
Scenario S0 S1 S2 S3
IN2O Constant rice -0.5% wheat -1% maize -1.5% rice -1.5% wheat -2.0% maize -2.5% rice -2.5% wheat -3.0% maize -3.4% Ninput rice +0.5% wheat +1% maize +1.5% Constant rice -1% wheat -1% maize -1% rice -2% wheat -2% maize -2% Yield rice +0.5% wheat +1% maize +1.5%
Same as S10 Same as S10 Same as S10
ICH4 -0.5% -0.5% -0.5% -1.5%
CH4 flux Constant Constant Constant -1% Cropping area Constant Constant Constant Constant
To examine the impacts of GHGI change on overall emissions, cultivated area of each crop were
219
assumed constant from 2010 to 2020. In all scenarios, 0.5%, 1% and 1.5% annual increase in yield
220
were assigned for rice, wheat and maize respectively, based on 2005-2013 yield data released by the
221
MOA (2006-2013). S0 is a conservative scenario that prescribes the same proportion of increase in N
222
input relative to yield improvement. Scenario S1 assumes that no further N input is required to sustain
223
equal productivity as in S0, while the N rate decreases by 1% per year under S2. Scenario S3 is an
224
optimal scenario incorporating best management practices to cut the overall N rates and improve the
225
irrigation regimes in rice paddies while achieving the yield requirements for safeguarding national
226
food self-sufficiency.
12
3.
Results and discussions
228
3.1. GHGI of rice production in 2006
229
GHGI of rice production in 2006 ranged from 730 kgCO2e/t in Ningxia Province to 1,549 kgCO2e/t in
230
Hainan Province, with a national average of 947 kgCO2e/t (Fig. 1a). In general, CH4 made up about 90%
231
of the total GHG emissions and was therefore the dominant gas in determining the carbon footprint of
232
rice cultivation. Consequently, there was no obvious relationship between GHGI levels and N
233
application rates, the latter being the major source of N2O emissions. It is, however, evident that the
234
estimated GHGI for rice production was negatively correlated with yield levels. There was a large
235
provincial variation in GHGI (Fig. 2a) with the most carbon intensive provinces located in the
236
southeast coastal areas due to the highest regional CH4 flux (250 kg/ha). The low GHGI of rice
237
production in the southwestern provinces (Sichuan, Chongqing, Guizhou and Yunnan) can be
238
attributed to lower CH4 flux (200 kg/ha) relative to other places (215-250 kg/ha). Among the six major
239
rice producing provinces, which accounted for 55% of the national production, Hunan and Jiangxi had
240
higher GHGIs than the national average, while Hubei, Jiangsu, Sichuan and Heilongjiang were below
241
the national mean.
242 243 (a) 244 0 2 4 6 8 10 0 400 800 1200 1600 H ai n an G u an g x i G u an g d o n g Ji an g x i H u n an F u ji an A n h u i H eb ei S h aa n x i H en an N at io n al a v g . Z h ej ia n g H u b ei Y u n n an H ei lo n g ji an g T ia n ji n G u iz h o u C h o n g q in g L ia o n in g In n er m en g o li a S h an g h ai Ji an g su S ic h u an Ji li n S h an d o n g N in g x ia Y ie ld ( t/ h a ) N r a te ( 1 0 0 k g N /h a ) R ic e G H G I (k g C O2 e/ t) Province
N2O emissions CH4 emissions
13 245 (b) 246 247 248 (c) 249
Fig.1. GHGI of rice (a), wheat (b) and maize (c) production in different provinces in 2006 250 0 2 4 6 8 0 100 200 300 400 500 600 N in g x ia In n er m en g o li a S h aa n x i Y u n n an G an su H u b ei S h an x i S h an g h ai B ei ji n g H eb ei T ia n ji n Ji an g su S ic h u an N at io n al a v g . G u iz h o u C h o n g q in g A n h u i S h an d o n g X in ji an g H en an Q in g h ai H ei lo n g ji an g Y ie ld ( t/ h a ) N r a te ( 1 0 0 k g N /h a ) Wh ea t G H G I (k g C O2 e/ t) Province
Straw N Manure N Fertilizer N
Yield N rate 0 2 4 6 8 0 100 200 300 400 500 600 Y u n n an S h aa n x i G u an g x i G an su H u b ei A n h u i Ji an g su B ei ji n g S ic h u an T ia n ji n H eb ei In n er m en g o li a C h o n g q in g G u iz h o u N at io n al a v g . N in g x ia S h an x i H en an S h an d o n g L ia o n in g X in ji an g H ei lo n g ji an g Ji li n Y ie ld ( t/ h a ) N r a te ( 1 0 0 k g N /h a ) M a iz e G H G I (k g C O2 e/ t) Province
Straw N Manure N Fertilizer N Yield N rate
14 251 (a) 252 253 (b) (c) 254
Fig.2. The provincial GHGI levels of rice (a), wheat (b) and maize (c) production for 2006 255
3.2. GHGI of wheat and maize production
256
The national average GHGI of wheat (Fig. 1b) and maize (Fig. 1b) for 2006 production were 265
257
kgCO2e/t and 230 kgCO2e/t, respectively. Large spatial variability can be observed among provinces.
258
For example, producing one ton of wheat in Ningxia emitted 3 times more N2O than in Heilongjiang,
259
attributable to significant differences in synthetic N input and wheat and maize yields between Chinese
260
provinces. In general, synthetic N fertilizer made up at least 70% of total emissions and was therefore
261
the primary emission contributor. Fig. 1 also shows that the trends of GHGI, which are affected by
262
place-specific yield levels, were not necessarily consistent with those of per hectare N application rates.
263
For instance, although the N application rate for maize in Ningxia (280 kgN/ha) was 30% higher than
264
in Guangxi (215 kgN/ha), a much higher yield in Ningxia (6.97t/ha) than in Guangxi (3.88 t/ha) results
265
in a lower maize GHGI in Ningxia. In contrast, a high N rate and low wheat productivity made
266
Ningxia the most carbon intensive province for wheat cultivation.
15
The geographic variations of GHG emissions per ton of wheat (Fig. 2b) and maize (Fig. 2c) show
268
both similarities and differences. In general, similar levels of GHGI can be observed for wheat and
269
maize production (except for Ningxia); e.g. Yunnan was one of the most carbon intensive areas for
270
both wheat and maize production in 2006. The levels of maize GHGI converged to the range of
271
200-300 kgCO2e/t, with obvious correlation with N rates and yields. Provincial discrepancies were
272
more evident for wheat GHGI. Among the five major wheat producing areas - Henan, Shandong,
273
Hebei, Anhui and Jiangsu, which contributed about 73% of the national production, GHGI levels in
274
Hebei and Jiangsu were superior to the national average. Among the major maize producing areas,
275
only Hebei had a higher GHGI than the national mean, while Jilin, Shandong, Henan and Heilongjiang
276
were lower.
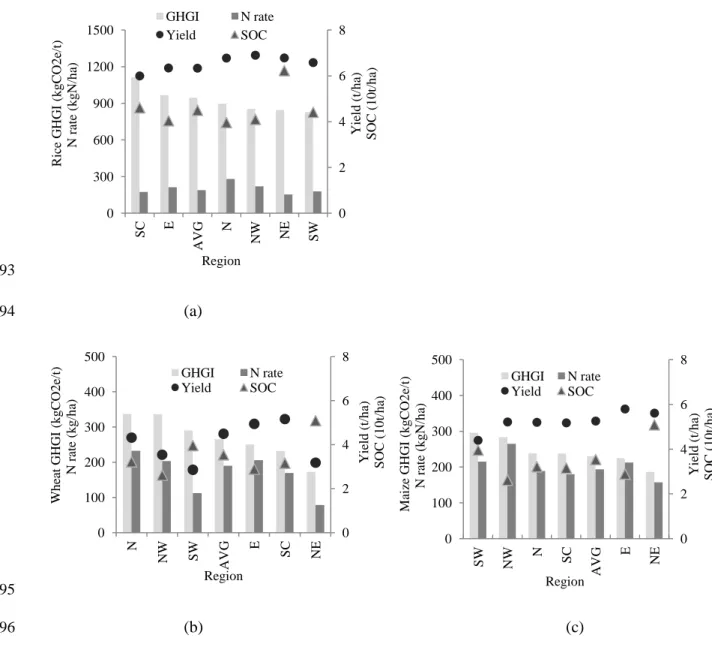
277
3.3. Implications for regional GHGI reduction strategies
278
The GHGI, yield and synthetic N rate of rice, wheat and maize cultivation as well as the SOC content
279
at the regional scale in 2006 are illustrated in Fig. 3. In general, the southwest had lowest cereal yields,
280
albeit second highest SOC after the northeast. Conversely more N fertilizers were added to croplands
281
in northwest provinces to compensate poor soil fertility, resulting in elevated regional GHGI of crop
282
production. Fig. 3 reveals that yield levels do not necessarily correspond to local SOC status, since
283
productivity is also influenced by climate, precipitation and other factors. In this regard, regional
284
strategies to minimize GHGI and improve soil fertility should accommodate local climatic, soil and
285
water conditions and management practices. For example, in the northwest measures improving SOC
286
density (e.g. conservation tillage) should be favored to enhance soil fertility and land productivity. In
287
intensive cropping systems in east and north China where over-fertilization is prominent, more
288
efficient use of N fertilizer can allow N rates to be cut by 30 to 60% without sacrificing crop yields (Ju
289
et al. 2009). Although the northeast was the least carbon intensive region in cereal production, this
290
came at the expense of net carbon losses, especially in Heilongjiang Province (Pan et al. 2010; Yu et al.
291
2012), thus calling for better management practices to sustain soil fertility in this region.
16 293 (a) 294 295 (b) (c) 296
Fig.3. GHGI of rice (a), wheat (b) and maize (c) production in different regions in 2006 and its 297
relationship with yield, N rates and SOC content. NE, N, NW, E, SC, SW and AVG refer to northeast,
298
north, northwest, east, south and central, southwest China, and national average, respectively.
299
3.4. Historical trends of regional GHGI of cereal production
300
Fig. 4a shows that national GHGI of rice production evolved at a different way to those of wheat and
301
maize production, and the latter has always been the least carbon intensive of the three crops. Rice
302
GHGI saw little variation beween 1985 and 2000, which can be explained by nearly the same rate of
303
growth in the CH4 flux, yield (Fig. 4b) as well as the N application rate over this period. However,
304
when rice yield reached a periodic peak in 1998 the CH4 flux continued to climb, resulting in a sharp
305
rise in GHGI in the first decade of the 21st century. Wheat and maize GHGIs had been steadily
306 0 2 4 6 8 0 300 600 900 1200 1500 S C E A V G N N W NE S W Y ie ld ( t/ h a) S O C ( 1 0 t/ h a) R ic e G H G I (k g C O 2 e/ t) N r at e (k g N /h a) Region GHGI N rate Yield SOC 0 2 4 6 8 0 100 200 300 400 500 N N W S W A V G E S C N E Y ie ld ( t/ h a) S O C ( 1 0 t/ h a) W h ea t G H G I (k g C O 2 e/ t) N r at e (k g /h a) Region GHGI N rate Yield SOC 0 2 4 6 8 0 100 200 300 400 500 S W N W N SC A V G E N E Y ie ld ( t/ h a) S O C ( 1 0 t/ h a) M ai ze G H G I (k g C O 2 e/ t) N r at e (k g N /h a) Region GHGI N rate Yield SOC
17
increasing from 1985 to 2000 since the growth rate of N application exceeded the rate of yield
307
improvement. The GHGI began to stablize or even decrease after 2000 as the combined effects of
308
increasing yields, abeit at a lower rate, and a stabilized synthetic N rate promoted by the national “Soil
309
testing and fertilizer recommendation program” (MOA 2005) initiated in 2005. At the national level,
310
some studies (e.g. Pan et al. 2009) suggest a positive correlation between SOC improvement and
311
cereal productivity increase (Fig. 4b).
312
313
(a) (b)
314
Fig.4. Historical trends of national average GHGI (a) and yield (b) of rice, wheat and maize production 315
Fig. 5 illustrates that nearly all regional GHGI of rice(a), wheat(b) and maize(c) production
316
reached a higher level in 2010 relative to 1985. For rice production (Fig. 5a), south and central and
317
east regions have consistently been the most carbon intensive areas due to high temperature and
318
greater level of organic matter application (Zhang et al. 2011a). In parallel, rice paddies in eastern,
319
southern and central China are found to have experienced the greatest SOC increase (Zhang et al. 2007;
320
Pan et al. 2010). In contrast, a lower level of crop residues, farm manure and green manure application
321
enabled the southwest to emit least GHG in producing same amount of rice.
322
As to the GHGI of wheat production (Fig. 5b), all regions except north China exhibited the same
323
trend as the national average. Consequently, reducing N rates should be advocated in northern
324
provinces, confirming the findings of other experimental and theoretical studies (Ju et al. 2009, 2011).
325
Maize GHGI evolution patterns (Fig. 5c) were more diverse between geographic regions, with
326
northeast China having the lowest GHGI . The northwest has been characterized with the highest
327
GHGI in both wheat and maize production.
328 0 200 400 600 800 1000 1985 1990 1995 2000 2005 2010 G H G I (k g C O2 e/ t) Year Rice Wheat Maize 20 25 30 35 40 0 2 4 6 8 1 9 8 5 1 9 8 7 1 9 8 9 1 9 9 1 1 9 9 3 1 9 9 5 1 9 9 7 1 9 9 9 2 0 0 1 2 0 0 3 2 0 0 5 2 0 0 7 2 0 0 9 S O C ( tC /h a ) Y ie ld ( t/ h a ) Year Rice Maize Wheat SOC
18 329 (a) 330 331 (b) (c) 332
Fig.5. Historic evolution of regional GHGI of rice (a), wheat (b) and maize(c) production 333
3.5. Ways to improve GHGI of cereal production while safeguarding food security
334
Over the past 50 years, food production growth in China has been primarily driven by increasing yield
335
per unit area rather than the expansion of cropping area. For example, from 1961 to 2010 there was an
336
8.5-fold increase in wheat productivity, with only a 30% increase in total cereal cropping area (FAO
337
2013). Ensuring food security in China in the future will still rely on yield improvement since rapid
338
industrialization and urbanization will continue to encroach on China's arable land (UNDP 2013). Fan
339
et al. (2012) argue that extension of existing technologies or better agricultural practices comprise the
340
most effective near-term strategy for achieving higher resource (fertilizers and water) use efficiency,
341
improving crop productivity and alleviating environmental impacts. In the longer term, continued
342 600 800 1000 1200 1985 1990 1995 2000 2005 2010 R ic e G H G I (k g C O 2 e/ t) Year SC E AVG. NE SW 100 200 300 400 1985 1990 1995 2000 2005 2010 W h ea t G H G I (k g C O 2 e/ t) Year N NW AVG. SC E 50 150 250 350 1985 1990 1995 2000 2005 2010 M ai ze G H G I (k g C O 2 e/ t) Year SW NW SC N AVG. E NE
19
genetic improvement through plant breeding will be crucial to ensure future food security.
343
Integrated soil-crop management systems and better nutrient management techniques are
344
advocated to address the key constraints to yield improvement (Fan et al. 2012; Zhang et al. 2012a).
345
Extensive overuse of synthetic N fertilizers is well documented in China (Chen et al. 2011; Cui et al.
346
2010), resulting in significant losses and serious environmental externalities (Guo et al. 2010). Zhang
347
et al. (2013) suggest a possible 42% nationwide cut of N fertilizer use applying the balance concept to
348
equalize N input and above ground N removal. In parallel to optimum quantity, application time, right
349
placement and appropriate product are also essential to better nutrient management. Postponing N
350
application to a later stage of crop growth and popularizing fertilizer deep placement by using
351
appropriate machines for top-dressing could improve crop N uptake and minimize losses compared
352
with conventional practices of applying large amount of N fertilizer on the surface before planting or
353
at the early stages (Cui et al. 2008; Zhang et al. 2011b). Replacing a proportion of ammonium-based
354
fertilizers with nitrate-based fertilizers in places where denitrification dominates N2O generation can
355
help minimize N2O emissions and ammonia losses (Zhang et al. 2013). NUE can also be improved by
356
applying fertilizers added with nitrification inhibitors (NI) and/or urease inhibitors (UI) and slow- and
357
controlled-released fertilizers. Global meta-analysis results (Akiyama et al. 2010) suggest that NIs
358
addition can lower N2O emission by 34% in upland fields and 30% in rice paddies on average,
359
compared with those of conventional fertilizers.
360
Better recycling of organic manures including animal excreta, crop residues and green manure
361
enables further improvement in NUE, SOC content and land productivity. Adopting conservation
362
tillage is found to be conducive to accumulate SOC density, improve water availability and reduce
363
water and wind erosion, especially on land of poor productivity (Xu et al. 2007; He et al. 2010). Such
364
practices shall be extended to wider areas supported by the MOA (2009). Finally, biochar addition can
365
be beneficial to soil quality and yield increase (Zhang et al. 2012b), therefore offering substantial
366
mitigation potential when it becomes economically available. As to CH4 emissions from rice paddies,
367
upgrading irrigation regimes from mid-season drainage (F-D-F), currently being practiced in most rice
368
cultivation regions, to intermittent irrigation (F-D-F-M) or controlled irrigation, could avoid as much
369
as 1.256 CO2e per hectare according to nationwide meta-analysis results (Wang et al. 2014).
370
3.6. Implication for mitigation potential from cereal production
20
Fig. 6 illustrates that total GHG emissions from rice, wheat and maize production have grown by 12%
372
from 2005 to 2010 caused by an 11% increase in cropping area and a 5% increase in average yield (Fig.
373
3b). In the S0 baseline scenario, although yields improve at the same rate of increase in N inputs,
374
resulting in constant GHGI, total GHG emissions will still go up because of higher production levels.
375
However, if no more N input is needed to enhance yields, emissions will stop increasing (scenario S1)
376
and GHGIs will decrease. In contrast, if better fertilization practices are promoted to suppress the
377
overuse of N fertilizers, total emissions will decline (scenario S2) by 8% compared to S0. Scenario S3
378
assumes substantial efforts are dedicated to minimizing the GHGI of cereal production by eradicating
379
N over-application, adopting better water management in rice paddies and improving yield levels. In
380
this case, IN2O of rice, wheat and maize shall decline by 2.5%, 3% and 3.4% respectively, and ICH4 by
381
1.5% annually. Under this scenario, total GHG emissions are estimated to be 224MtCO2e, a 17%
382
decrease relative to S0 enabled by an 18% decrease in N input, 0.5-1.5% improvement in yields and 1%
383
cut in average CH4 flux. Such a mitigation scenario is feasible since the 18% cut in N use falls under
384
the lower range of suggested 30-60% reduction (Ju et al. 2012; Zhang et al. 2013) and the 546 Mt
385
cereal production meets the target for ensuring national food security.
386
387
Fig.6. GHG emission scenarios from rice, wheat and maize production to 2020 in China 388
Apart from the emission reduction potential, SOC density is projected to continue to increase at a
389
rate of 0.4-0.48 tC/ha/yr in paddy soils and 0.16-0.22 tC/ha/yr in upland soils in the 2010s (Yu et al.
390
2013). This implies that even the C inputs (including manure and crop residue) to Chinese croplands
391
remain unchanged with no improvement in tillage practices, aggregate national SOC stocks will still
392
increase over the period 2010-2020. If improved agricultural management practices are widely adopted,
393 200 220 240 260 280 2 0 0 5 2 0 0 6 2 0 0 7 2 0 0 8 2 0 0 9 2 0 1 0 2 0 1 1 2 0 1 2 2 0 1 3 2 0 1 4 2 0 1 5 2 0 1 6 2 0 1 7 2 0 1 8 2 0 1 9 2 0 2 0 T o ta l em is si o n s (M t C O2 e) Year S0 S1 S2 S3
21
as much as 70MtCO2 could be sequestrated in the cropland soils. Carbon sequestration is therefore
394
able to compensate 31% of GHG emissions under scenarios S3.
22
4.
Conclusions
396
A low carbon development pathway implies minimization of emissions while increasing food
397
production and GHGI is an indicator combining both objectives. As such it is a central element of any
398
definition of sustainable intensification (Godfray and Garnett 2104). Our results on the GHGI of rice,
399
wheat and maize production show substantial heterogeneities among provinces/regions and indicate
400
considerable scope for improving carbon performance of cereal production. Under the BAU scenarios
401
where food production must grow to meet the demand of about 1.45 billion population, total GHG
402
emissions will continue to increase albeit with constant GHGIs. Controlling GHG emissions from
403
arable land thus requires additional mitigation efforts. Many abatement practices that improve crop
404
yields will not only enable emission reductions but also improve soil fertility via carbon sequestration,
405
therefore providing a triple win. Such findings can inform a broad range of policy, practitioner and
406
investment discussions on GHG mitigation strategies, and can also serve as benchmark values for
407
allocating quotas or as the baseline for generating carbon credits for any market-based mechanism.
408
Despite positive synergies with yield and soil fertility, abatement measures have not been widely
409
adopted by farmers due to economic, political and social factors. Required capacity and infrastructure
410
must be improved and agricultural extension service upgraded to lower GHGI and realize the
411
mitigation potential and land productivity and fertility improvement potential that agricultural
412 production offers. 413 414
Acknowledgements
415This study is supported by the project “Integration and demonstration of key carbon sequestration and
416
mitigation technologies in the agricultural ecosystems” funded by the Chinese Ministry of Science and
417
Technology (2013BAD11B03) and the Research Initiative “Agriculture, Food, Forestry and Climate
418
Change” of the Climate Economics Chair of Paris-Dauphine University.
23
References
420
Akiyama H, Yan XY, Yagi K (2010) Evaluation of effectiveness of enhanced-efficiency fertilizers as
421
mitigation options for N2O and NO emissions from agricultural soils: meta-analysis. Global
422
Change Biology 16:1837–1846
423
Bonesmo H, Skjelvåg AO, Janzen HH, Klakegg O, Tveito OE (2012) Greenhouse gas emission
424
intensities and economic efficiency in crop production: A systems analysis of 95 farms.
425
Agricultural Systems 110:142–151
426
Chen XP, Cui ZL, Vitousek PM et al (2011). Integrated soil-crop system management for food security.
427
Proc. Natl. Acad. Sci 108:6399-6404
428
Cui ZL, Zhang FS, Chen XP et al (2008) On-farm evaluation of an in-season nitrogen management
429
strategy based on soil Nmin test. Field Crop Res. 105:48–55
430
Cui ZL, Chen XP, Zhang FS (2010) Current nitrogen management status and measures to improve the
431
intensive wheat–maize system in China. Ambio 39:376–384
432
FAO (2013). FAOSTAT Database-Agriculture Production. http://faostat3.fao.org/home/, accessed June
433
2013
434
Gao LW, Ma L, Zhang WF et al (2009) Estimation of nutrient resource quantity of crop straw and its
435
utilization situation in China. Transactions of the Chinese Society of Agricultural Engineering
436
25:173-179
437
Gao B, Ju XT, Zhang Q, Christie P, Zhang FS (2011) New estimates of direct N2O emissions from
438
Chinese croplands from 1980 to 2007 using localized emission factors Biogeosciences Discussions
439
8:6971–7006
440
Godfray HCJ, Garnett T (2014) Food security and sustainable intensification. Phil Trans R Soc B.
441
doi:101098/rstb20120273
442
Guo JH, Liu XJ, Zhang Y et al (2010) Significant acidification in major Chinese. croplands Science
443
327:1008–1010
444
Han LJ, Yan QJ, Liu XY, Hu JY (2002) Straw Resources and Their Utilization in China Transactions of
445
the Chinese Society of Agricultural Engineering 18(3):87-91
446
He J, Li HW, Wang QJ et al (2010) The adoption of conservation tillage in China. Annals of the New
447
York Academy of Sciences 1195:E96–E106
448
Heffer P (2009) Assessment of fertilizer use by crop at the global level. International Fertilizer Industry
449 Association. 450 http://sustainablecropnutritionnet/ifacontent/download/7204/113684/version/8/file/AgCom0928+ 451 -+FUBC+assessment+at+the+global+level+(2006+%2B+2007)pdf 452
Huang Y, Sun W (2006) Changes in topsoil organic carbon of croplands in mainland China over the last
453
two decades. Chinese Science Bulletin 5:1785–1803
454
Huang Y, Tang Y (2010) An estimate of greenhouse gas (N2O and CO2) mitigation potential under
455
various scenarios of nitrogen use efficiency in Chinese croplands. Global Change Biology
456
16:2958–2970
24
Huang T, Gao B, Christie P, Ju XT (2013) Net global warming potential and greenhouse gas intensity in
458
a double-cropping cereal rotation as affected by nitrogen and straw management. Biogeosciences
459
10:897–7911
460
IPCC (2006) IPCC Guidelines for National Greenhouse Gas Inventories IPCC/IGES. Hayama, Japan
461
IPCC (2007a) Food, fibre and forest products in Climate Change 2007: Impacts, Adaptation and
462
Vulnerability, pp 273-313. Cambridge University Press, Cambridge, UK and New York, NY, USA
463
IPCC (2007b) Agriculture in: Climate Change 2007: Mitigation, pp 498–540. Cambridge University
464
Press, Cambridge, UK and New York, NY, USA
465
Ju XT, Xing GX, Chen XP et al (2009) Reducing environmental risk by improving N management in
466
intensive Chinese agricultural systems. Proc. Natl. Acad. Sci 106: 3041–3046
467
Ju XT, Christie P (2011) Calculation of theoretical nitrogen rate for simple nitrogen recommendations in
468
intensive cropping systems: A case study on the North China Plain. Field Crops Research 124:
469
450–458
470
Ma YC, Kong XW, Yang B et al (2013) Net global warming potential and greenhouse gas intensity of
471
annual rice-wheat rotations with integrated soil–crop system management. Agriculture,
472
Ecosystems & Environment 164: 209–219
473
Ministry of Agriculture (MOA) (1986-2013) China Rural Statistical Yearbook. China Agricultural Press,
474
Beijing
475
MOA (2001-2011) China Livestock Yearbook. China Agricultural Press, Beijing
476
MOA and Ministry of Finance (MOF) (2005) Notice on the issuance of “Interim management measures
477
of subsidy funds for fertilizer recommendation pilots”
478
Mosier AR, Halvorson AD, Reule CA, Liu XJ (2006) Net global warming potential and greenhouse gas
479
intensity in irrigated cropping systems in northeastern Colorado. J Environ Qual 35: 1584–1598
480
National Coordination Committee on Climate Change (NCCC) (2012) Second National Communication
481
on Climate Change of the PRC. China Planning Press, Beijing
482
National Development and Reform Commission (NDRC) of China (2009) National Plan for Expansion
483
of Grain Production Capacity by 50 million Mt during 2009-2020
484
NDRC (2006-2008) China Agricultural Products Cost-Benefit Yearbooks. China Statistics Press,
485
Beijing
486
Norse D (2012) Low carbon agriculture: Objectives and policy pathways. Environmental Development
487
1:25–39
488
Oenema O, Velthof G, Kuikman P (2001) Technical and policy aspects of strategies to decrease
489
greenhouse gas emissions from agriculture. Nutrient Cycling in Agroecosystems 60:301–315
490
Pan GX, Smith P, Pan W (2009) The role of soil organic matter in maintaining the productivity and yield
491
stability of cereals in China. Agriculture, Ecosystems & Environment 129: 344– 348
492
Pan GX, Xu X, Smith P, Pan W, Lal R (2010) An increase in topsoil SOC stock of China's croplands
493
between 1985 and 2006 revealed by soil monitoring. Agriculture, Ecosystems & Environment
494
136:133–138
25
Shang Q, Yang X, Gao C, Wu P et al (2011) Net annual global warming potential and greenhouse gas
496
intensity in Chinese double rice-cropping systems: a 3-year field measurement in long-term
497
fertilizer experiments. Global Change Biology 17: 2196–2210
498
Smith P, Martino D, Cai Z et al (2008) Greenhouse gas mitigation in agriculture. PHILOS T ROY SOC
499
B 363:789–813
500
State Administration of Grain (SAG) of the PRC (2013) Production prediction of major grain crops in
501
2013. http://wwwgrainnewscomcn/xw/news/gn/2013/10/15_197288html
502
Sun W, Huang Y, Zhang W, Yu Y (2010) Carbon sequestration and its potential in agricultural soils of
503
China. Global Biogeoche mical Cycles 24(3):GB3001
504
Sun WJ, Huang Y (2012) Synthetic fertilizer management for China’s cereal crops has reduced N2O
505
emissions since the early 2000s. Environmental Pollution 160: 24–27
506
Tubiello FN, Salvatore M, Rossi S, Ferrara A (2012) Analysis of global emissions, carbon intensity and
507
efficiency of food production. EAI research papers 4-5
508
Tubiello FN, Salvatore M, Cóndor Golec RD et al (2014) Agriculture, Forestry and Other Land Use
509
Emissions by Sources and Removals by Sinks, 1990-2011 Analysis. FAO Working Paper Series
510
ESS/14- 02
511
UNDP (2013) China Human Development Report 2013: Sustainable and Liveable Cities: Toward
512
Ecological Urbanisation. China Publishing Group Corporation, Beijing
513
Van Groenigen JW, Velthof GL, Oenema O et al (2010) Towards an agronomic assessment of N2O
514
emissions: a case study for arable crops. European Journal of Soil Science 6:903-913
515
Venterea RT, Maharjan B, Dolan MS (2011) Fertilizer source and tillage effects on yield-scaled nitrous
516
oxide emissions in a corn cropping system. Journal of Environment Quality 40:1521-1531
517
Wang W, Koslowski F, Nayak DR et al (2014) Greenhouse gas mitigation in Chinese agriculture:
518
distinguishing technical and economic potentials. Global Environmental Change. doi:1
519
0.1016/j.gloenvcha.2014.03.008
520
World Bank (2013) World Bank Data http://dataworldbankorg/. Accessed June 2013
521
Wreford AD, Moran D, Adger N (2010) Climate Change and Agriculture: Impacts, Adaptation and
522
Mitigation. OECD Publishing
523
Xu Y, Chen W, Shen Q (2007) Soil Organic Carbon and Nitrogen Pools Impacted by Long-Term Tillage
524
and Fertilization Practices. Communications in Soil Science and Plant Analysis 38:347–357
525
Yan XY, Cai ZC, Wang SW, Smith P (2011) Direct measurement of soil organic carbon content change
526
in the croplands of China. Global Change Biology 17:1487–1496
527
Yu YQ, Huang Y, Zhang W (2012) Modeling soil organic carbon change in croplands of China,
528
1980–2009. Global and Planetary Change 82–83:115–128
529
Yu YQ, Huang Y, Zhang W (2013) Projected changes in soil organic carbon stocks of China’s croplands
530
under different agricultural managements, 2011–2050. Agriculture, Ecosystems & Environment
531
178:109–120
26
Zhang W, Yu YQ, Sun WJ, Huang Y (2007) Simulation of Soil Organic Carbon Dynamics in Chinese
533
Rice Paddies from 1980 to 2000. Pedosphere 17:1–10
534
Zhang W, Yu Y, Huang Y, Li T, Wang P (2011a) Modeling methane emissions from irrigated rice
535
cultivation in China from 1960 to 2050. Global Change Biology 17:3511–3523
536
Zhang FS, Cui ZL, Fan MS et al (2011b) Integrated soil-crop system management: Reducing
537
environmental risk while increasing crop productivity and improving nutrient use efficiency in
538
China. J Environ Qual 40:1-7
539
Zhang FS, Cui ZL, Chen XP et al (2012a) Integrated Nutrient Management for Food Security and
540
Environmental Quality in China. In: Sparks, DL (ed) Advances in Agronomy 116, pp 1–40
541
Zhang AF, Liu Y, Pan GX et al (2012b) Effect of biochar amendment on maize yield and greenhouse gas
542
emissions from a soil organic carbon poor calcareous loamy soil from Central China Plain. Plant
543
and Soil 35:263–275
544
Zhang WF, Dou ZX, He P, et al (2013) New technologies reduce greenhouse gas emissions from
545
nitrogenous fertilizer in China. Proc. Natl. Acad. Sci 110:8375–8380
546
Zheng XH, Fu CB, Xu XK et al (2002) The Asian nitrogen cycle case study. AMBIO 31:79–87
Les Cahiers de la Chaire Economie du Climat
n° 2014-09
Working Paper Series
Contact us :
Chaire Economie du Climat - Palais Brongniart (4e étage)
28 Place de la Bourse, 75 002 Paris Tel : +33 (0)1 73 01 93 31
Email : contact@chaireeconomieduclimat.org
La Chaire Economie du Climat est une initiative de CDC Climat et de l’Université Paris-Dauphine
Working Papers Publication Director: Pierre-André Jouvet
Les opinions exposées ici n’engagent que les auteurs. Ceux-ci assument la responsabilité de toute erreur ou omission
n° 2014-02 Carbon prices and CCS investment: comparative study between the
European Union and China By Marie Renner
n° 2014-03 Social Acceptance and Optimal Pollution: CCS or Tax?
By Pierre-André Jouvet and Marie Renner
n° 2014-04 Interactions between CO2 and RES targets: A cost assessment of European
Energy Climate Policies with POLES model
By Florent Le Strat, Elaine Pelourdeau, Benoît Peluchon, Jean-Yves Caneill, Yasmine Arsalane, and Kimon Keramidas
n° 2014-05 The "Second Dividend" and the Demographic Structure
By Frédéric Gonand and Pierre-André Jouvet
Towards a clean vehicle fleet: from households’ valuation of fuel efficiency to policy implications
By Bénédicte Meurisse and Maxime Le Roy
n° 2014-06
Energy transition toward renewables and metal depletion: an approach through the EROI concept
By Florian Fizaine and Victor Court
n° 2014-07
Fostering Renewables and Recycling a Carbon Tax: Joint Aggregate and Intergenerational Redistributive Effects
By Frédéric Gonand
n° 2014-08
Greenhouse gas intensity of three main crops and implications for low-carbon agriculture in China
Wen Wang, Yuebin Lin, Liping Guo, Yingchun Li, Man Su, Christian de Perthuis, Xiaotang Ju, Erda Lin, Dominic Moran