HAL Id: halshs-01064506
https://halshs.archives-ouvertes.fr/halshs-01064506v2
Preprint submitted on 6 Nov 2014HAL is a multi-disciplinary open access archive for the deposit and dissemination of sci-entific research documents, whether they are pub-lished or not. The documents may come from teaching and research institutions in France or abroad, or from public or private research centers.
L’archive ouverte pluridisciplinaire HAL, est destinée au dépôt et à la diffusion de documents scientifiques de niveau recherche, publiés ou non, émanant des établissements d’enseignement et de recherche français ou étrangers, des laboratoires publics ou privés.
Benefit in the wake of disaster: Long-run effects of
earthquakes on welfare in rural Indonesia
Jérémie Gignoux, Marta Menéndez
To cite this version:
Jérémie Gignoux, Marta Menéndez. Benefit in the wake of disaster: Long-run effects of earthquakes on welfare in rural Indonesia. 2014. �halshs-01064506v2�
WORKING PAPER N° 2014
– 27
Benefit in the wake of disaster:
Long-run effects of earthquakes on welfare in rural Indonesia
Jérémie Gignoux
Marta Menendez
JEL Codes: I30, L26, O10, Q54
Keywords: Natural disasters, Earthquakes, Rural Indonesia, Long-term effects, Welfare, Aid and reconstruction
P
ARIS-JOURDANS
CIENCESE
CONOMIQUES48, BD JOURDAN – E.N.S. – 75014 PARIS
TÉL. : 33(0) 1 43 13 63 00 – FAX : 33 (0) 1 43 13 63 10
www.pse.ens.fr
CENTRE NATIONAL DE LA RECHERCHE SCIENTIFIQUE – ECOLE DES HAUTES ETUDES EN SCIENCES SOCIALES
Benefit in the wake of disaster:
Long-run effects of earthquakes on welfare in rural Indonesia
Jérémie Gignoux and Marta Menéndez
1ABSTRACT
We examine the long-term effects on individual economic outcomes of a set of earthquakes – numerous, large, but mostly not extreme – that occurred in rural Indonesia since 1985. Using longitudinal individual-level data from large-scale household surveys, together with precise measures of local ground tremors obtained from a US Geological Survey database, we identify the effects of earthquakes, exploiting the quasi-random spatial and temporal nature of their distribution. Affected individuals experience short-term economic losses but recover in the medium-run (after two to five years), and even exhibit income and welfare gains in the long term (six to 12 years). The stocks of productive assets, notably in farms, get reconstituted and public infrastructures are reconstructed with some improvements, seemingly partly through external aid, allowing productivity to recover. These findings tend to discount the presence of poverty traps, and exhibit the potential long-term benefits from post-disaster interventions in context where disasters primarily affect physical assets.
Keywords: natural disasters; natural disasters; earthquakes; rural Indonesia; long-term effects;
welfare; aid and reconstruction.
JEL codes: I30, L26, O10, Q54.
1 Jérémie Gignoux (corresponding author): Paris School of Economis - INRA, 48 boulevard Jourdan 75014, Paris, France, email: gignoux@pse.ens.fr. Marta Menendez: Université Paris-Dauphine, LEDa, Paris, France and IRD, UMR 225-DIAL, Paris, France, email:
1. INTRODUCTION
Every year natural disasters, such as earthquakes, droughts or fires can affect a large number of rural households in Indonesia – households that constitute the majority of the poor population there, as in many developing countries. These disasters often seriously damage or even destroy the productive capital of farmers, including their crops, livestock, buildings and machinery. They can also force a liquidation of those assets if the households need to reconstruct or repair their homes, and furthermore can affect collective assets such as irrigation systems. The subsequent decrease in the stock of productive assets likely generates a negative shock on productivity that adds up to the losses of in-household non-business assets and welfare derived thence. Natural disasters also destroy public infrastructure assets such as transportation networks, disrupt supply chains, and eventually prevent farmers from accessing inputs or selling their products in remote markets or make it more costly for them to do so. Although the physical capital of agricultural businesses is particularly exposed to disaster destruction since it is essentially tangible and anchored to location, non-farm businesses can also suffer from similar negative productivity shocks and higher transaction costs.
The main losses of many disasters are hence in terms of physical assets. Yet the long-term effects on individual welfare of those disaster-related physical destructions remain poorly understood. Indeed, more attention has been devoted to the smaller number of extreme disasters that affect the stock of human capital by taking large death toll, causing injuries, or preventing households to invest in human capital. In the case of earthquakes, far more attention has been devoted to few catastrophic ones than to the large number of lesser, though still damaging earthquakes occurring every year in a number of countries. However the long-term consequences of disasters that mostly affect physical assets might be quite different from the ones of disasters that affect human capital. While individuals who suffered injuries or were prevented from attending school are likely to persistently remain with lower economic outcomes and welfare, this is less obvious for individuals that suffered from losses in physical assets. Indeed, while the immediate destruction and associated welfare losses of natural disasters have been documented to some extent, the long-run economic consequences for affected households might not always be negative.
On the one hand, initial asset losses may push households into poverty traps that can persist in the long run. In a similar way to those at a macro (country or region) level (Azariadis and Drazen 1990), poverty traps occur at the level of the household when returns to assets are locally increasing, so that a decrease in the stock of assets below a certain threshold traps households in a low-productivity equilibrium. Such convexities in returns can stem from larger transaction costs for
smaller producers, or from the available technologies (Carter and Barrett 2006), and incomplete financial markets will reinforce their effects.2 On the other hand, if no such locally increasing asset returns are observed, and particularly if well-functioning financial markets exist, the stocks of both household-owned and public infrastructure capital could be reconstituted, and productivity restored. This recovery could be further eased if afflicted areas benefit from external transfers for aid and reconstruction, for instance if affected households receive government payouts for rebuilding their houses – or farm (or non-farm) business-holders for reinvesting – or if infrastructures in the afflicted area get reconstructed or improved using redistribution funds. In such cases, the net impacts of natural disasters in the long run depend on the extent of external aid. In addition, it has been argued that disasters can act as “catalysts for reinvestment and upgrading of capital” (see Hallegatte and Dumas 2008, and also Albala-Bertrand 1993, and Skidmore and Toya 2002), that is, the destruction and forced renewal of capital could in some cases hasten the adoption of new and more productive technologies. Examples of such an upgrading could be the reconstruction of houses and farm buildings with reinforced structures and better quality masonry, the installation of more efficient irrigation systems, or the restoration of public infrastructures making them better adapted to current needs. Some production processes could also get organized more efficiently. Other possibly important effects of natural disasters on productivity could occur when households respond to the shock by developing new activities, reallocating their labor supply or migrating away, notably to urban areas.
Hence, it is not clear to what extent the immediate negative productivity shocks and associated welfare losses persist over time, or whether affected households recover, or end up benefiting from some post-disaster reconstitution of stocks of assets. Understanding the long-run economic consequences of large but not extreme natural disasters, and the losses in assets they entail, is key, then, to understand whether and how post-disaster policies that governments and development agencies put in place can help limit long-term asset depletion, in addition to
households’ initial income and welfare losses that follow those disasters. Those policies might
notably differ from the ones implemented after more extreme disasters by emphasizing more the support of local businesses and infrastructure reconstruction. In settings of less acute humanitarian needs, they could try to emphasize the adoption of new technologies and production processes at levels of both individual businesses and communities, and have long-term benefits in terms of rural development. Studies focusing on the effects of natural disasters at the country or regional levels (Albala-Bertrand 1993; Skidmore and Toya 2002 and 2007; Kahn 2005; Loayza et al. 2009; Noy
2 Human capital losses or disinvestments can also contribute to poverty traps development (see e.g. Alderman, Hoddinott and Kinsey 2006).
2009; Strobl 2012) have generally examined the largest disasters and provided some evidence that their negative short-run effects depend on the level of development and structure of the economy and are more pronounced in developing countries that rely more on rural and agricultural sectors. For those disasters, the long-term macro effects are already debated. Some studies (e.g., Skidmore and Toya 2002) report evidence of recovery in terms of economic growth, while others (e.g., Noy 2009) find a negative correlation between disaster shocks and the long-run economic growth rate, supporting the opposite conclusion. Related studies have found that extremely destructive civil conflicts did not have persistent effects in the very long run (see Miguel and Roland 2011 on the long-run region-level effects, after more than 30 years, of war and bombing in Vietnam).
Whether households (rather than areas) are able to recover is a different question. The micro evidence on the long-run consequences of natural disasters is still very thin. Some recent studies provided evidence on how large disasters that generate substantial losses in human capital (through deaths and health consequences), such as droughts (e.g., Maccini and Yang 2009), famines (e.g., Chen and Zhou 2007), civil conflicts (e.g., Leon 2012, and, for a survey, Blattman and Miguel 2010), did have lasting effects. However, the evidence is essentially lacking in terms of long-run consequences of natural disasters that mainly affected the stock of physical capital and household welfare.
In this paper we address this knowledge gap and examine the long-run economic consequences of earthquakes for households in rural Indonesia. We ask the following questions: first, what are the short-run losses in assets, income and welfare experienced by individuals hit by an earthquake? Second, are smallholders trapped into poverty traps, or do they manage to reconstitute their capital stock and recover to their pre-disaster levels productivity and welfare? And third, to what extent do aid and reconstruction policies, in addition to individual coping mechanisms
– mainly self-insurance – contribute to economic recovery?
The focus on Indonesia is not without reason. The world’s fourth most populous country, Indonesia is located at the intersection of several tectonic plates and as a result, has to contend with some of the most frequent and powerful seismic activity in the world. Large sections of the country are exposed to seismic tremors: dozens of large earthquakes have occurred in recent decades. Furthermore, those disasters remain rare and unpredictable to a given location, and this makes it very costly and difficult for households to adopt ex-ante risk-reduction strategies to mitigate the effects. Attention has been focused, justifiably, on the death tolls of the biggest ones (such as the more than 5700 killed in the Yogyakarta earthquake of May 26, 2006 which also caused damages estimated at 3.1 billion USD) and the destruction they entail in terms of housing, yet moderate and large earthquakes can generate substantial losses in both individually owned and public assets.
In addition, high-quality data is available for examining the long-run effects of those disasters. Indonesia notably benefits from a large-scale household panel survey, collected between 1993 and 2007, the Indonesian Family Life Survey (IFLS). This panel is known to have uncommonly low attrition rates, which is key for examining the long-run impacts of natural disasters: they make it possible to document both the short- and long-term consequences of earthquakes while minimizing the selection biases stemming notably from migrations. Then, geophysical data at subdistrict level were available in the Indonesian survey, allowing us to match households to our second source of data, the Centennial Earthquake catalog (Engdahl and Villaseñor 2002) a seismic data source for large seismic events. Thus we can compute the intensity of earthquakes experienced by individuals (and their potential losses) in the panel, based on the place where they were living when the disaster occurred. Given that the occurrence of earthquakes can be viewed as random when restricting to exposed regions, this setting permits us to analyze these events as a set of repeated social experiments.
We estimate the effects of earthquake occurrence, at different points in time up to 12 years after the event, on a set of economic outcomes of rural households, including their welfare measured by consumption, the assets they own in their businesses, the income they derive from farm businesses, agricultural wage work and other non-farm activities. We use standard panel models for outcomes measured at the individual level, such as income. However, while the welfare and assets outcomes are measured at the household level, measures of the experience of an earthquake are at the individual level, and the composition of households changes across rounds. Hence, we use an adapted panel fixed-effects model for those most outcomes (notably assets and expenditure) which are measured at the household level. In addition, we examine the role of recovery mechanisms notably by investigating the receipt of aid transfers and changes in the quality of local infrastructures.
Our results indicate that rural households who experienced a large earthquake in Indonesia, after going through short-term welfare losses, were able to recover in the medium run and, rather surprisingly, even exhibit welfare gains in the long run. The stock of productive assets of farms is reconstituted and even increased in the medium run, and the positive long-run effects stem from increases in the incomes of independent farmers. Improvements in supply chains and the renewal of the productive assets of farm businesses are apparently driving those. Indeed, households do receive substantial assistance transfers which, together with self-insurance (cashing in of savings and sales of non-business assets), allow them to reconstitute their stock of productive capital in the medium run. In addition, we find evidence that infrastructures, notably rural roads and electrification, improve compared to the pre-disaster state. Aid receipt and infrastructure improvements seem to
benefit farm businesses by providing incentives to smallholders to reconstitute and increase their productive capital. This confirms the key role of infrastructures for agricultural and rural development, consistently with recent studies documenting the gains in agricultural productivity from infrastructures through the expansion of both the inputs and outputs markets (Gollin and Rogerson 2014; Adamopoulos 2011; Khandker et al. 2009; Jacoby 2000). Our findings thus tend to reject the hypothesis that the asset losses due to natural disasters in Indonesia spur poverty traps by locking households in low productivity levels, and instead confirm the alternative hypothesis that natural disasters can spur growth in the long run. Farm businesses in particular appear very resilient to those large shocks as their holders manage to reconstitute their productive capital, and benefit in the long run from reconstructed local infrastructures. Because Indonesia is a large and intermediate-income country with a capacity to mobilize and channel-in aid and reconstruction resources, observed long-term economic consequences of natural disasters in this context are probably more favorable than they would be in a small country with limited financial resources, and thus should be
viewed as a “better case” scenario.
The paper is organized as follows. The next section presents the context and discusses the mechanisms likely to drive the long-term effects of earthquakes. Section 3 presents the data and Section 4 the empirical strategy. Section 5 presents and discusses the results. Section 6 concludes.
2. SEISMIC RISK AND LONG-TERM CONSEQUENCES OF EARTHQUAKES IN RURAL INDONESIA
2.1. Seismic risk in Indonesia
Indonesia is one of the most seismically active regions in the world. The tectonics of the southwestern region of the country are dominated by the subduction of the Indo-Australian plate (moving to northeast at about 6 cm per year) beneath the Sunda plate. The Sunda megathrust (the interface between the two plates) extends offshore from the southeast of all Java and Sumatra and the Sumatran fault extends 30–60km inland along the mountainous backbone of the island. The eastern region, including Kalimatan and Sulawesi islands, also lies at the juncture of the southeast part of Sunda plate, crushed between the westward-moving Philippine plate and the northward-moving Indo-Australian plate.3 Hence large earthquakes regularly occur in great swathes of the country. The areas most vulnerable to earthquakes include virtually all Sumatra, Java, the Lesser Sunda Islands (Bali, Nusa Tenggara), Maluku, Sulawesi, and Papua, though seismic activity is also
reported in parts of Kalimatan (see Figure A1 in the Appendix).
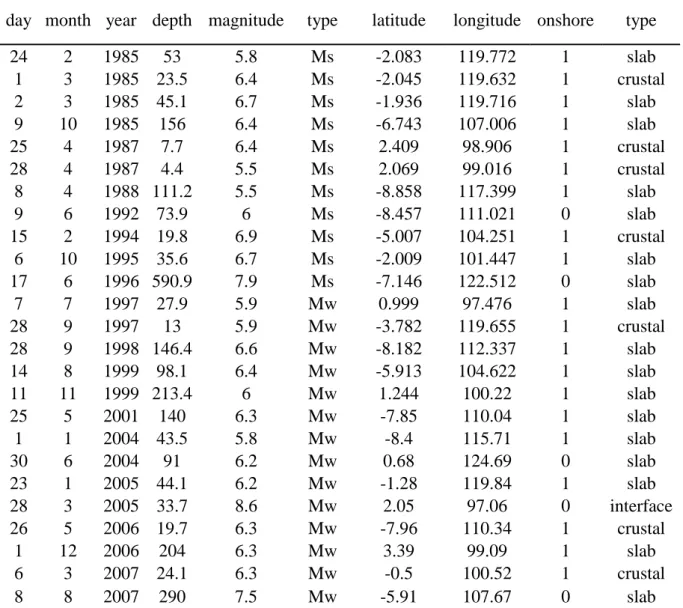
Our source of information on individual outcomes, the Indonesian Family Life Survey (IFLS), was initially launched in 13 of the 27 provinces of the country, located mostly in Java and Sumatra, but also in South Kalimatan and West and South Sulawesi. Although the IFLS dataset is intended to be representative of the Indonesian population, sampling methods by province imply that not all large earthquakes that recently occurred in Indonesia are captured in the data, since, for example, the province of Aceh, which suffered one of the most devastating tremors and tsunamis of the country in 2004 is not included in the sample. Nevertheless a significant number of potentially damaging seismic events have occurred in the region and period of the IFLS panel survey. Using the calculations described in the next section, we are able to classify observed earthquakes felt in IFLS subdistricts by levels of local ground motion intensity according to the Modified Mercalli Intensity (MMI) scale, which is widely used by seismologists (see Appendix Table A1 for a description of the MMI scale and associated potential damages). There were respectively 105, 48, 25, 15, and 6 earthquakes that caused ground motions of intensity levels higher than V, VI, VII, VIII, and IX. As expected, moderate-intensity earthquakes are more common than highly devastating ones. Table 1 presents a subset of the list of earthquakes (and the information reported in the Centennial catalog) felt in IFLS subdistricts, those which caused ground motions of intensity VII or more. The earthquakes that implied the most violent ground motions experienced by our IFLS sample occurred on October 9, 1985 (magnitude M6.4), September 28, 1998 (M6.6), May 25, 2001 (M6.3), May 26, 2006 (M6.3 – this is the Yogyakarta and Central Java earthquake), December 1, 2006 (M6.3), and March 6, 2007 (M6.3).4
<Table 1 around here>
2.2. Long-run consequences of earthquakes in rural Indonesia: poverty traps or creative destruction?
Earthquakes negatively affect the stocks of both private and public productive assets and hence the productivity of businesses and the welfare of households in the short run. Among the studies that confirm the negative short-term effects of earthquakes on the welfare of households, see, for
4 Magnitudes are global measures of the size of earthquakes and are measured in terms of energy released by earthquakes in the Centennial catalog. Note that the Centennial catalog may report larger magnitude earthquakes – for instance on March 28, 2005 (M8.6), September 12, 2009 (M8.5), that translate into less intense ground shakings
example, Baez et al. (2010); Halliday (2006); Yang (2008).5 However, the long-term effects of
natural disasters on the stocks of productive assets (including business capital and public infrastructures), as well as on the income and welfare of rural households are less clear, since different mechanisms may be at play.
To begin with, asset losses may push households into poverty traps that persist over the long period. Such poverty traps occur when returns to assets are locally increasing. There are a few reasons why locally increasing returns can be present in rural areas of developing countries (Carter and Barrett 2006). First, the production technology may exhibit such increasing returns to scale or there might be several available technologies, but switching to the most productive ones requires some minimum scale. This can occur for instance in agriculture when higher-return crops or more productive agronomic practices are available but become profitable only when implemented on a sufficiently large scale because of the costs of some inputs (for land preparation, etc.). Second, the convexities might stem from variations in the prices of inputs and outputs due to transaction costs diminishing with the scale of the business. This is particularly likely to occur on the market for agricultural products when market power of smallholders is low, due to a combination of poor infrastructure, physical isolation and non-competitive markets. Besides, variations in risk aversion of business holders with the stock of assets they own can also generate locally increasing returns.
Producers exhibiting locally increasing returns in their production process (for any of the above reasons) can be pushed into a low-productivity equilibrium and trapped after a natural disaster that generates a drop in the stock of assets below a certain threshold. The intuition is that they need to make a substantial reinvestment in order to reconstitute their stock of assets at a sufficiently high level in order to re-establish their productivity. However the financial markets that could allow them to finance those reinvestments might be incomplete or missing – these financial markets are moreover likely to be stressed by the correlate disaster shock. In those cases, to recover their pre-disaster levels of productivity, producers would have to go through a long and painful strategy of autarchic accumulation during which they trade off current consumption for reinvestments in productive assets. But the current costs of reducing consumption (or not repairing non-productive assets such as housing) might be too high, and prevent them from doing so.
5 Note that the distribution of welfare losses in the short run is influenced by the changes occurring on rural labor markets. In this sense, using rainfall data, Jayachandran (2006) observes that when workers are poor, don't have access to credit, and their migrations are constrained, agricultural wages are likely to be volatile after a negative shock and go down all the more as households increase their labor supply. On the other hand, landowners buying labor will be able to buy labor at a cheaper price. Thus households are likely to be affected in different ways depending on whether they demand or supply labor on market. However, more mortiferous natural disasters, such as earthquakes, have the potential to reduce the labor supply and may have opposite effects. See Belasen and Polachek (2008, 2009) for related studies on the effects of hurricanes in Florida on local labor markets.
Similarly, it might be difficult for communities and local administrations to mobilize sufficient financial resources to fund the reconstruction of the local infrastructures supporting local markets. And the deterioration of these local infrastructures can increase even more the transaction costs and the nonlinearities in returns.
The poverty traps discussed above are particularly likely to occur in areas that do not receive, or receive only insufficient, post-disaster aid, for instance when a relatively poor and small country is affected by a large earthquake. However, in large countries with aid and reconstruction capacity, even if self-insurance mechanisms could be incomplete, aid receipt and reconstruction efforts can allow stocks of capital, of both individual businesses and of public infrastructures, to be reconstituted.
This is likely to occur in Indonesia – at least since the early 2000s, because since that time the country has been developing and implementing new disaster management policies that include aid to afflicted households through cash or in-kind transfers and grants for business recovery/reinvestment. In the presence of locally increasing returns to scale (i.e. risks of poverty traps), and to the extent it is used to reinvest in farms, this aid may allow producers reconstitute their stock of productive capital enough to allow an escape from poverty traps. It could even generate gains in productivity compared to before the shock if producers were financially constrained before the shock and aid allows them to improve their capital stock overall.
In addition, the destruction and forced renewal of capital could in some cases fasten the adoption of new and more productive technologies (see Hallegatte et al. 2008 for a theoretical analysis of technical change after disasters). The idea here is that some productive assets that required fixed-cost investments, and were hence costly before the disaster, get renewed using more productive technologies after the disaster. Some instances could be found in agriculture with the machinery and buildings of intensive farms or plantations of cash crops (such as rubber, palm or cocoa trees). This could also apply to manufacturing firms. Some constraints might restrain this technology-enhancing renewal of capital, though, such as the need to renew assets quickly after the disaster or the lower costs of continuing with the same older technologies.
Besides, in countries with financial capacity and well-designed interventions, infrastructures are also likely to be reconstructed, and this should benefit local producers and, more generally,
households living in affected areas. Indonesia’s disaster management policies have notably
emphasized reconstruction, at least recently. Consistently, in its community module, the 2007 round of the IFLS survey provides specific information on infrastructure reconstruction after natural disasters (this information is not available for previous waves of the survey). It provides evidence that communities suffer infrastructure damage in natural disasters, but tend to reconstruct and enjoy
better infrastructures afterwards. Of the 67 percent of communities suffering a natural disaster that declare damages to their infrastructures, 80 percent declare that repairs have been made, and that infrastructures are now as good as or better off than before.Hence, reconstruction could bring net improvements in infrastructures, which should reduce one of the sources of increasing returns described above and overall improve the productivity of businesses compared to the pre-disaster situation.
Overall, the forced renewal of capital stock imposed by earthquakes, together with post-disaster aid and reconstruction have the potential to bring long-run improvements in the productivity and access to markets of local producers, which then likely increase the income and welfare of individuals in afflicted areas.
3. DATA
We use data from two different sources: the first is an exhaustive dataset of all large seismologic events that occurred in Indonesia during the last decades; the second is the household-level data collected by the Indonesian Family Life Surveys (IFLS) between 1993 and 2007.
3.1. Earthquakes data
The data on earthquakes is from the Centennial Earthquake Catalog (Engdahl and Villaseñor 2002). It is a compilation of records of large earthquakes, obtained from seismographic instruments located around the world, made available by the U.S. Geological Survey. It has been assembled by combining existing catalogs and harmonizing the magnitude and location measures. For the period 1965–present, the Centennial catalog records earthquakes with a magnitude higher than 5.5 and is complete up to that threshold. The Catalogue registers, for each seismic event, the date and exact time, epicenter location, focal depth, magnitude (measure and scale), as well as details on the source catalog, recording technique and instruments. From the Catalogue, we selected all earthquakes that occurred since 1985 in the region surrounding Indonesia (geographic latitudes between -12 and +12 degrees and longitudes between 80 and 150 degrees); there are 1,111 such earthquakes.
We exploit this data to obtain objective measures of the strength of ground motion that was locally felt by the individuals we observe in the IFLS panel, and the subsequent amount of damage they were likely to suffer. A common geological measure of local hazard that earthquakes cause is peak ground acceleration (PGA), or the maximum acceleration that is experienced by a physical body such as a building on the ground during the course of the earthquake motion. PGA is considered as a good measure of hazard to short buildings, up to about seven floors.
Though local measures of the ground motions induced by earthquakes are available only for selected locations where stand seismographic stations, the mapping of the felt ground shaking and potential damage can be imputed from the characteristics of earthquakes and the local geography. Seismologists and structural engineers have developed models, called attenuation relations, for predicting the local intensity of ground shaking caused by a given earthquake; these models serve notably for mapping seismic hazards. Attenuation relations are obtained by specifying a functional form, e.g. with PGA being a log-linear function of distance to the source fault among other terms, and estimating the parameters using data for past earthquakes. Specific attenuation relations have been proposed for estimating ground motions for different regions, types of earthquakes, and distance ranges. The specific attenuation relation applied in this paper was derived by Zhao et al. (2006) using data from earthquakes in Japan, chosen because it allows predicting ground motion for a variety of earthquake types, including subduction, crustal onshore, or deep intraplate earthquakes. It was also designed to predict ground motion at close-in distances, where damage is likely to be more significant. We give its formula in Section A1 in the Appendix.
The attenuation relation allows estimating the local PGAs induced by any earthquake in our selected dataset and for any subdistrict surveyed by the IFLS; subdistricts typically are small areas, rarely larger than 20 kilometers of diameter, and we take one set of geographic coordinates for each of those. Source distance is easily obtained from the latitudes and longitudes of the subdistrict
(“kecamatan”) and earthquake hypocenter locations. For each earthquake, we thus recover a
mapping of the induced ground shaking felt in the IFLS subdistricts, with a measure of PGA for each subdistrict.
PGA measures can then be approximately converted to potential damages using a conversion rule (see Wald et al. 1999) that translates PGA values on earthquake intensity levels on the Modified Mercalli Intensity (MMI) scale. This scale was constructed from individuals’ reports of damages and perceived shaking, and describes perceived ground tremors and potential structural damages. It has twelve intensity levels, and the upper eight correspond to local ground motions with PGAs large enough to cause damage (see Table A1 in the Appendix). Damages start with earthquakes of intensity level V (PGAs between 3.9 and 9.2 % g), though these go from very light to light damages, depending on the structural design of buildings; earthquakes of intensity level VI (PGAs between 9.2 and 18 % g) can cause light to moderate damage; level VII (PGAs between 18 and 34 % g) moderate to moderate/heavy damage, and so on until earthquake intensity level XII which would correspond to total destruction. For each subdistrict in the IFLS panel surveys, we thus recover the PGAs that were experienced each year and the corresponding number in the MMI scale.
3.2. Household panel data
The household-level data we use is from the four waves of the Indonesia Family Life Survey (IFLS), a large-scale longitudinal household survey. The first wave was conducted in 1993 (IFLS1), and follow-ups took place in 1997 (IFLS2), 2000 (IFLS3), and 2007 (IFLS4). A total of 7,224 households were interviewed in IFLS1, representing about 83 percent of the Indonesian population living in 13 of the nation’s 26 provinces. Subsequent waves attempted to re-interview these households and households to which previous household members had moved. The total number of households interviewed, including the split-off households, was 7,698 in IFLS2, 10,435 in IFLS3 and 13,535 (with 43,649 individuals) in IFLS4. Because substantial effort was done to track the movers, attrition rates in IFLS surveys is remarkably low. Overall, 87.6 percent of households that participated in IFLS1 were interviewed in each of the subsequent three waves. Not all individuals within households were interviewed in 1993 (in particular, not all children were included). However, from 1997 onwards, individuals aged 26 and more in 1993 and all their children were tracked, and in 2000 and 2007 tracking was complete for all members of 1993 households.
The household-level outcomes considered in this paper include measures of: real monthly per capita household consumption (total, food and non-food); farm-business assets (including: land and plants, house and other buildings, movable, and financial assets); non-farm business assets (same categories); monthly labor incomes and hourly wages (we distinguish wage and self-employment and workers in agriculture and in other sectors); monthly social assistance transfers (total, subsidized food, and other transfers). For most variables, we use indicator variables for non-zero value (participation), and also the observed value; all those values are provided in real terms using deflators that incorporate inflation and spatial variations in prices.
In addition, we also monitor some community-level outcomes, using data from a community module (elicited from among local leaders and through observation) of the IFLS surveys. In rural areas, communities correspond to villages. We use information from this module on local infrastructures, in particular the availability and quality of roads (whether the local main roads are asphalted and by the transportation time to the nearest market), electrification (the share of households in the community with access to the electricity network). We also use information on local prices of agricultural products that was gathered through a survey of consumer prices on the local markets.
In order to measure individual exposure to earthquakes, we recover the migration histories, at the subdistrict level, for all individuals in our survey, since 1985. The information on migration was obtained from two different sources in the survey: the tracking modules with information on
migration modules with information on residence at birth, at age 12, and all moves after age 12 (with dates and place). IFLS respondents provide information on their places of residence since birth in the first 1993 round or in subsequent rounds, in case they enter the panel, and since the previous round at which they were observed in case they are re-interviewed; we extract all past subdistricts of residence.
3.3. Merged dataset
The last step is to merge the earthquake subdistrict-level information with the migration histories of individuals in the IFLS panel. For each individual, we recover his history of exposure to ground tremors using the information from the specific subdistricts where the individual was living each year (migration histories are therefore taken into account) and the occurrence of ground tremors in those specific subdistricts and those years. Note that we compiled longitudes and latitudes for subdistricts that appear in any of the four waves of the household surveys. If an individual migrated to any other place, the associated geo-data and exposure to ground shakings for those areas could not be calculated; the share of such individuals remains very limited, though.
Table 2 gives the number of individuals in our survey that were touched by these potentially damaging earthquakes. There is no single year without at least some individuals affected by earthquakes of intensity V or more. The years with higher earthquake intensities and incidence, in terms of individuals affected, correspond are 1985, 1998, 2001, 2006 and 2007, when more than 4,000 individuals in our sample were touched.
<Table 2 around here>
We restrict to a rural sample of individuals that lived in rural areas at their first observation in the panel (they can move afterwards to some urban areas). We then restrict to provinces in which at least 100 people in the sample undergo an intensity VI or more ground tremor between 1985 and 2007, and to individuals aged 25–54. The analysis is based on an unbalanced sample of individuals comprising 14,773 observations: 2,844 in 1993, 3,101 in 1997, 3,953 in 2000, and 4,875 in 2007 (see Table 3 for some descriptive statistics by year). For the analysis of labor outcomes, we restrict the sample to males and exclude the data from the 1993 survey (because of a high measurement error on the information on income and wage).
4. EMPIRICAL STRATEGY
4.1. Identification
Our identification strategy exploits the quasi-random spatial and temporal variations of earthquakes. Earthquakes can occur at any point in time in large portions of the Indonesian territory, so that all people living in entire districts and provinces are exposed to that risk. Moreover, when occurring, earthquakes generate ground tremors that extend over long distances, from tens to hundreds of kilometers for those of highest magnitudes, so that all inhabitants of large areas will experience the ground tremor. People can try and diminish the potential damages in case of occurrence by living in more secure houses or in principle in less risky geographic areas, for instance avoiding hills and softer soils, or living or spending time in more solid constructions, but all will go through experiencing the disaster, the effect of which we are interested in here (in an intent-to-treat approach). Hence, this does not generate a selection into our treatment, which is defined at the larger subdistrict level.
To identify the short and long-run welfare effects of earthquakes in Indonesia, we rely on a difference-in-difference strategy and in addition exploit the panel dimension of our data. More specifically, we restrict to provinces where earthquakes have occurred since 1993 and compare the changes in outcomes of individuals who experienced a ground tremor of a given intensity to the ones of individuals that did not experience such a ground tremor. We then control for all the individual heterogeneity determining the outcomes by incorporating an individual fixed effect component. We thus identify the effects of the earthquakes by using the cross-periods and within-individual variations in earthquake experience and outcomes.
4.2. Econometric model for outcomes measured at the level of individuals
The basic econometric model we use for estimating the effects of earthquakes on individual outcomes, such as labor outcomes, is the fixed-effects panel model:
(1)
where is the outcome of individual of household at date , are individual fixed effects, period fixed effects, a measure of the experience of an earthquake before date , time-varying observable characteristics (such as age), and time-varying residuals. The fixed individual component nets out the time-invariant effects of the unobservable individual characteristics. The parameter of interest, , is for the average treatment effects of past exposure on the outcome . The standard errors are robust to the heteroskedasticity and serial correlation of the
residuals at the individual level.
The assumption we rely upon for identifying is one of unconfoundedness. It requires that is independent of and (but not necessarily of ). This will hold in our setting if ground tremors occur in an individual’s life at dates that are unpredictable and thus uncorrelated with other time-varying determinants of the outcomes of interest. In practice, there is little room for individuals to reduce at specific times the risk that they undergo a ground tremor, unless they migrate far away to another province (for instance on the northern coasts of Sumatra and Java – although the risk remains high there too). In addition, we restrict the sample to individuals in provinces in which ground tremors of intensity VI or more occur between 1993 and 2007 (and affect at least 100 individuals in the sample).
Now, although we cannot test it, the validity of the unconfoundedness assumption can be assessed. A first such assessment is given in Table A2 in the Appendix, in which we compare the characteristics, observed in 1993 (the first round of our data), of the communities which were affected by at least one ground tremor of intensity of level VI (or VII) or more between 1993 and 2007, with the ones of unaffected communities. The characteristics of the population (average household size, gender, age and education of head, and the shares of employed and agricultural workers) as well as the ones of community (the predominant type of road, access to electricity, and distances to the nearest market, and district and province capitals) of the two sets of communities are very close – there is no statistically significant difference in any of the variables – which tends to confirm that ground tremors occur randomly over space. A second assessment of the unconfoundedness assumption can be based on a placebo test of the effect of a pseudo-treatment, namely the exposure to a ground tremor in the future. In Table A3 in the Appendix, we report the estimates of the effects of ground tremors occurring one to three years after individuals are observed, on labor incomes and wages in the first columns. For those tests, we restrict to the data for 1993, 1997 and 2000. We find no statistically significant relationship between future exposure and current outcomes, i.e. affected individuals do not have outcomes that deviate from their average over time just before exposure, which tends to confirm that our estimates are robust to time-varying heterogeneity in outcomes.
We use the model above to estimate the effects of the experience of an earthquake on labor market outcomes. The household-level treatment variables indicate whether the individual experienced an earthquake of intensity above a given level (VI or VII) during the current or previous year (capturing a short-run effect of earthquake incidence), two to five years before the year survey (capturing a medium-run effect), and six to 12 years before the survey year (capturing a long-run effect). We also control for several observable characteristics of individuals (their gender,
age, and education) for improving the precision of the estimates.
4.3. Econometric model for outcomes measured at the level of households
Now, for outcomes that are measured at the household level, we need to accommodate the fixed-effects model above to account for the facts that the experience of an earthquake is measured at the individual level and that the composition of households changes from one round of the panel to another. Abstracting for the moment from the longitudinal dimension (and from controls for observables ), the underlying individual-level model, which would be estimated if welfare outcomes were measured at the individual level, is:
(2)
where is now the welfare outcome of individual in household , again individual fixed effects, a measure of his past exposure to ground tremors, and a residual. The concern is that only an average ̅ of the welfare outcomes at the household level is observed – e.g. the consumption expenditures aggregate is at the household level – so that one would need to estimate the averaged model:
̅ ̅ ̅ (3)
Where are household fixed effects and ̅ a household-level measure exposure to ground tremors (treatment). Using an individual-level treatment indeed leads to a misspecification bias, as can be seen by replacing individual-level by household-level welfare in Equation (2):
̅ ( ̅ ) (4)
where ( ̅ ) . One would need to control for the deviations of individual outcomes to the household level averages ̅ ; given that these deviations are unobserved and potentially correlated with treatment (e.g. if the earthquake affected more the outcomes of exposed individuals than the household average outcomes), the residual would not be independent from
and the estimate of would be biased in this specification.
Thus, in a cross-sectional setting, only the household-level averaged model (3) provides consistent estimates of the effects of earthquakes experience. But in a longitudinal setting, individuals can exit from households and join others, so that household-level fixed effects are not relevant, and one needs to incorporate individual fixed effects in a household-level averaged model. This transformed household-level model is obtained by taking the average of the individual-level panel model in (1). Accounting for the fact that individuals can belong to different households at different dates, we get:
̅ ∑
̅ ̅ (5)
where denotes the set of individuals who belong to household at date . Because of these changes in household composition, the individual fixed effects need to be weighted by the shares of each individual among of the number of household members (i.e. one divided by household size).
Now, many household members, e.g. many couples, will remain together at all rounds of the panel. For those household members that are always observed together, individual fixed effects cannot be identified and can be replaced by fixed effects for the groupings of associated members. The weights will then consist of the shares of the number of household members represented by the individuals in the grouping at each date. The model we estimate thus writes:
̅ ∑
̅ ̅ (6)
where are fixed effects for the groups of individuals remaining together at all rounds of the data, ( denotes the set of groups of individuals (observed together) who belong to household at date ). In this model, treatment is defined at the household level and indicates whether any household member experienced an earthquake during a given of time preceding the date observation (e.g. in the past two years).
This model can be estimated as long as the number of fixed effects and other independent variables is smaller than the number of observations. With four rounds of data and a number of individuals remaining together across the different waves, this constraint is satisfied in our data.6
We use this model to estimate the effects of the experience of an earthquake first on per capita consumption expenditures (on food, non-food items, and the total of the two), the ownership and value of non-business, farm and non-farm business assets, and the receipt of social assistance transfers. The controls for observables include the gender, age, and education of the household head.
We also assess the validity of the unconfoundedness assumption using this model of household-level outcomes. The last columns of Table A3 in the Appendix report the estimates of the effects of ground tremors occurring one to three years after individuals are observed, on per capita log expenditures (total, food and non-food). Again, these estimates show no statistically significant correlation between the future exposure to the tremors and current outcomes, thus
6 The estimation of the model is still computationally intensive as several thousands of fixed effects must
confirming unconfoundedness stemming from the randomness of earthquakes: there is no evidence of any trend in individual outcomes before individuals are affected by the tremors.
5. RESULTS
5.1. Welfare and labor income
Table 4 reports the estimated effects of earthquakes of intensity levels VI or higher (Panel A) and VII or higher (Panel B), respectively, on total per capita consumption, and food and non-food consumption separately. The estimates are obtained using the model in equation (6). In the interest of simplicity and with an eye on space constraints, throughout the paper we only present our three coefficients of interest for the short-run, medium-run and long-run earthquake effects, but full regression results are available upon request. Two facts stand out in these regression results. First, our estimates show a clear negative effect of experiencing an earthquake in the short run (years t to t-1) on household per capita consumption, and, second, this negative effect fades away and eventually turns out to be positive and statistically significant in the long run. The negative short-run coefficient is relatively large and statistically significant (at 5 percent), with mean drops in total consumption and non-food consumption, of 10 percent and 14 percent respectively, when we look at level VI or higher earthquakes. For higher intensity earthquakes (VII or more), significance levels drop to about 15 percent, essentially due to the smaller sample incidence of larger earthquakes in our IFLS data (see descriptive statistics). After two to five years have passed, the initial short-run negative effects on consumption decline in size and lose significance at any intensity level considered. Eventually, after enough time has elapsed (in our specification, six to 12 years after the event), the estimated effects of earthquakes on household per capita expenditure turn positive, no matter the intensity threshold used, with increases of about 10 percent in both total and food consumption and 8 percent in non-food consumption, and the estimated effects remain of similar size and statistically significant for total and food consumption when considering less-frequent VII or higher earthquakes.
<Tables 4 and 4bis around here>
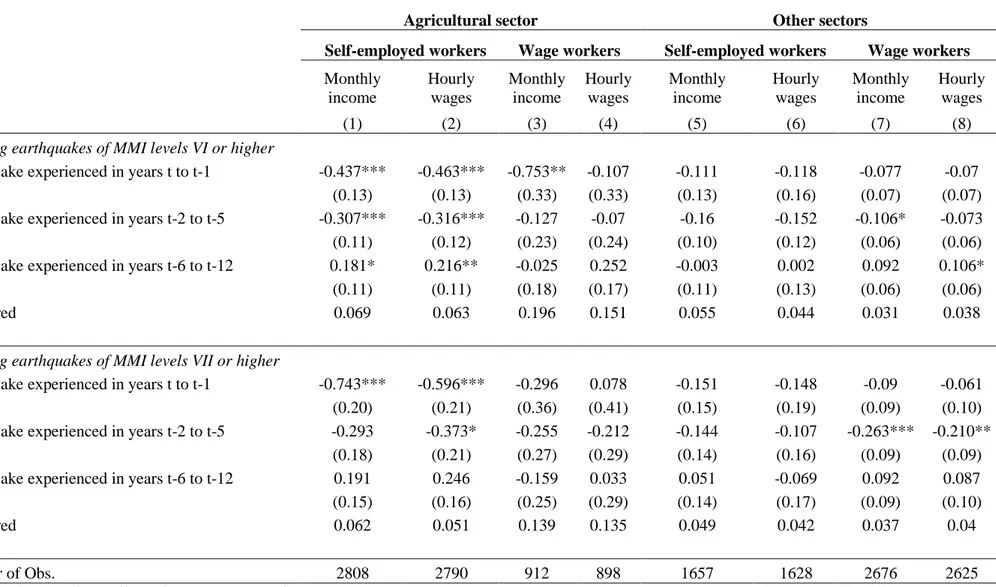
In Table 5, we report the estimated effect of earthquakes of intensity VI or higher (Panel A) and VII or higher (Panel B) on main job monthly incomes and hourly earnings and wages. The estimates are obtained using the model in equation (1). Columns 1 to 4 correspond to workers in
the agricultural sector, and columns 5 to 8 to workers in all other sectors. Results are presented separately for self-employed and wage workers. Similarly to what we found with household per capita consumption, all short- and medium-run effects of earthquakes on workers’ monthly incomes and hourly wages are negative, though results are statistically significant almost exclusively in the agricultural sector (for which the estimated effects have a size at least double that of those estimated for the other sectors). In particular, the monthly incomes of agricultural self-employed workers who underwent an intensity VI or higher ground tremor decrease in the short and medium runs by 44 percent and 31 percent respectively, but increase in the long run by 18 percent. The incomes of agricultural wage workers decrease by 75 percent in the short run before recovering (though this estimate is rather imprecise). Point estimates of similar magnitudes are obtained for individuals who underwent intensity VII or higher ground tremors, but the long-term gains are no longer statistically significant. The estimated effects on hourly earnings are very similar for agricultural self-employed workers, but the short-term decrease in agricultural hourly wages is less, indicating a decrease in agricultural wage employment.7
These results suggest various facts. First, in rural areas, shortly after an earthquake takes place, all economic sectors suffer, but the agricultural sector more than the rest. Second, in the latter agricultural sector, both self-employment and wage work are severely reduced in the years following the disaster. When lower intensity earthquakes (VI and up) are included in the analysis, wage workers experience larger negative shocks than the self-employed in the agricultural sector, in line with the findings by Jayachandran (2006), but when only larger earthquakes (VII and up) are considered, the largest losses in the short run seem to be supported by the agricultural self-employed, probably due to the higher losses in business assets. Third, significant positive long-term effects are only observed among the agricultural self-employed, and eventually among wage workers in other sectors (the latter are statistically significant for VI or higher earthquakes). These findings provide evidence of economic recovery and gains in productivity in the long run, in particular in farm businesses but eventually also in other economic sectors.
<Table 5 and 5 bis around here>
In sum, our results on income and consumption not only provide evidence of the immediate post-disaster household welfare losses that earthquakes cause, but also show that individuals are
7
We also estimated the effects of earthquakes on hours of work in the different economic sectors. These estimates
(available upon request) show a small short-term increase in hours worked for wage in the agricultural sector, but otherwise no statistically significant change in the quantity of labor allocated to the agricultural sector in the long-run. They also indicate an increase in the quantity of labor allocated to non-farm self-employment.
able to recover and even improve their welfare significantly in the long run. On average, no evidence of welfare poverty traps caused by earthquakes stems from our data on rural Indonesia.
5.2. Owned assets
In order to delve into the different mechanisms at play that help explain how rural households cope and recover from the initially negative shocks, we estimate the effect of earthquakes on both owned assets, and more particularly productive assets of farm businesses, and the receipt of public aid (both at the individual and community levels).
Table 6 (Panel A for VI or higher intensity levels and Panel B for VII or higher) reports estimates, obtained using the model in equation (6), of the effects of earthquakes on disaggregated farm business assets, that is: land and plants, house or buildings, and movable assets (these including livestock, vehicles, tractors, equipment and tools). Household financial assets (savings/deposits/stocks, whether from farm or non-farm origins) are also considered. To minimize sample selection issues, we present the log of monthly values (columns 1 to 4), as well as asset ownership (columns 5 to 8). Our results show significant negative short-run effects on house/building ownership and values, indicating substantial short-run losses for farm businesses. For instance, the ownership of a house or buildings declines by about 8 percent shortly after an intensity VI or higher earthquake. Although not statistically significant, the estimated coefficients are large and negative for the effects on the stock of financial assets, suggesting that households use those in a self-insurance coping strategy. The point estimates are also negative but statistically insignificant for the values of owned land/plants and movable assets. Now, there are significant positive medium-run effects on ownership and value of movable assets (positive point estimates also on land/plants and house/buildings but not statistically significant), suggesting that the stocks of productive assets get reconstituted in the medium run We also observe positive but not statistically significant long-run effects on all types of farm business assets after individuals have experienced an intensity VI or higher earthquake. However, the long-run effects of larger earthquakes (Panel B) on houses or buildings of farm businesses remain negative 12 years after the event. Although household consumption and income levels eventually recover, the reconstruction of farm buildings probably takes more time than do reinvestments in other farm business assets.
<Table 6 and 6 bis around here>
The gains in welfare could in principle stem from individuals who migrated away from the places where they suffered the earthquakes. We examine the effects of the experience of earthquakes on
migration, using the individual panel model in equation (1). The estimates are presented in Table A5 in the Appendix, using three measures of migrations based on whether the individual resides at least 20km (column 1) or 50km (column 2) away from the place he was residing at in the previous round, and migration to a urban area since the previous round. The experience of an earthquake seems to reduce the probability of migrating in the short run and increase slightly the probability of a long-distance migration in the long run, although those long-term migrations do not have cities as their main destination. Overall, those effects are limited and earthquakes do not seem to spur large flows of migrations away from affected areas.
5.4. Aid and reconstruction
While some self-insurance behaviors seem to be at play, those are unlikely to explain the long-term positive effects on household income and consumption on rural Indonesia. Many rural Indonesian households live in poverty, and it is difficult to imagine that the population would not be financially constrained after an earthquake, unless external aid for reconstruction is provided, either from foreign donors or through redistribution policies. In order to probe the role of aid and reconstruction, Table 7 (again, Panel A for earthquakes of intensity VI or higher and panel B for ones of intensity VII or higher) gives the estimates of the effects on the receipt of aid at the individual level (columns 1 to 3), and on aid received at the community (subdistrict) level (columns 4 to 6) through infrastructure development. The estimates in columns 1-3 are obtained using the model in equation (6), and the ones in columns 4-6 are obtained using the one in equation (1) applied to the sample of rural communities observed first in the 1993 round of the IFLS.
Households with individuals who experienced earthquakes tend to receive more social assistance transfers in the short and medium runs (columns 1 to 3), mostly in the form of subsidized food. The receipt of any transfers or food subsidies is respectively 12 and 20 percent points higher in the short run and medium run after an I6+ earthquake, and the estimated effects are slightly higher at about 29 percent points in the medium run (and of similar magnitude but statistically insignificant in the short-run) after an I7+ earthquake. In the long run, affected households no longer seem to be the target recipients of social assistance programs, which provides additional evidence of the welfare improvements down the line.
Turning to community-level reconstruction of infrastructure (columns 3 to 6), the initial direct negative impact of earthquakes is best captured by our variable measuring the share of households using electricity in the community. The effects on time used to reach the nearest market or road type – while negative as expected in the short run with respectively about 4 and 6 percent less households with light depending after I6+ and I7+ earthquakes – become positive and
statistically significant in the long run with respectively 4 and 9 percent more households with light, confirming that some reconstruction and improvement in infrastructures is taking place. Similarly, while the effects we estimate on the road infrastructures are negative but statistically insignificant, communities which experienced an earthquake benefit from better road infrastructures in the long run, which reflects in a 7 to 10 percent (respectively, for I6+ and I7+ earthquakes) higher prevalence of asphalt or paved road, and 17 to 22 percent shorter time to reach the nearest market.
<Table 7 and 7bis around here>
We interpret these results as evidence that post-disaster reconstruction and redistributive policies have had positive effects, contributing to the recovery and even leading to net improvements in the long-term economic outcomes of affected households. It is important to stress here that our setting is one of numerous large but not completely devastating earthquakes, which mostly destroy a share of the physical capital, and notably the productive assets of businesses, and that this setting differs from the one of very large disasters leading to substantial losses in human capital. While attention has been focused on emergency aid and reconstruction after very large disasters, aid and reconstruction interventions that focus on disasters of more moderate size, which are also more frequent, may also be important for rural economic development. For such events, efficient interventions could allow households and communities recover from their short-term losses and,
through a “creative destruction” mechanism, trigger some investments that determine future
economic prospects.
6. CONCLUSION
Using longitudinal household surveys and objective geological measures, we have examined the effects of large earthquakes on the income and welfare of individuals in rural Indonesia. The quasi-random spatial and temporal distribution of the disasters, together with the panel dimension of the data, allows us to identify, with a difference-in-difference strategy, the effects over different periods of time. With the exception of the biggest earthquakes, which also threaten human capital (through injuries) and lives, most of those disasters mainly entail losses of individual and business assets, and negatively affect productivity and welfare in the short term, particularly in the agricultural sector.
Our results indicate that individuals who experienced a large earthquake in Indonesia, after going through short-term losses, were able to recover in the medium run, and even exhibit income and welfare gains in the long run. More specifically, in the first two years after a strong ground tremor, individuals experience an average decrease in per capital total expenditure of about 10 percent points; however, six to 12 years after the shock, their expenditure is 10 percent higher than before. These welfare gains apparently stem from similar income short-term losses (of more than 40 percent for males self-employed in agriculture) and long-term gains (of about 20 percent for the same population) in incomes, and we consistently observe that the stock of productive assets, notably in farm businesses, is reconstituted in the long run.
Two mechanisms seem likely to drive those outcomes. First, business holders, notably farmers, manage to reconstitute their stock of productive assets, and maybe improve it compared to before the shock. This is done to some extent through self-insurance: we observe some short- and medium-run decreases in the stocks of non-business assets, including financial assets. But households also receive some external aid in the form of social assistance transfers, notably subsidized food, and probably also for the most recent disasters, transfers for reconstituting their productive capital (although we lack detailed information on this).
Second, there is evidence that public infrastructures in affected areas, notably roads and the electricity network, get reconstructed and even improved compared to their pre-disaster state. These investments in public infrastructures likely benefit farms and other businesses by reducing transactions costs, notably for marketing the outputs and accessing inputs.
While disasters may trigger some migrations away from the afflicted areas, possibly to urban areas, we do not observe large population flows out of affected areas. Nor do we observe substantial reallocations of labor across sectors.
These findings provide evidence of a certain resilience to natural disaster asset losses that is apparently driven by reinvestments in productive assets at both the individual and aggregate levels. Those reinvestments prevent most affected individuals from entering potential poverty traps. This result is in line with the finding of Miguel and Rolland (2011) of the absence of poverty traps at the level of regions or large geographic areas following war destructions in Vietnam.
Furthermore, the positive long-term effects we document seem to reveal some “creative
destruction” effects of natural disasters, so that, by forcing the renewal of productive assets,
exogenous destructions might accelerate technological progress. We document such a process by showing gains in terms of investments occurring at both the individual and public levels, particularly in farm businesses.
investments in productive assets. While more attention has been devoted to post-disaster intervention in the context of extreme events that caused large losses in human capital, this finding suggests that those external aid packages may have positive impacts and contribute to development in contexts where disasters primarily affect the productive capital.
A more in-depth examination of the cost-efficiency of aid and reconstruction interventions would require accounting for the costs of interventions and the extent of inter-regional fiscal redistribution. It would be of value to both the literature and policy to isolate the effects external aid and fiscal redistribution from other regions of the country, and disentangle these from the effects of investments that would be performed without such aid. Such an analysis is not feasible with our data, but future research could accomplish it by using impact evaluation methods on post-disaster aid programs.