COST Action 620
Vulnerability and Risk Mapping
for the Protection of Carbonate (Karst) Aquifers
Final Report
Summary
The biggest issue to face European Hydrogeologists over the last decade has been the need to protect the quality and quantity of groundwater resources. The European Water Framework Directive published on 23rd October 2000 reinforces the efforts that have been made, requir-ing member states to develop and implement plans to maintain and improve the aquatic envi-ronment. This directive puts into context the work of the COST Action 620, which began in 1996 and has lasted 5 years.
Our Action, entitled “Vulnerability and Risk Mapping for the Protection of Carbonate (Karst) Aquifers” was tasked with the development of an improved and consistent European approach for the protection of karst groundwater. The Action saw the production of new tools to assist in the management of karst areas and their water resources. One of the main criteria for these tools was to ensure that their transparency and ease of use, whilst primarily for expert, still reflected the needs of practical hydrogeologists. As a result, the participants of the Action worked hard to establish common approaches for delineating vulnerability in the field. The identification of the most vulnerable recharge areas where protection measures must be at their greatest is critical, whilst greater flexibility in land use planning can be considered in those less vulnerable areas.
Action 620 brought together experts from several disciplines including; hydrogeology, karst geomorphology, environmental chemistry and microbiology, all having specialist knowledge of varying aspects of karst aquifers. These specialists brought together their expertise to ho-listically consider the specific behaviour of these aquifers and their particular sensitivity to anthropogenic impacts. The fact that karst groundwaters are extensively used for drinking water supply in most countries with Europe is remarkable. The importance of these vulner-able karst groundwater resources for potvulner-able supply emphasised the importance of the work undertaken by the Action, so as to protect its quality for future generations.
The concept of groundwater vulnerability can be approached in many ways and the ground-water community’s approach to it could be considered to be in a state of constant flux. As a result it was important to consider precise definitions in order to reach a level of agreement across the participating countries. Particular areas of debate included; the usefulness of in-trinsic and specific vulnerability as concepts and the need to consider the risk of particular contaminant scenarios. The work undertaken by the Action was both interesting and difficult, not least due to the regulations and practises carried out in the 15 participating countries and the varying points of view of the numerous experts.
By proposing new transparent procedures based on detailed knowledge of karst groundwater behaviour we believe we have made a significant contribution to the groundwater protection ‘tool box’, opening new perspectives for future development on this important topic.
Our results are presented in this final report, which is subdivided in two parts. Part A presents the new approaches that were commonly developed by the Working Groups of COST Action 620. Part A consists of 7 chapters: Introduction, Groundwater Vulnerability, Intrinsic Vul-nerability, Specific VulVul-nerability, Hazard Mapping, Risk Assessment, and Data Collection and Validation. Part B presents Methods and Applications that were worked out by the vari-ous research teams that contributed to our Action.
The European Approach to vulnerability, hazard and risk mapping is based on an origin-pathway-target model, which applies for both groundwater resource and source protection. Origin is the term used to describe the location of a potential contaminant release. The target is the water, which has to be protected. For resource protection the target is the groundwater
rything between the origin and the target. For resource protection, the pathway consists of the mostly vertical passage within the protective cover, for source protection it also includes hori-zontal flow in the aquifer.
A major task of the COST Action was to develop a general, non-prescriptive approach to In-trinsic Vulnerability Mapping, which could be adapted into methods appropriate for use in-dividual karst areas of Europe. European karsts include alpine and lowland, Mediterranean and continental and management of karst groundwater also varies from country to country. Hence, flexibility had to be an essential attribute of the approach.
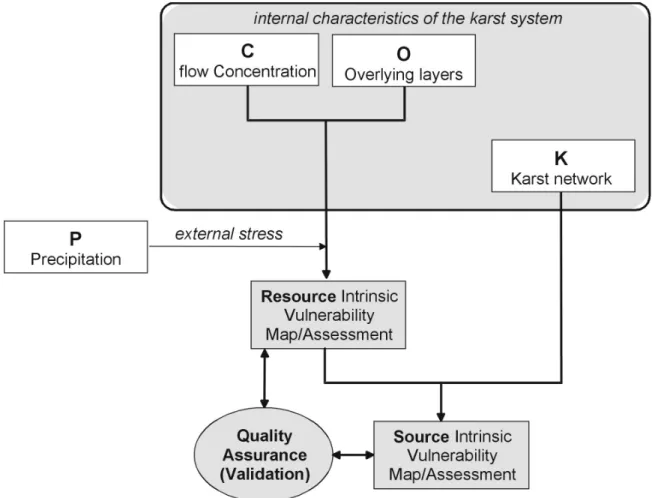
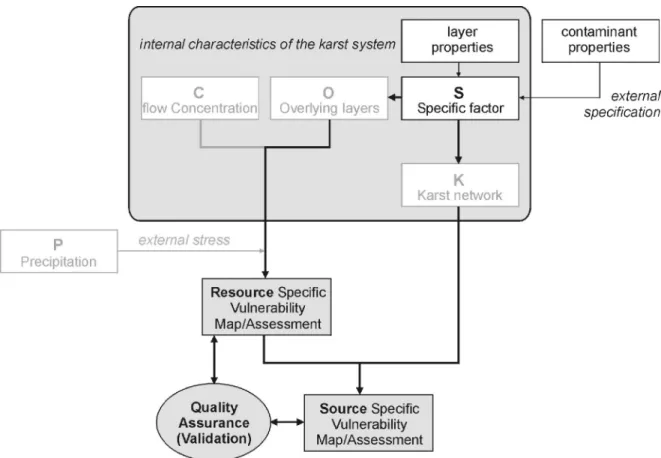
The European Approach uses four factors in assessing intrinsic vulnerability: Overlying lay-ers (O), Concentration of flow (C), Precipitation regime (P) and Karst network development (K). The factors O, C and K represent the internal characteristics of the system, while the P factor is an external stress applied to the system. The O factor may comprise up to four layers – soil, subsoil, non-karst rock and unsaturated karst rock. The C factor recognizes that in karst areas the overlying protective layers may be bypassed by runoff, which is concentrated at or near the surface of the ground and which then enters the groundwater system via a doline or a stream sink. For resource vulnerability mapping, where the target is the top of the saturated zone, the factors O, C and P should be taken into consideration, while, in addition, the K fac-tor should be taken into account for source vulnerability mapping where the target is a karst water supply such as a borehole or a spring.
The European Approach does not specify how the component factors should be measured or categorized or how vulnerability ratings should be established and thus it is not a methodol-ogy. However, the approach has been applied, using locally developed methodologies, at a variety of test sites in seven of the participating countries (see part B).
A final aim in developing the European Approach was that the approach, though karst sensi-tive, should not be completely karst centred to the extent that it could not be used in other groundwater environments. This aim has been realised to the extent that the P and O factors have universal applicability in assessing vulnerability, whilst the C and K factors relate to the particular characteristics of karst aquifer systems.
The intrinsic groundwater vulnerability assessment accounts only for the hydrogeological characteristics of the system but is, by definition, independent of the properties of specific contaminants. However, each contaminant or group of contaminants behaves differently in the different layers. These contaminants, due to their own physical and chemical properties, can be retarded or degraded during their underground transit.
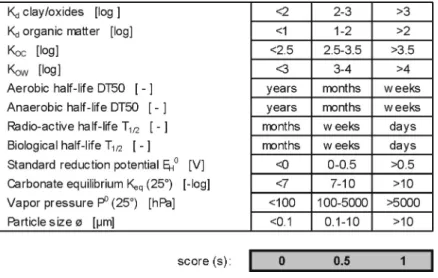
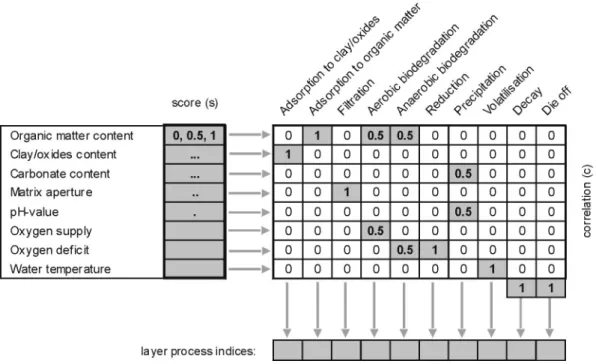
Thus, COST Action 620 also proposes an approach to Specific Vulnerability Mapping, which combines two types of information:
• Information about the physical and chemical behaviour of contaminants (or groups of con-taminants). These parameters have been obtained from the scientific literature. They are different for each contaminant, but common for all field applications.
• Information about physical and chemical properties of layers. Those are different for each layer and due to different layer combinations and particular properties (tectonics, karstifi-cation etc.) for each monitoring point of the assessed area.
The proposed approach has been conceived as an additional weighting based on the intrinsic assessment. This means that it has to be used in addition to intrinsic assessment.
Using the properties of the contaminants and those of the layers, the principle of the method is to determine the effectiveness of processes that can play a role in the attenuation (retardation and degradation) of the contaminant. It means that a process, likely to act on the concentration
of the contaminant, can become effective if the conditions are met in a given layer. So, the processes that are occurring through the different layers will tend, in almost all the cases, to increase retardation and degradation of the contaminant.
Once the effectiveness of the process has been determined in a layer, the intensity of the proc-ess accounts the hydraulic conductivity, the thicknproc-ess, which all together represent the transit time of water, and the rate of diffuse flow of the layers. Of course, water flowing in the con-ductive drains is only slightly submitted to the attenuation processes, due to its generally in-sufficient residence time in the layer. The rate of diffuse flow includes the part of water, which is flowing in the fine fissures and in the porous matrix, outside the main drains of the system. Mostly water transiting through the low permeable areas (diffuse flow) undergoes such processes.
Assessing the potential degree of harmfulness of Hazards to groundwater is the object of a logical, 7-step work plan which starts from a definition and inventory of hazards and leads to the eventual production of hazard maps. Throughout the elaboration of the work plan, Cost 620 recognized the essential requirement that hazard maps must be simple if they are to serve as efficient tools in planning and decision-making processes.
In the context of groundwater contamination, a hazard is defined as a potential source of con-tamination resulting from human activities taking place mainly at the land surface. Conse-quently, the hazard inventory starts from a differentiation between three main types of land use: infrastructure, agricultural and industrial activities. The main aim of the proposed hazard inventory is to cover all the various hazards that are considered relevant to groundwater and to allow, through a reasonable subdivision, the mapping, evaluation and assessment of the hazards in an economically feasible and practical manner.
Easy-to-use software, developed as a specific activity within Cost 620 and which can feed di-rectly into common GIS systems, facilitates the collection of data on hazards. A mathemati-cal algorithm is proposed for the mathemati-calculation of the potential degree of harmfulness for each hazard. The algorithm considers weighting values to enable a direct comparison between the different type of hazards, a ranking procedure for hazards of the same type as well as a scheme to assess the likelihood of a contaminant release. According to the resulting Hazard Index, five Hazard Index Classes are defined and assigned a suitable colour for presentation on a map. To further assist the map layout, appropriate symbols and signatures (point, line or polygon) for each type of hazards are given according to their spatial properties.
Although discussed in more detail in Chapter 7, the work plan also incorporates the use of mapping techniques, including GIS and remote sensing, as well as the requirements of proper data evaluation for the purpose of hazard mapping. Finally, some further observations are presented, especially with regard to the scale effect of the hazard maps produced for the test sites.
The protection of our natural groundwater resources requires a sustainable groundwater man-agement, which should be based on a comprehensive Risk analysis. With regard to a possible damage of groundwater the term “risk” is used for the likelihood of a specific adverse conse-quence. Following the origin-pathway-target model risk depends on three elements: (1) the hazards and their probability that a hazardous event occurs, (2) the vulnerability of the geo-logical sequence and (3) the consequences for the groundwater. In a logic system risk assess-ment is split in two parts: step 1, “risk estimation”, is analysing the potential intensity of the relevant impact reaching the groundwater and therefore deals with point (1) and (2). Step 2, the “risk evaluation”, focuses on the adverse consequences. These depend on the groundwater sensibility, like flow condition, and on the ecological and economical value of the damages.
In order to separate clearly the different parts of risk assessment and to quantify their impor-tance a “risk intensity index (RII)”, a “risk sensitivity index (RSI)” and a “total risk index (TRI)” were introduced.
In past groundwater studies, including the recent work of COST 620, risk assessment is deal-ing mainly with the risk estimation only. For land use planndeal-ing or other tasks of groundwater management, like decisions on protection or remediation measures, it is essential to include also risk evaluation and to consider the total risk assessment. Especially for non-hydrogeological orientated decision makers, shareholders and utilities managers it is impor-tant to go beyond the vulnerability analysis and to come up with a comprehensive risk as-sessment.
For all these tasks a documentation of the regional risk distribution on the available ground-water resources is urgently demanded. Using GIS technology certain strategies and concepts for presenting risk maps are recommended, which were partially also transposed in the differ-ent COST test sites.
The Quality of Data is critical to the development of both hazard and groundwater ability maps. Such data ensure that the conceptual models, on which any hazard or vulner-ability map is based, are sound representation of the systems of concern. A comprehensive strategy for the collation and processing of collected data is also considered vital to the map-making process.
The introduction of both Verification and Validation procedures into such map making is essential if the final products are to stand up to examination and prove useful for both plan-ning and decision-making. The methods used for verification and validation must be inde-pendent of the map-making process and can range from; physically testing the mapped area using such techniques as tracer tests, through to employing numerical models to ratify the conceptual understanding represented by the map.
Addressing data collection, collation and processing needs as well as designing appropriate verification and validation procedures at the beginning of any map making program will prove beneficial in terms of; the efficiency of the map making process and the robustness of the final product.
The concepts and methods proposed by COST Action 620 were applied and tested in twelve Test Sites in eight European countries. The test sites cover a wide range of geological, hydro-logical and climatic settings. Intrinsic vulnerability mapping was done in all test sites, and the PI method was applied most often (6 times). The other proposed methods of intrinsic vulner-ability mapping (COP, LEA, VULK, Time-Input) were applied in each one country. Specific vulnerability maps were prepared for two sites; hazard mapping was done in four sites; risk mapping in two sites and validation of vulnerability assessment in only one site.
The test sites Sierra de Líbar (Spain) and Engen (Germany) represent the most comprehensive applications of the proposed COST 620 approach. In these test sites, different methods of vul-nerability mapping were applied and compared: the PI and COP method of intrinsic vulner-ability mapping, the proposed new method for specific vulnervulner-ability mapping, and two previ-ously existing methods (EPIK and the German method). The vulnerability maps were com-bined with hazard maps to produce risk maps. In the test site Vaulion (Switzerland), intrinsic and specific vulnerability maps were done both for the groundwater resource and source. In this test site, the VULK model and mapping method was used and the vulnerability assess-ment was validated at selected points with tracer tests.
Acknowledgements
I as Chairperson would like to thank all of the participants of COST 620 for their enthusiasm and tireless work. I would also like to take the opportunity to thank Nico Goldscheider, member of the Editors Team, for his colossal efforts in collecting together and adapting all of the contributions written for this final report. I must also acknowledge the help and support of the Vice-Chairman, the Working Group Leaders, the other members of the Editors Team and the Native Speakers who helped us with the linguistic corrections: Robert Aldwell, David Drew, Alain Dassargues, Jacques Mudry, Martin Kralik, Heinz Hötzl, Dirk De Ketelaere, Donal Daly, Simon Neale, Miran Veselic and Brian Adams. I also want to thank our two COST Scientific Secretaries: Lazlo Szendrodi and Emil Fulajtar.
Neuchâtel, June 2003 François Zwahlen
List of Participants
COST 620 Members
Name Institution and Address Country Email Function
Brian Adams British Geological Survey GB [email protected] MC-WG2
Groundwater Systems & Water Quality C
Maclean Building; Wallingford Oxon
Robert Aldwell Geological Survey of Ireland IRL [email protected] Vice Chairman
Groundwater Section Editor
Beggars Bush; Haddington Road MC-WG2
Dublin <Glossary>
Bartolomé Andreo University of Málaga E [email protected] MC-WG1
Prof. Dr. Department of Geology C
Campus Universitario de Teatinos Málaga
Iñaki Antiguedad University of Basque Country E [email protected] MC-WG1
Prof. Dr. Faculty of Sciences C
Campus de Leioa, B. Sarriena S/N Leioa (Bizkaia)
Bozidar Biondic Faculty of geotechnical engineering, Univ. of Zagreb HR [email protected] MC-WG2
Prof. Dr. Hallerova aleja 7 [email protected]
42 000 Varazdin
Serge Brouyère University of Liege B [email protected] WG1
Dr. Hydrogeology - GeomaC C
Bat. B 52 / 3, Chemin de Chevreuils, 1, Sart Tilman Liège
Georg Cichocki Joanneum Research A [email protected] WG1
Mag. Institut für Hydrogeologie und Geothermie C
Elisabethstrasse 16 Graz
Massimo Civita Dpt. Georisorse e Territorio I [email protected] MC-WG3
Prof. Dr. Politechnic of Turin C
I-10129 Torino
Donal Daly Geological Survey of Ireland IRL [email protected] Editor
Groundwater Section MC-WG1
Beggars Bush; Haddington Road Dublin
Alain Dassargues University of Liège and KULeuven B [email protected] MC-Leader-WG1
Prof. Dr. Hydrogéologie (Dpt GEOMAC) Editor
Sart Tilman - Bâtiment B 52 Liège
Dirk De Ketelaere Integrated Resources Management (IRMCo) Ltd. M [email protected] MC-Leader-WG3
24 Pope Benedict XV Square Editor
Senglea <A5>
Cyril Delporte formerly: University of Neuchâtel CH *** WG1
Hydrogeology Centre (CHYN) C
Rue Emile Argand, 11 CH-2007 Neuchâtel
David Drew Trinity College Dublin IRL [email protected] MC-Leader-WG1
Prof. Dr. Department of Geography Editor
Dublin <A2-A3>
Suzanne Dunne University of Gloucestershire GB [email protected] WG1
GEMRU C
Francis Close Hall, Swindon Road Cheltenham, Gloucestershire GL50 4AZ
Radu Gogu ETH Zürich (Swiss Federal Institute of Technology) CH [email protected] WG3
Dr. Institut für Kartographie C
ETH Hönggerberg; HIL, G24.3 8093 Zürich
Nico Goldscheider University of Neuchâtel D/CH [email protected] Editor
Dr. Hydrogeology Centre (CHYN) WG1
Rue Emile Argand, 11
<A1-A2-A3-CH-2007 Neuchâtel B1-B2>
Gábor Halupka Eötvös Lorand University H [email protected] WG1 Faculty of Science, Dpt of Applied & Env. Geology C Pázmány P. stny. 1/C
Budapest
Eszter Havas- Ministry of Environment and Water H [email protected] MC-WG3
Szilagyi Dpt of River Basin Management C
Dob u. 75-81 Budapest
Heinz Hötzl University of Karlsruhe D [email protected] MC-Leader-WG3
Prof. Dr. Department of Applied Geology (AGK) Editor
Kaiserstrasse 12 <A6>
Pierre-Yves Jeannin University of Neuchâtel CH [email protected] WG1
Dr. Hydrogeology Centre (CHYN) C
Rue Emile Argand, 11 CH-2007 Neuchâtel
Sanja Kapelj Institute of Geology HR [email protected] WG2
Dr. Sachsova 2 C
HR - 10000 Zagreb
Regina Koutsi University of Athens; Faculty of Geology GR [email protected] WG3 Dynamic Tectonic Applied Geology
Panepistimioupolis Zografou GR – 15784 Athens
Ronald Kozel Federal Office for Water and Geology FOWG CH [email protected] MC-WG2
Dr. Swiss Geological Survey/Hydrogeology section C
Bern-Ittigen
Martin Kralik Umweltbundesamt & Univ. Wien. - Abt. f. Aquatische A [email protected] MC-Leader-WG2
Dr. Ökologie, Wasserschutz v. Karstgebieten Editor
Spittelauer Lände 5 <A4>
Wien
Andrej Kranjc Karst Research Institute SLO [email protected] MC-WG2
ZRC SAZU C
Titov trg 2 Postojna
Mladen Kuhta Institute of Geology HR [email protected] MC-WG1
Sachsova 2 HR - 10000 Zagreb
Judit Mádl Szőnyi Eötvös Lorand University H [email protected] MC-WG1 Prof. Dr. Faculty of Science, Dpt of Applied & Env. Geology
Pázmány P. stny. 1/C Budapest
Peter Malik Geological Survey of Slovak Republic SK [email protected] MC-WG1
Mlynska dolina 1 C
Bratislava
Philippe Meus Faculté Polytechnique de Mons G [email protected] MC-WG2
Dr. Géologie fondamentale et appliquée C
rue de Houdain 9 Mons
Gyula Mező Golder Associates (Hungary) Kft. H [email protected] WG3 Hűvösvölgyi út 54.
H-1021 Budapest
Jacques Mudry Université de Franche-Comté F [email protected] MC-Leader-WG2
Prof. Dr. Department of Geoscience Editor
16, route de Gray <A4>
F - 25030 Besançon
Inma Mugerza University of Basque Country E [email protected] WG1
Dr. Faculty of Sciences C
Campus de Leioa, B. Sarriena S/N Leioa (Bizkaia)
Simon Neale Environmental Agency Wales GB simon.neale@environment- MC-WG1
Water Resources agency.gov.uk Editor
Cambria House, 29 Newport Road, Cardiff <A1-A7-Annex> CF24 OTP Cardiff
Christoph Neukum University of Karlsruhe D [email protected] WG3
Department of Applied Geology (AGK) C
Kaiserstrasse 12 76120 Karlsruhe
Ileana-Cristina University of Liege B [email protected] WG1
Popescu Hydrogeology - GeomaC C
Bat. B 52 / 3, Chemin de Chevreuils, 1, Sart Tilman Liège
Giusepe Sappa La Sapienza University I [email protected] WG3
Dr. Dpt of Hydraulics, Transportations & Roads C
Via Eudossiana, 18 Roma
Michael Sinreich University of Neuchâtel CH [email protected] WG2
Hydrogeology Centre (CHYN) C
Rue Emile Argand, 11 CH-2007 Neuchâtel
Bernt Soefner Federal Inst.Geosciences & Natural Resources (BGR) D *** MC-WG1 Dr. Dpt. Groundwater Quality & Protection
Stilleweg 2 Hannover
Anna Spiteri Integrated Resources Management (IRMCo) Ltd. M [email protected] MC-WG3
24 Pope Benedict XV Square C
Georges C. University of Athens; Faculty of Geology GR [email protected] MC-WG1
Stournaras Dynamic Tectonic Applied Geology <B2>
Prof. Dr. Panepistimioupolis Zografou GR – 15784 Athens
Jaromir Svasta Geological Survey of Slovak Republic SK [email protected] WG3
Mlynska dolina 1 C
Bratislava
Jean-Pierre Tripet Federal Office for Water and Geology FOWG CH [email protected] former MC Dr. Swiss Geological Survey/Hydrogeology section
Bern-Ittigen
Luigi Tulipano La Sapienza University I [email protected] MC-WG1 Prof. Dr. Dpt of Hydraulics, Transportations & Roads
Via Eudossiana, 18 Roma
Iñaki Vadillo University of Málaga E [email protected] WG2
Dr. Department of Geology, Faculty of Science C
Campus de Teatinos, s/n Málaga
Miran Veselic Agency for Radwaste Management SLO [email protected] Editor
Prof. Dr. Parmova 53 WG3
Ljubljana Univ. Ljubljana
Faculty of Natural Sciences and Technology Aškerčeva 12
Ljubljana
Michael von Hoyer Federal Inst.Geosciences & Natural Resources (BGR) D [email protected] MC-WG1
Dr. Dpt. Groundwater Quality & Protection C
Stilleweg 2 <Ex.Summ>
Hannover
Heike Werz University of Karlsruhe D [email protected] WG3
Department of Applied Geology (AGK) Kaiserstrasse 12
76120 Karlsruhe
Franziska Zibuschka Institute for Water Provision, Water Ecology & A [email protected] WG2
Dr. Waste Management. - Department for Sanitary C
Engineering and Water Pollution Control Muthgasse 18
A-1190 Vienna
Hans Zojer Joanneum Research A [email protected] MC-WG3 Prof. Dr. Institut für Hydrogeologie und Geothermie
Elisabethstrasse 16 Graz
Hartmut Zojer Joanneum Research A [email protected] WG1
Mag. Institut für Hydrogeologie und Geothermie C
Elisabethstrasse 16 Graz
François Zwahlen University of Neuchâtel CH [email protected] Chairman, Editor
Prof. Dr. Hydrogeology Centre (CHYN) MC-WG1
Rue Emile Argand, 11
<A1-Summary-CH-2007 Neuchâtel Conclusions>
Legend
The last column describes the function of the respective person in COST Action 620
MC: Management Committee Member Editor: Member of the Editors Team WG1: Member of Working Group 1
Leader: Leader of the Respective WG (two Leaders per WG) Chairman and Vice Chairman of COST Action 620 <A5>: Coordinator of Chapter 5 in Part A
C: Contributor to the Final Report (Author of at least one section)
Contributors to the Final Report
The following persons are no official members of COST Action 620 but contributed to particular sections of the final report
Francisco Carrasco University of Málaga E [email protected] C
Prof. Dr. Department of Geology Campus Universitario de Teatinos Málaga
Fabien Cornaton University of Neuchâtel CH [email protected] C Hydrogeology Centre (CHYN)
Rue Emile Argand, 11 CH-2007 Neuchâtel
Catherine Coxon Trinity College Dublin IRL [email protected] C
Dr. Geology Department Dublin 2
Lorenz Hurni ETH Zürich (Swiss Federal Institute of Technology) CH [email protected] C Prof. Dr. Institut für Kartographie
ETH Hönggerberg; HIL, G24.3 8093 Zürich
Pablo Jiménez University of Málaga E [email protected] C
Department of Geology Campus Universitario de Teatinos Málaga
Thomas Keimel formerly: Federal Environment Agency, Vienna A [email protected] C present: Promatis Ltd., Storchengasse 1, 1150 Vienna
Garrett Kilroy Trinity College Dublin IRL [email protected] C Dr. Geology Department
Dublin 2
Tanja Liesch University of Karlsruhe D liesc h@a g k.uka .d e C Department of Applied Geology (AGK)
Kaiserstrasse 12 76120 Karlsruhe
Andrea Mindszenty Eötvös Lorand University H [email protected] C Prof. Dr. Faculty of Science, Dpt of Applied & Env. Geology
Pázmány P. stny. 1/C Budapest
Katalin Nyúl Eötvös Lorand University H [email protected] C Faculty of Science, Dpt of Applied & Env. Geology
Pázmány P. stny. 1/C Budapest
María J. Perles University of Málaga E [email protected] C
Department of Geography Campus Universitario de Teatinos Málaga
James Petch University of Manchester GB [email protected] C Prof. Dr. Teaching and Learning Support Unit
Oxford Road M13 9PL Manchester
Alain Pochon University of Neuchâtel CH [email protected] C Hydrogeology Centre (CHYN)
Rue Emile Argand, 11 CH-2007 Neuchâtel
Fridjof Schmidt University of Stuttgart D [email protected] C Institute for Hydraulic Engineering stuttgart.de
Pfaffenwaldring 61 [email protected]
D-70550 Stuttgart
Jesús María Vías University of Málaga E [email protected] C
Geography Dpt. Campus Teatinos S/N Malaga
Table of Contents
Summary ...I
François Zwahlen, David Drew, Nico Goldscheider, Heinz Hötzl, Dirk de Ketelaere, Martin Kralik, Jacques Mudry & Simon Neale
Acknowledgements ... V List of Participants ...VII Table of Contents ...XI
Part A – Methodology ... 1
1 Introduction ... 1
François Zwahlen, Nico Goldscheider & Simon Neale 2 Groundwater Vulnerability ... 5
2.1 The concept of groundwater vulnerability ... 5
Nico Goldscheider 2.1.1 Background of the concept and definitions... 5
2.1.2 The origin-pathway-target model... 5
2.1.3 Resource and source vulnerability ... 6
2.1.4 The special situation in karst... 7
2.1.5 Vulnerability and the European Water Directive... 9
2.2 A quantitative point of view of the concept of vulnerability ... 10
Serge Brouyère 2.2.1 The needs and advantages of a physically-based definition ... 10
2.2.2 Basis of a practicable definition of groundwater vulnerability... 10
2.3 References ... 15
3 Intrinsic Vulnerability ... 16
3.1 Overview ... 16
David Drew 3.2 How the European Approach was developed ... 16
David Drew 3.3 The European Approach... 17
Nico Goldscheider & Ileana Cristina Popescu 3.3.1 Basic concepts ... 17
3.3.2 Overview ... 17
3.3.3 Overlying layers (O factor) ... 18
3.3.4 Concentration of flow (C factor)... 20
3.3.5 Karst network development (K factor)... 20
3.3.6 Precipitation regime (P factor) ... 21
3.4 Resource and source vulnerability maps ... 21
Nico Goldscheider & Ileana Cristina Popescu 3.5 Derived Methods ... 22
Nico Goldscheider & David Drew 3.6 References ... 23
4 Specific vulnerability ... 25
4.1 Principles of specific vulnerability assessment... 25
Michael Sinreich, Ronald Kozel & Jacques Mudry 4.1.1 Need of specific vulnerability mapping ... 25
4.1.2 Main karst characteristics relevant to specific vulnerability... 25
4.1.3 Effects of specific contaminant behaviour ... 26
4.1.4 Processes relevant to specific contaminant fate and transport ... 27
4.1.5 The working of specific vulnerability assessment ... 29
4.1.6 Contribution of COST Action 620 to specific vulnerability assessment ... 29
4.2 Physical and chemical properties of layers and related processes ... 29
Sanja Kapelj, Ronald Kozel & Michael Sinreich 4.3 Properties of contaminants and related processes ... 34
Michael Sinreich 4.4 Contaminants in carbonate-karst groundwater... 36
4.4.1 Inorganic contaminants ... 36
Jacques Mudry, Catherine Coxon, Garrett Kilroy, Sanja Kapelj, Heinz Surbeck & Iñaki Vadillo 4.4.2 Organic contaminants... 43
Martin Kralik, Andrej Kranjc & Philippe Meus 4.4.3 Pesticides... 51
Ronald Kozel 4.4.4 Microorganisms... 56
Franziska Zibuschka, Brian Adams & Martin Kralik 4.5 Conceptual model for specific vulnerability assessment ... 64
Michael Sinreich, Ronald Kozel & Jacques Mudry 4.5.1 Overview ... 64
4.5.2 European approach for specific vulnerability ... 64
4.6 Specific vulnerability method ... 67
Michael Sinreich, Ronald Kozel & Jacques Mudry 4.6.1 Introduction ... 67
4.6.2 Assessment procedure ... 68
4.6.3 Examples ... 79
4.6.4 Limitations ... 80
4.6.5 Link to intrinsic vulnerability... 80
4.6.6 Concluding remarks ... 81
4.7 References ... 82
5 Hazard Mapping... 84
5.1 Vulnerability in a Risk Framework... 84
Dirk De Ketelaere & Donal Daly 5.2 Professional Needs and Applications of Hazard Maps ... 85
Dirk De Ketelaere 5.3 Hazard Analysis and Mapping ... 86
Dirk De Ketelaere, Heinz Hötzl, Christoph Neukum, Massimo Civity & Giuseppe Sappa 5.3.1 Step 1: Definition and Inventory of Hazards ... 86
5.3.2 Step 2: Hazard Data Requirements ... 88
5.3.3 Step 3: Rating and Weighting of Hazards... 91
5.3.4 Step 4: Graphical Interpretation ... 96
5.3.5 Step 5: Mapping Techniques... 103
5.3.6 Step 6: Data Evaluation... 104
5.4 References ... 105
6 Risk Assessment... 106
6.1 Risk Definition ... 106
Donal Daly, Heinz Hötzl & Dirk De Ketelaere 6.2 Assessment concept... 108
Heinz Hötzl 6.2.1 General approach... 108
6.2.2 Risk intensity assessment ... 109
6.2.3 Risk sensitivity assessment ... 110
6.2.4 Aggregation of risk components ... 112
6.3 Risk Mapping ... 113
Heinz Hötzl, Cyril Delporte, Tanja Liesch, Peter Malik, Christoph Neukum & Jaromir Svasta 6.3.1 General Remarks and Mapping Techniques ... 113
6.3.2 Mapping procedure ... 114
6.4 References ... 120
7 From Data Collection To Map Validation ... 122
7.1 Overview ... 122
Simon Neale 7.2 Data collection using remote sensing... 122
Anna Spiteri 7.3 Data processing using GIS ... 125
Radu Constantin Gogu, Lorenz Hurni, Dirk De Ketelaere & James Petch 7.4 Demonstrating the reliability of our maps... 131
Simon Neale 7.5 Key Map Validation Tools... 132
7.5.1 Hydraulics and spring hydrographs... 132
Michel Bakalowicz 7.5.2 Natural Tracers... 133
Martin Kralik & Jacques Mudry 7.5.3 Artificial Tracers ... 135
Nico Goldscheider 7.5.4 Analytical and numerical modelling ... 136
Alain Dassargues & Ileana Cristina Popescu 7.6 References ... 138
Part B – Methods and Applications... 141
1 Mapping Methods ... 143
1.1 Overview ... 143
Nico Goldscheider 1.2 The PI method ... 144
Nico Goldscheider 1.2.1 Background and Overview... 144
1.2.2 General Concept of the PI Method... 144
1.2.3 Protective Cover (P factor)... 146
1.2.4 Infiltration Conditions (I factor)... 149
1.2.5 Construction of the Vulnerability Map ... 153
1.3 The VULK analytical transport model and mapping method ... 155
Fabien Cornaton, Nico Goldscheider, Pierre-Yves Jeannin, Pierre Perrochet, Alain Pochon Michael Sinreich & François Zwahlen 1.3.1 Introduction ... 155
1.3.2 Basic idea of VULK... 155
1.3.3 Model concept ... 156
1.3.4 Input data... 157
1.3.5 Output data ... 158
1.3.6 VULK as a mapping method... 158
1.3.7 Other possible applications and future developments... 160
1.3.8 References ... 160
1.4 A Localised European Approach (LEA)... 161
Suzanne Dunne 1.4.1 Overview ... 161
1.4.2 Overlying Layers (O factor)... 161
1.4.3 Flow Concentration (C factor) ... 162
1.4.4 Combination of the Two Parameters... 162
1.4.5 Validation by Means of Conductivity Data... 163
1.4.6 References ... 163
1.5 The COP method... 163
Jesús Mª Vías, Bartolomé Andreo, Mª Jesús Perles, Francisco Carrasco, Iñaki Vadillo & Pablo Jiménez 1.5.1 Background ... 163
1.5.2 General characteristics of the proposed method ... 164
1.5.3 O factor (Overlying layers) ... 166
1.5.4 C factor (flow Concentration) ... 167
1.5.5 P Factor (Precipitation) ... 169
1.5.6 COP vulnerability index... 171
1.5.7 References ... 171
1.6 The Time-Input method ... 172
Martin Kralik & Thomas Keimel 1.6.1 Introduction ... 172
1.6.2 Assessment Scheme ... 172
1.6.3 Acquisition of assessment data ... 175
1.6.4 QA/QC of each step ... 175
1.6.5 Calculating the Intrinsic Vulnerability... 176
1.6.6 Evaluation of main factors ... 178
1.6.7 Discussion ... 178
1.6.8 References ... 180
2 Applications ... 182
2.1 Overview ... 182
Nico Goldscheider 2.2 Sierra de Líbar, Southern Spain ... 183
Bartolomé Andreo, Nico Goldscheider, Iñaki Vadillo, Jesús M. Vías, Christoph Neukum, Julia Brechenmacher, Francisco Carrasco, Heinz Hötzl, Pablo Jiménez, María J. Perles & Michael Sinreich 2.2.1 Background ... 183
2.2.2 Test site characteristics... 184
2.2.3 Intrinsic vulnerability ... 184
2.2.4 Specific vulnerability ... 189
2.2.5 Hazard mapping ... 193
2.2.7 Conclusions ... 198
2.2.8 References ... 199
2.3 Engen, Swabian Alb, Germany... 200
Nico Goldscheider, Julia Brechenmacher, Heinz Hötzl & Christoph Neukum 2.3.1 Geographical and Geological Overview ... 200
2.3.2 Intrinsic Vulnerability ... 202
2.3.3 Hazard Mapping... 208
2.3.4 Risk mapping... 214
2.3.5 References ... 216
2.4 Vaulion test site, Jura Mountains, Switzerland ... 217
Alain Pochon, Michael Sinreich, Michaël Digout, François Zwahlen 2.4.1 Introduction ... 217
2.4.2 Geological and hydrogeological setting... 217
2.4.3 Intrinsic vulnerability ... 219
2.4.4 Specific vulnerability ... 224
2.4.5 Tracer testing... 228
2.4.6 Final conclusions and further development ... 229
2.4.7 References ... 229
2.5 Nassfeld, Southern Alps, Austria ... 230
Georg Cichocki, Hans Zojer & Hartmut Zojer 2.5.1 Geographical and Geological Overview ... 230
2.5.2 Intrinsic Vulnerability – Comparison of the VURAAS and PI method... 230
2.5.3 Hazard Mapping... 235
2.5.4 Graphical Interpretation ... 237
2.5.5 Usefulness of the hazard map for the test site... 238
2.5.6 References ... 240
2.6 Zöbelboden, Northern Calcareous Alps, Austria ... 241
Martin Kralik & Thomas Keimel 2.6.1 General ... 241
2.6.2 Geology and soil (sediment) characteristics of the investigated area ... 241
2.6.3 Groundwater vulnerability assessment... 242
2.6.4 Hazard assessment... 245
2.6.5 References ... 246
2.7 Veldensteiner Mulde, Franconian Alb, Germany ... 246
Fridjof Schmidt 2.7.1 Geographical and Geological Overview ... 247
2.7.2 Intrinsic Vulnerability Mapping (PI Method) ... 248
2.7.3 Discussion ... 251
2.7.4 References ... 252
2.8 Néblon basin, Belgium... 252
Valérie Lomba & Alain Dassargues 2.8.1 General ... 252
2.8.2 Geological characteristics of the investigated area ... 253
2.8.3 Vulnerability mapping using the PI method ... 254
2.8.4 References ... 258
2.9 The Albiztur Karst Unit, Basque Country, Spain... 259
Inma Mugerza & Iñaki Antigüedad 2.9.1 General ... 259
2.9.4 Conclusions and comments... 264
2.9.5 References ... 265
2.10 Lincolnshire and Schwyll, UK ... 265
Suzanne Dunne 2.10.1 Lincolnshire test site... 265
2.10.2 Schwyll test site... 267
2.10.3 References ... 270
2.11 Muranska Planina Plateau, Slovakia ... 270
Peter Malik & Jaromir Svasta 2.11.1 General and geological characteristics of the investigated area... 270
2.11.2 Karst and Hydrogeology of the area ... 270
2.11.3 Intrinsic Vulnerability Mapping... 271
2.11.4 Discussion ... 273
2.11.5 References ... 274
2.12 Veszprém-Kádárta Plateau, Transdanubian Central Range, Hungary ... 274
Judit Mádl-Szőnyi, KatalinNyúl, Gyula Mező, Eszter Havas-Szilágyi, AndreaMindszenty, Gábor Halupka 2.12.1 Geographical and Geological Overview ... 274
2.12.2 Intrinsic vulnerability mapping ... 275
2.12.3 Hazard Mapping... 281
2.12.4 References ... 285
Conclusions ... 287
François Zwahlen, David Drew, Nico Goldscheider, Heinz Hötzl, Dirk de Ketelaere, Martin Kralik, Jacques Mudry & Simon Neale Glossary... 291
Robert Aldwell Appendix – Existing Vulnerability Mapping Methods ... 293
Part A – Methodology
1 Introduction
Water resources are vitally important for the future of humankind. COST Action 620 focuses on the protection of groundwater within karst aquifers to assure its quality for potable use and in supporting varied ecological habitats.
Groundwater from karst aquifers is among the most important drinking water resource in Europe: carbonate terrains occupy 35 % of the land-surface and a significant portion of the drinking water is abstracted from karst aquifers. In some European countries, karst water con-tributes 50 % to the total drinking water supply and in many regions it is the only available source of fresh water (COST 65, 1995).
Fig. 1: Carbonate rock outcrops in Europe (COST 65, 1995).
Groundwater resources are often highly vulnerable to contamination from human activity, none more so than those found in karst aquifers. As a result, appropriate protection measures must be put in place, a point recognised in the European Commissions’ Water Framework Di-rective (2000).
The work of COST Action 65 highlighted the need to develop an integrated method that ad-dresses the question of groundwater vulnerability and risk in karst environments. As a result, the Directorate General for Science, Research and Development of the European Commission set up COST Action 620. The objective was to develop an approach to “vulnerability and risk mapping for the protection of carbonate (karst) aquifers”. This new Action, made up of dele-gates from 16 European Countries, worked from 1997 to 2003 in order to achieve this goal. The philosophy of the new Action was based on the requirements of the European Water Framework Directive (2000), which aims to establish a framework for community action in the field of water policy. The directive demands sustainable water use based on long-term protection of water resources.
Fig. 2: Conceptual Model of a Karst Aquifer (Gunn 1986)
Karst aquifers are well known for their particular vulnerability to contamination arising from their special characteristics, like thin soils, point recharge in dolines, shafts and swallow holes, as well as concentration of flow in the epikarst and vadose zone. Such characteristics
result in contaminants easily reaching groundwater, where they are transported rapidly in kar-stic conduits over large distances. As the residence time of contaminants in the system is often short and their interaction with the aquifer limited, many processes of contaminant attenuation like filtration and adsorption, as well as chemical and microbiological decay often do not work effectively in karst systems.
COST Action 620 established a program to address the objectives agreed by the Commission; however the complexity of the task soon became apparent. Experts participating in this Action soon realised that the philosophies behind each of the existing methods were often very dif-ferent. This was is no small part due to the legislative background of the country within which the methods were developed. The variation in legislative backgrounds influenced not only the practical implementation of individual methods, but also the conceptual approach to dealing with the vulnerability question.
The diverse views help by experts within the Action often led to passionate debate, which has significantly enhanced the work undertaken, making it both interesting and profitable. A con-sensus of opinion has at times been difficult to achieve and there continue to be areas that re-main open to debate. The Action worked both through Management Committee meetings held biannually in participating countries as well as Working Group and Task Group meetings, and short-term scientific missions, each serving to distil and refocus our ideas.
We believe that the work undertaken by Action 620 is a significant contribution to the devel-opment of sustainable long-term protection strategies for karst groundwater bodies. We achieved our objective by utilising 3 Working Groups (WG):
• WG1 Developed an approach to the mapping of intrinsic vulnerability of karst groundwa-ter, based on sound scientific principles. As described, intrinsic vulnerability is a function of the geological, hydrogeological and hydrological properties of a system and is by defi-nition independent of the properties of specific contaminants. The main intrinsic factors, which decide on the vulnerability of groundwater to contamination, are the overlying lay-ers, flow concentration, the precipitation regime and the properties of the aquifer itself, in this case the degree of development of the karst network. Methods arising from the devel-oped approach were trailed at national test sites in various karst settings across Europe. • WG2 established a system to characterise the vulnerability of groundwater to specific
con-taminants or groups of concon-taminants. As described, specific vulnerability takes into ac-count both the properties of the system and those of the contaminants, such as; nitrates, bacteria, chlorinated solvents and heavy metals. Important processes for specific contami-nant attenuation include; cation exchange, biodegradation, precipitation, filtration and de-cay. A significant amount of effort has been put into the development of a new specific vulnerability methodology, whilst promising; the testing of this work is still in progress. • WG3 worked on hazard and risk mapping. Hazards are activities and land-use practices
that pose a threat to groundwater, such as agriculture, tourism, traffic and industry. Risk maps consider the activities that present the “risk” that threatens groundwater. They are obtained by synthesising the information presented on both hazard and vulnerability maps. The results of the three working groups are presented in this final report. This work is founded on far more extensive studies within the 15 participating countries. The final report provides the reader with key references to these various national projects.
It must be appreciated that whilst vulnerability maps provide are a vital tool with which to protect karst groundwater, they remain a simplification. This is due to extrapolation and inter-pretation of data sets over relatively large areas, as well as the occasional use of data of
un-known quality. These difficulties are offset by the validation process, which considers the success of the map to reproduce prevailing hydrogeological conditions. We would however advise that prior to embarking on any major development project within a karst area; a site-specific impact assessment is undertaken to a standard commensurate with the degree of risk posed.
As the years passed bye, time was running out, were our ambitions too great? Our aim to de-velop an integrated methodology for assessing both intrinsic and specific vulnerability, as well as allowing the degree of “risk” posed by certain activities to be evaluated and mapped, was well advanced but not yet finalised. We had however made significant advances and whilst the Action has now come to an end, work will continue. Surely future work will be less focused than during the years of COST Action 620 but will benefit from the strong network of collaborative workers, indeed friends, developed by this COST.
COST has provided a unique opportunity to bring together experts from across Europe to de-velop ways to protect our valuable karst groundwater resource. This opportunity has not only benefited research into vulnerability, but also each and every individual that has taken part. References
COST 65 (1995): Hydrogeological aspects of groundwater protection in karstic areas, Final report (COST action 65). – European Comission, Directorat-General XII Science, Research and Development, Report EUR 16547 EN: 446 p.; Brüssel, Luxemburg.
European Water Directive (2000): Directive 2000/60/EC of the European Parliament and of the Council of 23 October 2000 establishing a framework for Community action in the field of water policy.
Gunn, J. (1986): Modelling of conduit flow dominated karst aquifers. In Günay, G. & Johnson, A.I. (eds), Karst water resources. IAHS, Publication 161: 587-596. Wallington, UK.
2 Groundwater
Vulnerability
2.1 The concept of groundwater vulnerability 2.1.1 Background of the concept and definitions
The term ‘vulnerability of groundwater to contamination’ was introduced by MARGAT in
1968. However, the term ‘vulnerability’ is not restricted to groundwater but is used in a wide sense to describe the sensitivity of whatever to any kind of stress, e.g. the vulnerability of global climate to human impacts. As this report deals with the vulnerability of groundwater to contamination, the term is always used in that sense.
The concept of groundwater vulnerability is based on the assumption that the physical envi-ronment provides some natural protection to groundwater against human impacts, especially with regard to contaminants entering the subsurface environment (VRBA & ZAPOROZEC
1994). The term „vulnerability to contamination“ has the opposite meaning to the term „natural protection against contamination“ and the terms can be used alternatively.
VRBA & ZAPOROZEC (1994) emphasise that vulnerability is a relative, non-measurable and
dimensionless property. They suggest distinguishing between intrinsic (natural) and specific vulnerability. The former should only depend on the natural properties of an area, while the latter should additionally take into account the properties of the contaminant.
COST 65 (1995) presents an overview on the various definitions of vulnerability that have been proposed until present. Most of them are quite similar. The COST Action 620 evaluated and discussed this issue and consequently proposes the following definitions:
• The intrinsic vulnerability of groundwater to contaminants takes into account the geo-logical, hydrological and hydrogeological characteristics of an area, but is independent of the nature of the contaminants and the contamination scenario.
• The specific vulnerability takes into account the properties of a particular contaminant or group of contaminants in addition to the intrinsic vulnerability of the area.
The advantage of such qualitative and descriptive definitions is that the term ‘vulnerability’ is often intuitively understood, particularly by decision-makers in the planning process. Vulner-ability maps are a means of presenting various complex hydrogeological properties in an inte-grated, comprehensible way. A map showing areas of different colour symbolising different degrees of vulnerability (or natural protection respectively) is easily to interpret and can be used as a practical tool for land-use planning, protection zoning and risk assessment.
However, there are also disadvantages in using a qualitative approach alone. A property, which is not precisely defined, cannot be derived unambiguously from measurable quantities. Furthermore, validation is problematic. Therefore, some ideas of how theses qualitative defi-nitions could be linked with a quantitative point of view are outlined in section 2.2.
2.1.2 The origin-pathway-target model
The concept of groundwater vulnerability is based on an origin-pathway-target model for en-vironmental management (Fig. 3).
• The origin (also referred to as source of contamination) is the assumed place of release of a contaminant. For vulnerability mapping, it is assumed that the contamination takes place at the land surface. This refers to hazards like cattle pasture and the spreading of pesticides
or fertiliser. However, some hazards are located below the surface, e.g. a leakage in a sewerage system.
• The pathway is the flow path of a potential contaminant from its point of release (origin), through the system, to the point that has to be protected (target). For resource protection, the pathway consists of the mostly vertical passage within the protective cover, for source protection it also includes horizontal flow in the aquifer.
• The target (receptor) is the water, which has to be protected. For resource protection (see next section) the target is the groundwater surface in the relevant aquifer under considera-tion, for source protection it is the water in the well or spring.
Fig. 3: The European Approach to groundwater vulnerability mapping is based on an origin-pathway-target con-ceptual model. The possible contamination event is assumed to originate at the land-surface. For resource protection, the groundwater surface in the aquifer is the target; for source protection, the spring or well is the target. For resource protection, the pathway consequently consists of the passage through the unsatu-rated zone (also referred to as the overlying layers); for source protection, it includes the passage through the aquifer (Goldscheider 2002). The adoption of this general scheme for karst aquifers is presented in the chapter on intrinsic vulnerability.
2.1.3 Resource and source vulnerability
In all European countries, groundwater is considered to be a valuable resource. The European Water Directive (2000) states that „water is not a commercial product like any other but, rather, a heritage which must be protected, defended and treated as such“. The directive estab-lishes a strategic framework for managing the water environment and sets out a common ap-proach to protecting and setting environmental objectives for all groundwater and surface wa-ter within the European Community.
The highest priority is to protect groundwater, which is used for drinking water supply. Thus, there are special regulations in all European countries, which aim on the protection of drink-ing water sources. The source might be a captured sprdrink-ing, a pumpdrink-ing well, a drainage gallery or any other groundwater abstraction point.
It is practicable to distinguish between resource and source protection, although both concepts are closely related to each other – it is impossible to protect a source without protecting the resource. Consequently, COST 620 proposes to distinguish between two types of intrinsic vulnerability maps: resource and source vulnerability maps. To do so, it is essential to define
the target precisely (Fig. 3): For resource protection, the groundwater surface in the aquifer is the target. In case of confined and/or artesian conditions, the target is identical to the top of the aquifer under consideration and not to the potentiometric surface. The pathway conse-quently consists of the mostly vertical passage through the layers above the groundwater sur-face or sursur-face of the aquifer respectively. These overlying layers are mostly unsaturated but may be temporally and locally saturated. For source protection, the water in the well or spring is the target. The pathway consequently additionally includes the mostly horizontal flow route in the aquifer.
2.1.4 The special situation in karst
The concept of groundwater vulnerability is applicable for all types of aquifers – granular, fractured and karst. However, due to the special properties of karst, it is essential to develop a concept, which takes into account the nature of karst. Until present, this was done by develop-ing two kinds of method:
•
methods specially dedicated to karst (e.g. EPIK method, DOERFLIGER & ZWAHLEN 1998);•
methods applicable for all types of aquifers but providing methodological tools for karst (e.g. PI method, GOLDSCHEIDER et al. 2000).COST 620 proposes an approach of the second type, which is considered to be more applica-ble for the following reasons: (1) there are many intermediate conditions between a purely fractured and an extremely karstified carbonate aquifer; (2) there are transitional forms be-tween granular and karst aquifers, e.g. karstified carbonate gravel or intensively fractured dolomites; (3) there are often several types of aquifers in one area which interact in some cases, e.g. a granular aquifer overlying a karst aquifer; (4) a method applicable for all type of aquifers is more likely to be accepted and applied by land-use planners and regional decision makers.
The following characteristics of karst systems are relevant with respect to groundwater vul-nerability and should consequently be taken into account:
• Each karst system has its individual characteristics. Thus, the detailed hydrogeological in-vestigation of a karst system is the precondition for vulnerability mapping.
• Karst systems are highly heterogeneous and anisotropic. Interpolation and extrapolation of field data is more problematic for karst areas than for other areas.
• Karst groundwater is recharged both by diffuse infiltration through the soil and by concen-trated point recharge via dolines and swallow holes.
• The layers above the groundwater surface provide some protection. However, lateral sur-face or subsursur-face flow has to be expected in areas covered by low permeable layers. These lateral flow components maybe tributary to a stream sinking into the karst aquifer via a swallow hole and bypass the protective function of the overlying layers.
• The presence of an epikarst zone has to be expected. The functions of the epikarst are wa-ter storage and concentration of flow. The first process increases the natural protection of the system while the second process increases vulnerability. The structure and function of the epikarst zone are difficult to assess. A large portion of it is not visible at the land sur-face.
• Karstic aquifers are characterised by a dual porosity due to fractures and solutional voids (conduits) and frequently by a triple porosity due to the additional presence of
inter-conduits act as drains. As there are both extremely fast and slow flow components within a karst system, contaminants can be transported very fast or stored for a very long time. • Karst systems are characterised by a fast and strong hydraulic reaction to hydrologic
events. The temporal variations of the groundwater table often reach several tens of metres. In many karst systems, the groundwater table is discontinuous and difficult to determine. • Karst catchments are often extremely large and hydraulically connected over long
dis-tances. Watersheds are often difficult to determine and variable in time, dependent on the respective hydrologic conditions. The catchments of karst springs often overlap and the flow paths proved by tracer tests often cross each other.
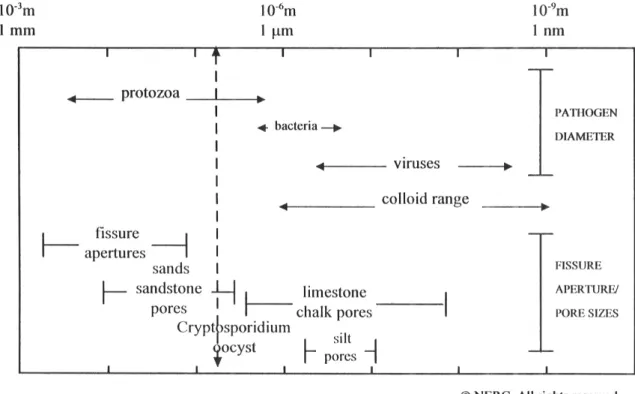
With respect to the main characteristics of karst environments relevant to specific vulnerabil-ity, two groups of properties play a significant role in the: hydraulic and mineralogical-geochemical properties. Combined, these properties are linked to the mobility and persistence of contaminants
In the karst system, hydraulic properties play a significant role in the migration of contami-nants
• The existence of three different superimposed layers, with three hydraulic behaviours: epi-karst is a high conductivity medium, with horizontal-dominant two-phase flowpaths. It col-lects infiltration and gathers it to the vertical conduits of the unsaturated zone. This me-dium contributes to the quick transit of the low-persistent contaminants to the water table. • The existence of dual permeability, which differentiates residence times. Transit can be
very rapid in conduits, slow in fissured blocks. The consequence is that conduits can quickly convey non-persistent pollutants, whilst blocks preserve conservative contami-nants, enabling self-purification or reduction of the other pollutants. Furthermore, these voids control the flux of contaminants. Several types of contaminant (hydrocarbons) or particles (pathogens) require a minimum opening to transit through.
• Thus, the percentage of diffuse flow will be a significant parameter in the retardation and attenuation processes acting in the specific vulnerability.
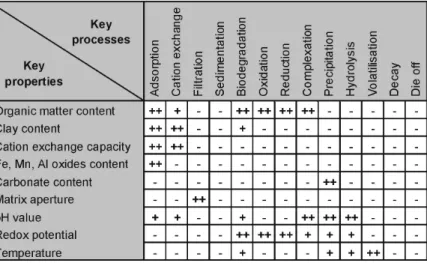
Mineralogical and geochemical properties are also important. For example the presence of different minerals creates specific retention conditions:
• The carbonate medium restricts mobility of reactive contaminants such as phosphate, which precipitates as apatite, and heavy metals that can precipitates as carbonate species. The H+ proton, which can originate in acid rains and pedogenetic processes, is quickly buffered by the carbonate medium, enabling the production of Ca2+ and HCO3-. Gener-ally, this carbonate medium is absent from the covering soils, which are residual forma-tions, and this role is played by the subsoil and the epikarst. The pH value, despite its low variability in karst environments, due to the buffer effect of the carbonate medium, can play together with Eh a role in the solubility of inorganic metals.
• Clays play a double mineralogical and geochemical role: their specific surface enables ad-sorption of non-ionic substances (organics, bacteria) and their cationic exchange capacity (CEC) enable retention of cations, especially heavy metals. These clays exist in covering soils (residual clays), non-karstic covering formations (geological clays), and also detrial sediments which are present in the karstic network, both in the unsaturated and saturated zones.
• Organic matter, which is abundant in topsoil (which is often scarce and thin), and in the soil infillings of karren, play two roles: adsorption of organic contaminants and formation of ligands with metals.
• Eh is generally high in a karst environment (epikarst), which is widely open to the atmos-pheric reservoir. In this case, dissolved heavy metals can precipitate (oxides, hydroxides), organic matter and nitrogen species oxidise. Nevertheless, reducing conditions can exist in a carbonate environment, in different layers: in the soil, which can be hydromorphic and anoxic, and in the saturated zone which can be confined, when it is covered by impervious layers. In both cases, Redox potential becomes low and mobilisation of metallic oxides and hydroxides is possible. Nitrogen can also be reduced, in the best case as gaseous N2, in the
worst as NO2- or NH4+. Oxidizing or reducing conditions can select aerobial and anaerobial
bacteria, which role can improve or worsen water quality.
• Temperature sometimes plays an active role. Several degradation processes are more active at higher temperatures, so seasonal variations may modulate the attenuation.
2.1.5 Vulnerability and the European Water Directive
The European Water Directive (2000) aims to establish a framework for community action in the field of water policy. The directive demands sustainable water use based on a long-term protection of water resources. The term „vulnerability“ is only used in relation to coastal aquatic ecosystems. However, the idea of groundwater vulnerability assessment is indirectly included in the directive.
Annex II, Section 2.1 requires an initial characterisation of all groundwater bodies to assess their uses and the degree to which they are at risk. As part of this initial characterisation, Member States must „employ existing hydrological, geological, pedological, land-use, dis-charge, abstraction and other data“ to identify a number of characteristics including the gen-eral character of the overlying strata in the catchment area from which the groundwater body receives its recharge. Annex II, Section 2.2 requires that those groundwater bodies which have been identified as being ‘at risk’, shall be assessed more precisely. This characterisation shall include information on (shortened):
• geological and hydrogeological characteristics of the groundwater body, including hydrau-lic conductivity, porosity, confinement and stratification of the groundwater body;
• characteristics of the superficial deposits and soils, including the thickness, porosity, hy-draulic conductivity and absorptive properties;
• an inventory of associated surface systems, including bodies of surface water, with which the groundwater body is dynamically linked;
• the directions and exchange rates of water between the groundwater and surface systems; • sufficient data to calculate the long term annual average rate of overall recharge.
Although this is rather an inventory list to characterise a groundwater body, it can also be used as a list of data that should be included in the approach to mapping groundwater vulner-ability. The vulnerability assessment and mapping approach presented by COST 620 is di-rectly linked to the information requirements of the Directive.
2.2 A quantitative point of view of the concept of vulnerability 2.2.1 The needs and advantages of a physically-based definition
As previously mentioned, vulnerability is often considered as a qualitative, non-measurable notion than as a quantitative property. This allows for some flexibility in the vulnerability as-sessment, while providing results, which are easily understood also by non-scientists.
However, the lack of a physically based precise definition also has some drawbacks. Vulner-ability assessments are often subjective. If different methods are tested in one area, the result-ing maps are often different and sometimes contradictory. The results are difficult to compare and, more fundamentally, to validate.
Consequently, there is a need for an examination of vulnerability concepts from a quantitative point of view, and for the establishment of clearly identified reference criteria for quantifica-tion, comparison and validation purposes.
2.2.2 Basis of a practicable definition of groundwater vulnerability 2.2.2.1 Introduction
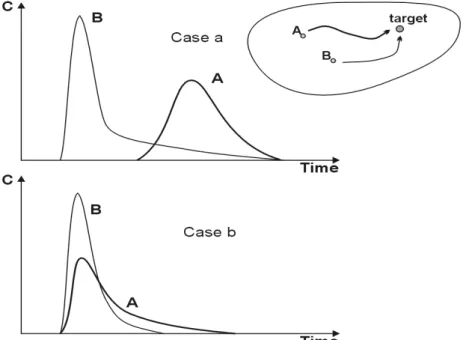
To derive both a physically based definition and criteria for groundwater vulnerability as-sessment, one can start from the point of view that this concept should reflect natural mecha-nisms and processes that make the aquifer more or less sensitive to contamination. The ap-plied definition of vulnerability should thus reflect the capacity of the aquifer to reduce any type of contamination. This reduction can occur mainly in two ways: (a) a decrease of con-taminant concentration or (b) a decrease of pollution duration. In the case of an accidental contamination event, there are three practical questions, which a water user wants to have an-swered by a hydrogeologist (Fig. 4):
Fig. 4: The three questions that a water user wants to be answered in the case of an accidental contamination in the catchment.
1. how long does it take until the contamination reaches the target, 2. at what concentration level will the target be contaminated, 3. for how long will the contamination last?
A method of vulnerability assessment should consequently take into account the properties, which control the transit time of a contaminant from the origin (land surface) to the target, the
contaminant concentration and, in the case particularly of instantaneous pollution, the dura-tion of the contaminadura-tion at the target. The transit time mainly depends on the permeability, effective porosity, hydraulic gradient and thickness of the layers along the pathway. The contaminant concentration level depends on the attenuation capacity of the aquifer, and also on the proportion of recharge versus runoff – a significant portion of water and contaminants may leave the catchment via surface runoff. Any potential contaminant “breakthrough” can thus be mapped into a three dimensional graphic. The axes of this graphic hold transfer time, concentration level and duration criteria. However, it is clear that a vulnerability map is, by definition, independent from the contamination scenario. It should not only be applicable for an accidental (instantaneous) point contamination, but also for diffuse and long-term scenar-ios.
2.2.2.2 Definition of the cube axes
The cube attempts to show graphically how a contaminant input in the system is transformed on its pathway from the origin to the target. Only the quantity of contaminants, which actually enters the system, is considered within the cube concept. However, in reality a significant por-tion may leave the system via surface runoff. Three basic criteria have been defined: transfer time, duration and concentration level. These criteria have to be specified for their use for in-trinsic vulnerability assessment. In the following sections, it is explained how the axes of the vulnerability cube are defined and how field observations can be plotted into this cube.
Theoretically, the transfer time and duration axes should be associated with the time of first arrival of a (conservative) contaminant and the whole pollution duration respectively. From a practical point of view, the actual time of first arrival and the end of the contamination are almost impossible to determine experimentally, as they depend on the detection limit or back-ground level of the respective contaminant. It is thus suggested to use adapted definitions pre-sented hereafter.
Fig. 5: Definition of the concentration limit as a percentage of the output maximum concentration
Pollution starting and ending times are associated with time flags for which the pollutant con-centration is equal to some arbitrary threshold concon-centration Cthresh. In order to keep the in-trinsic character of the definitions, this threshold concentration should be set equal to an arbi-trary percentage f of the maximum concentration % Cmax, observed at the target. The transfer time axis definition is associated with the first time t when C =C , while the duration
axis definition is associated with the difference between starting time tfirstand ending time
end
t . According to the value considered for f , the criteria of first arrival and duration are %
more ( 1 %
f ) or less ( 2 %
f ) severe (Fig. 5). Setting f to zero leads to the theoretical definition %
of pollution first arrival and whole duration.
Transfer times potentially range from zero (the pollution occurs directly at the target) to infin-ity (the pollutant never reaches the target). The pollution duration also ranges from zero (Di-rac-type arrival at the target) to infinity (continuous arrival). As we are mainly concerned by orders of magnitudes, logarithmically transformed axes are more convenient.
The intrinsic attenuation capacity of the aquifer is evaluated on the basis of a comparison between the maximum concentration observed at the target Cmax and the input concentration
0
C at the origin, providing an evaluation of the minimum attenuation capacity of the medium
affecting the contaminant during its transit in the underground. The natural reduction of con-centration is thus represented by the ratio between the maximum concon-centration at the target and the concentration at the origin:
0 max
* C C
C =
Concentrations are supposed to be relative to unit mass of contaminant. The relative concen-tration C* is non dimensional and varies between zero (corresponding to complete disappear-ance of the pollutant) and unity (absolutely no attenuation, leaving initial concentrations un-changed).
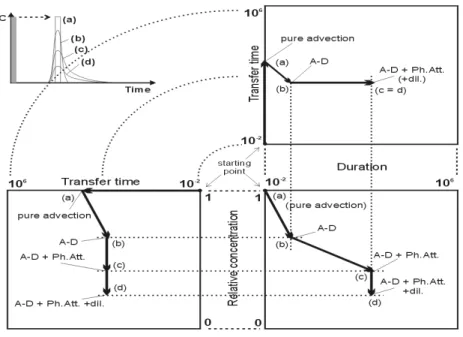
2.2.2.3 Entering and moving in the cube
For an instantaneous point pollution scenario, the “entry point” in the cube is the corner char-acterised by zero values for transfer time and duration (practically, a short duration) and a relative concentration of one, representing the contamination Dirac function. As the contami-nant evolves in the underground, it is affected by different intrinsic hydrodynamic and hydro-dispersive mechanisms, altering progressively its spatial and temporal distribution. The corre-sponding evolution can be tracked simultaneously in the cube.
The main intrinsic processes are the following: advection (pollutant displacement at the mean effective velocity of groundwater), hydrodynamic dispersion (contaminant spreading around the mean advective position), physical attenuation (e.g. dual porosity effects), dilution (lower-ing of concentration directly related to mix(lower-ing of different water fluxes) and recharge. All these mechanisms can be examined one by one, to highlight their consequences in terms of displacement in an opened-view of the cube (Fig. 6). For reasons of clarity, the respective in-fluence of the different hydrodispersive mechanisms are added one by one:
• If the pollutant moves by advection only, there is no lessening in concentration. This means that concentration and duration are not changed along the flow path. In that case, the displacement in the cube follows the transfer time axis, the final point corresponding to the advective transfer time between the hazard and the target (point a).
• Due to hydrodynamic dispersion, the contaminant plume reaches the target sooner than by pure advection, the maximum concentration being lower and the duration longer. Com-pared to pure advection, the displacement along the transfer time axis is decreased, associ-ated with a longer duration and a relative concentration less than unity (point b).
• Physical retardation is of kinetic nature and does not influence significantly the first arri-val of a contaminant (BROUYÈRE et al. 1999). Due to storage in the immobile or less