HAL Id: hal-03120070
https://hal.archives-ouvertes.fr/hal-03120070
Submitted on 25 Jan 2021
HAL is a multi-disciplinary open access
archive for the deposit and dissemination of
sci-entific research documents, whether they are
pub-lished or not. The documents may come from
teaching and research institutions in France or
abroad, or from public or private research centers.
L’archive ouverte pluridisciplinaire HAL, est
destinée au dépôt et à la diffusion de documents
scientifiques de niveau recherche, publiés ou non,
émanant des établissements d’enseignement et de
recherche français ou étrangers, des laboratoires
publics ou privés.
VERA: Virtual Environments Recording Attention
Victor Delvigne, Laurence Ris, Thierry Dutoit, Hazem Wannous,
Jean-Philippe Vandeborre
To cite this version:
Victor Delvigne, Laurence Ris, Thierry Dutoit, Hazem Wannous, Jean-Philippe Vandeborre.
VERA: Virtual Environments Recording Attention. IEEE 8th International Conference on
Seri-ous Games and Applications for Health (SeGAH 2020), Aug 2020, Vancouver (fully online), Canada.
�10.1109/SeGAH49190.2020.9201699�. �hal-03120070�
VERA: Virtual Environments Recording Attention
Victor Delvigne
ISIA Lab, Faculty of EngineeringUniversity of Mons Mons, Belgium IMT Lille Douai CRIStAL UMR CNRS 9189
Villeneuve d’Ascq, France [email protected]
Laurence Ris
Neuroscience Department Lab Faculty of Medicine and PharmacyUniversity of Mons Mons, Belgium
Thierry Dutoit
ISIA Lab Faculty of Engineering University of Mons Mons, BelgiumHazem Wannous, Jean-Philippe Vandeborre
IMT Lille DouaiCRIStAL UMR CNRS 9189 Villeneuve d’Ascq, France
Abstract—Children with Attention Deficit Hyperactivity Dis-order (ADHD), present different symptoms binding for everyday life, e.g. difficulty to be focused, impulsiveness, difficulty to regulate motor functions, etc. The most commonly prescribed treatment is the medication that can present side effects. Another solution is behavioural treatment that does not seem to present better results than medication for a higher cost. A novel method with growing interest is the use of neurofeedback (NF) to teach the patient to self-regulate symptoms by herself, through the visualisation of the brain activity in an understandable form. Moreover, virtual reality (VR) is a supportive environment for NF in the context of ADHD. However, before proceeding the NF, it is important to determine the features of the physiological signals corresponding to the symptoms’ appearance. We present here a novel framework based on the joint measurement of electroencephalogram (EEG) and sight direction by equipment that can be embedded in VR headset, the goals being to estimate attentional state. In parallel to the signal acquisition, attentional tasks are performed to label the physiological signals. Features have been extracted from the signals and machine learning (ML) models have been applied to retrieve the attentional state. Encouraging results have been provided from the pilot study with the ability to make the right classification in multiple scenarios. Moreover, a dataset with the labelled physiological signals is under development. It will help to have a better understanding of the mechanism behind ADHD symptoms.
Keywords—Virtual-Reality, Eye-tracking, Brain-Computer In-terface, Machine Learning
I. INTRODUCTION
Nowadays Attention Deficit Hyperactivity Disorder , ADHD, is one of the most prevalent mental disorder in childhood. According to Raman et al. 2018 [24], approx-imatively 5% of the children in the world are diagnosed via the DSM-V [1] but these figures may vary depending on the region (e.g. North-America presenting a prevalence
higher of 5.3% compared to UK [24]). Three subtypes have been defined by the DSM-V, depending on the symptoms encountered: predominantly inattentive (ADHD-I), hyperactive (ADHD-H) and combined (ADHD-C). Their distribution is not clearly defined, however, the ADHD-I and ADHD-C seem to be more represented, with a slightly higher representation of the inattentive subgroups in comparison with ADHD-H as explained by Willcutt 2012 [31]. Although the patients’ symptoms vary from one to another, all three subtypes present difficulties to plan, focus and inhibit perturbators. The degree of difficulty varies depending on the subgroup.
In everyday life, ADHD is characterized by several draw-backs that affect the patients’ life as explained by Caci et al. 2014 [9]: impairments in school, social life (with friends, classmates and parents), activities, etc. To reduce these symp-toms, different methods have been developed: 1) Medication by daily intake of methylphenidate, nevertheless in addition to the controversial aspects that medicalizing children involves, it is not effective for 20 to 30% of the patients according to Cueli et al. 2019 [11]; 2) Behavioural treatments to help the detection and reduction of the behaviours caused by the symptoms, but this method is more expensive and binding; 3) Neurofeedback (NF) a method consisting of a real-time representation of the brain activity (in an understandable form) to teach how to self-regulate specific brain functions, this method is already used for treatment of phobia (Zilverstand et al. 2015 [32]), Autistic Spectrum Disorder (Coben et al. 2010 [10]) or Anxiety (Schoneveld et al. 2016 [27]).
In parallel to the diagnosis, it is possible to measure the ADHD symptoms with assessments/tests, as explained by Blume et al. 2017 [8]. These can be classified into different categories:
• Questionnaires completed by specialists, teachers, parents
or even in some cases by the patient himself.
• Physiological tests evaluating the neurophysiological be-haviour trough specifics tasks.
• Physiological signal analysis providing insights on cerebral activity. The considered signals may be the following: Electroencephalography (EEG), functional near-infrared spectroscopy (fNIRS), Electromyography (EMG), eye-tracking, gaze direction, etc.
II. RELATED WORK
There are different types of neurophysiological tests de-pending on the information desired. For instance, Go/NoGo task where it is asked to the participant to answer as fast as possible to a target, e.g. an x appears on the screen, and respectively to inhibit the wrong stimuli (not corresponding to the target, an x in this case). This test aims to assess the ability of the patient to inhibit specific stimuli as described in Dillon and Pizzagali 2007 [12]. In the context of ADHD, it can also be interesting to design tests aiming to measure selective and sustained attention.
Alternatively, it has been proven that it is possible to classify ADHD/control participants by the measurement of specific physiological signals.
For the EEG, the spectral power of different frequency bands is often considered and especially the ratio between the θ (≈ 4 − 8 Hz) and β (≈ 12 − 30 Hz) bands during the resting state (as described by Lubar 1991 [20]). However, this choice is mainly used in different works aiming to diagnosis and/or treat ADHD. It has been shown in a meta-analysis of Arns et al. in 2013 [2], that not all the ADHD subgroups present an abnormal θ/β ratio. For this reason, other frequency bands have also been taken into account in this study.
Another type of signal that may be considered for ADHD symptoms assessment is the sight analysis during specific tasks. In Varela Casal et al. 2018 [30], it has been shown that gaze direction and eye vergence (i.e. focal property) can be considered as a biomarker for classifying ADHD from control participants. Besides, sight analysis has also been used in studies aiming to assess ADHD symptoms as shown in Garc´ıa-Baos et al. 2019 [15] and Tan et al. 2019 [28].
The last physiological signal presented is the head move-ment over time. It has been shown in Rizzo et al. 2006 [25] that participants with ADHD symptoms present a different motor activity, represented here by head movement.
Furthermore, there is a growing interest among the use of VR in different domains related to ADHD. Bashiri et al. 2017 [4] presents in a rewiew all the works including virtual environment and ADHD. In the context of ADHD assessment and diagnosis, different neurophysiological tasks may be used to measure patient attention. In various works, the use of VR consisted in the implementation of regular 2D test in a virtual environment, like Continuous Performance Test (CPT) as described in Eom et al. 2019 [13]. Pollak et al. 2009 [22] have made a comparison between CPT in VR environment and on two-dimension screen. It appears in
his work that VR provides a higher ecological validity for CPT (compared to 2D screen) and in a more appreciated environment. Moreover, virtual reality brings larger freedom for the environment definition with greater safety and more control for the distractors.
for the environment definition with greater safety and more The original methods that have been used for signal pro-cessing in research related to attention state estimation (for instance neurofeedback training for children with ADHD as presented in Bioullac 2019 [7]) follow the following steps:
• Pre-processing consisting mainly to remove the artefacts that may affect the EEG, e.g. eye movements/blinks, muscular movement or noise induce by the surrounding environment.
• Feature extraction consisting to create a feature
vec-tor representing the most relevant information from the signals. Different methods have been created depending on the considered characteristics: frequency bandwidths amplitude (by considering fixed boundaries or iAPF as in Bioullac et al. 2019 [7] and Bazanova et al. 2018 [3]); downsampled signals to study the signal’s shape; trans-formation in other subspace with Principal Component Analysis (PCA) or Riemannian Geometry transformation for instance [18]. All these methods can be also used jointly (larger feature vectors) or in series (making a PCA on the bandwidths amplitudes).
• Classification, i.e. in our case to know if the participant is focused or not. Different algorithms can be used to sepa-rate the feature vector in the function of their classes. The principal algorithms are the linear regressors, support-vectors machines (SVM) and na¨ıve/Gaussian classifier as explained in Lotte et al. 2018 [18]. However, during the last decades, the improvements of machine-learning (ML) algorithms and the democratization of the computational hardware (e.g. GPU, cloud-computing, etc) have lead to an increase of deep learning use [18].
III. METHODOLOGY
In the context of this work, VR environments have been designed. Their goal is to create a medium promoting atten-tion, controllable and safe. Nevertheless, these environments are not the first designed with this purpose (see Blume et al. 2017 [8]). The goal was to create environments with the highest emotional comfort. It is for this reason that no school environment has been created to avoid the possible fears related, as explained in Caci et al. 2014 [9].
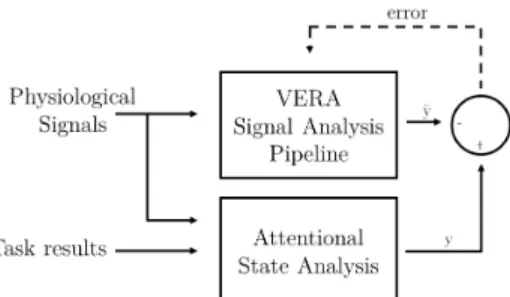
The framework steps are sketched in Fig. 2 and described in details below.
A. Environments
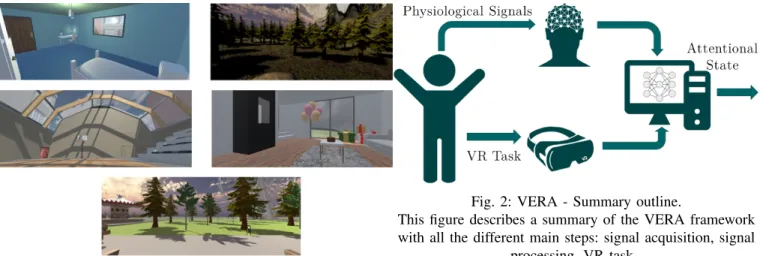
The framework is composed of five different environments promoting attention. The choice of creating different envi-ronments is to allow the participant to choose the place he feels the most comfortable in. These five environments are representing lifespan scenes of a current child: sport session in a gym hall; rest in a bedroom; walk in the forest; birthday party
Fig. 1: VERA - Virtual Environments.
This figure describes the different VR environments that have been developed in the VERA (Virtual Environment Recording Attention) study. Each of these environments
describes lifespan scene of a current child.
in a living room and a trip to an amusement park. For each scene, three different stimuli can appear in predefined mo-ments. To measure the effectiveness of the visual, auditive and combined perturbation on the physiological measurements, one stimulus of each type was considered as presented in Table I. All the perturbators are linked with the considered environment, e.g. the basketballs in the gym hall or the squirrels in the forest.
Auditory Visual Audio-Visual Bedroom Knocking door Blinking Light Cars passing Gym Hall Fridge On/Off Ball falling Birds flying on roof Forest Bird singing Butterfly Squirrel running Birthday Fire cracking Cat Box falling Amusement Carousel Balloon Dog running
TABLE I: Stimuli for each VR Environment. Each of the five environments described above are repre-sented in Fig. 1.
B. Physiological measurements
As explained earlier, it is possible to assess the ADHD symptoms and the attentional state from physiological signals. In this context, it has been decided to build a dataset composed of:
• Electroencephalography (EEG) recording the brain
elec-trical activity. The EEG recorder and VR game are synchronised through annotation at the beginning/end of each task (cf. C) and at each stimulus/perturbator appearance.
• Gaze information, i.e. pupils size, blinking instants and sight direction.
• Head movement from the accelerometer and gyroscope placed in VR headset.
It is important to note that the sight direction will be recorded two times: after a preprocessing step to determine
Fig. 2: VERA - Summary outline.
This figure describes a summary of the VERA framework with all the different main steps: signal acquisition, signal
processing, VR task.
the score of the tasks in virtual reality (see subsection C. VR tasks); and also in a raw format to do signal classification. C. VR tasks
To record information about the participant attention abili-ties, three cognitive tasks have been designed in VR environ-ments.
The first task corresponds to relaxation, it is asked to the participant to relax without moving. During this step, the EEG baseline can be recorded which allows computing specific EEG features. For instance, it is possible to compute the individual frequency band limits for each patient (e.g. α, β, θ bands limits) with Individual alpha peak frequency (IAPF). As described in Bazanova and Aftanas 2010 [6], if we compute the power spectral density of the signals with eye-closed and opened, we are able to compute the frequency boundaries of the α band, and therefore the lower (resp. upper) limit of the β (resp. θ) band. It is explained by the fact that EEG frequency spectrum is respectively composed of the θ, α and β bands, in that order. Moreover, as described in the study, wrong frequency bands definition lead to wrong signals classification. In parallel to these baseline measurements, perturbators appear at the end of the task, the goal being to detect the loss of attention on the EEG. However, to avoid an alert status (the state during which the participant is waiting for stimuli), these perturbators will only be displayed once at the end of the first task.
The second task aims to measure selective attention. This cognitive assessment represents the capacity of a subject to remain focused on a specific task during a certain time while inhibiting the external perturbators. The second and third tasks have been especially designed for this study by specialists [?]. During this task, two stimuli appear (the target and the perturbator) at a random position in the participant field of view. At each appearance, it is asked to the participant to look at the direction of the target as fast as possible without moving the head. The interstimulus interval (ISI) is following a random distribution of 3000 ms mean and with a standard deviation of 250 ms, i.e. ISI ∈ [3000 − 250; 3000 + 250]ms. The appearance time, i.e. the time during which the stimuli
are visible, is equal to 2500 ms (slightly below to avoid stimuli multi-appearance). By the means of eye-tracker, it is possible to measure the time during which the stimuli have been watched. Each stimulus is considered as watched if the eyes have looked in that direction during at least 50% of its appearance time. The score and the stimuli’s looking duration is continuously computed to make further analysis after the task completion.
The third task aims to measure sustained attention that represents the faculty to focus on a redundant task after a certain amount of time according to Oken et al. 2006 [21]. An example of a task, as described in Blume et al. 2017 [8]], is the CPT which consists in a test where it is requested to answer as fast as possible to a stimulus, e.g. appearance of an X on the screen. It is important to note that to measure sustained attention, no perturbators can appear. Moreover, to stay out of the alertness the interstimulus time has to remain short [13]. During this task, the ISI follows a random distribution of 3000 ms mean and with a standard deviation of 500 ms,i.e. ISI ∈ [3000 − 500; 3000 + 500]ms. The stimuli appearance time is equal to 2500 ms to avoid the multiple stimuli appearance. As in the second task, the stimuli are appearing in a random position in the participant field of view. The score is computed by measuring the time taken to look at the stimuli, this measurement is made through the whole task. As explained earlier, EEG, sight direction and head move-ment are also measured every 200 ms in parallel of these three tasks. After the three tasks, different data have been registered:
• Results of the second and third tasks as explained above. • Raw EEG with annotations at specifics moments, i.e.
begin/end tasks and appearance of stimuli.
• Eye-tracking information (the direction where the
partic-ipant looked at), pupils’ size and eye blinking.
• Head position and orientation.
Moreover, as for the first task, the stimuli appearing during the second and third tasks are linked with the environment (e.g. balloon at a birthday, basket-ball during sport activities).
In addition to the accomplishment of the tasks, neurophys-iological tests aiming to assess attention are also proceeded by specialists (CiPsE [?]), as Conners Continous Performance Tests (CPT) and Go/NoGo as mentioned in Blume et al. 2017. These tests aim to validate the insights provided by the VR task results.
D. Signal Analysis
To extract information from biological signals, various methods have been developed, however, most of them follow a similar pipeline as explained in Lotte 2014 [19]. In this work, two different approaches will be considered to estimate the attentional state from the participant with ADHD. The first one aims to reproduce the results from previous works and the second to improve these results.
In this work, it was planned to use the full information provided by the different devices: EEG, eye-information (sight direction, pupils diameter and blinking time) and head posi-tion. The signal analysis framework dedicated to this study
Fig. 3: Training Loop for the VERA Signal Analysis pipeline.
is presented in Fig. 3. The actual attentional state is first extracted from the results of the VR tasks presented above. The knwoledge from eye-tracker is then added. This step has been added to verify the actual attention state of the participant to avoid the possible error induced by particular scenarios in VR Tasks, e.g. the target too close to the perturbators.
For the implementation of our method, the signal analysis pipeline had to be adjusted due to the addition to physiologi-cal signals to EEG. Moreover, novel interesting approaches have to be considered, like the transformation of spectral information from EEG into images presented in Bashivan et al. 2016 [5]. The goal is to develop a ML-based model aiming to estimate the attentional state with only knowledge of physiological signals (without the results of the tasks) to have a better understanding of the attention mechanism in the brain. It is important to note that Fig. 3 presents only the training step of the VERA signal analysis pipeline, during the validation, the classes y being not known.
In parallel, as explained by Lotte et al. 2018 [18] deep learning techniques being more and more used, innovative ML approach will be considered. Nevertherless, these novel algorithms present two drawbacks:
• The need of a large amount of data. In Roy et al. 2019
[26], the authors presented different similar approach with at least 150 minutes of EEG recording.
• The results uninterpretability induced by the “black box” algorithms can’t match with the medical community. However, different works have been considered to add interpretability layer into deep learning models. This method consists of the projection of a specific layer in another subspace called latent-space, aiming to see the results in a more interpretable way as presented in Tits et al. 2019 [29].
For these reasons, we have first considered the original method for the signal analysis before building more complex models.
IV. EXPERIMENTS
A. Hardware and software
The development has been made in C# in Unity for the virtual environments and in Python 3.7 for the signal process-ing, the system used is the HTC-Vive pro with Tobii eye-tracker included. All the source codes and the application
Fig. 4: Result of the 2nd task.
Plots showing the results of the second task (measuring selective attention) from VERA. The looking duration of the target, i.e right
stimulus, and the perturbator, i.e. wrong stimulus are respectively plotted in blue and orange. Moreover, the sharp fluctuation is shown in green and red, this last representing the attention gain and decay.
are available on Github (https://github.com/VDelv/VERA). The EEG acquisition has been made with the BrainVision actiCHamp Plus with 32 electrodes in the regular position proposed by BrainVision [23].
B. Results
After the implementation of the prototypes, several signal acquisitions have been made. During the pilot study a record of 30 minutes of the physiological signals (i.e. EEG, eye-tracking and head position) has been made. To compare the tasks’ results with the physiological signals, the signals have been proceeded through the Signal Analysis Pipeline presented in Fig. 3 to retrieve the attentional state.
After the denoising step made with MNE python library [16], the results of the tasks have been analyzed. For the second task, as explained above, the score is computed by mea-suring the time during which the stimulus has been watched: a duration prior to 50% of the target (resp. perturbator) total appearance corresponds to a success (resp. a failure) of the trial. By subtracting the perturbator watched time from the target and normalizing the result, as described in equation 1, it is possible to compute the score of the second task.
Score(t) = T imeT arget(t) − T imeP erturbator(t) kT imeT arget(t) − T imeP erturbator(t)k
(1) With T imeT arget(t) and T imeP erturbator(t), the looked
du-ration for the target and the perturbator in function of the time. It is possible to compute the variation of the score corresponding to its time derivative to identify the loss/gain of attention as seen in Fig. 4.
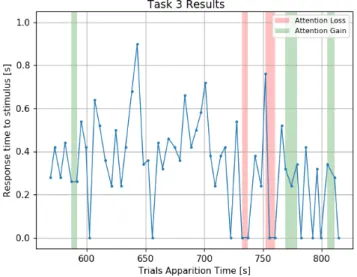
For the third task, the score corresponds to the amount of time taken to look at the target after normalization whose not
Fig. 5: Result of the 3rd task.
Plots showing the results of the third task (measuring sustained attention) from VERA. The looking duration of the target is plotted
in blue. Moreover, the sharp fluctuation is shown in green and red, this last representing the attention gain and decay.
looking to the target corresponding to a null value. Similarly, the gain and loss of attention may be computed and are represented in Fig. 5.
In parallel to the information provided by the task achieve-ment, an analysis of the signal from the VR-headset i.e. head linear and rotational position and eye information, has been completed. The linear and rotational instantaneous velocity of the head have been computed with the time derivative. Besides, the pupils‘size time derivative has also been computed. The physiological recording frequency has been set to 5 Hz. These parameters can be tuned.
Finally, the electroencephalography has been synchronised with the different temporal steps of the virtual environ-ment (task beginning/end, stimuli appearance). After the pre-processing, frequential information have been extracted from the EEG with power spectral density (PSD) and separate in different frequency bands: θ (≈ 4 − 8 Hz), α (≈ 8 − 15 Hz) and β (≈ 15 − 25 Hz), the exact bands limits varying from a patient to another. In addition to these features, the ratio between the theta and beta bands has also been computed. The PSD has been computed with windows of 3 seconds and overlaps of 0.2 seconds.
After this step, a feature vector is created for each attentional task trial. Each of these vectors is composed of different components:
• Head linear velocity.
• Head rotational velocity.
• Alpha band amplitudes.
• Beta band amplitudes.
• Theta band amplitudes.
• Theta/Beta bands amplitudes ratio.
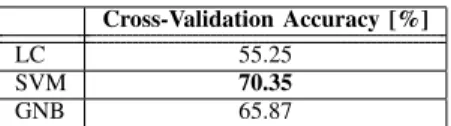
com-posed by the signals mentioned above. To classify the signals in the function of the attention state, different algorithms have been trained with the features vectors described above. Eeach vector corresponding to an attentional state, i.e. At-tentive/NotAttentive. To evaluate the ability of a classifier to estimate the class from the feature vector, three classifiers have been trained on the first set of signal from one patient. The considered classifiers are simple ML algorithms mainly used in biomedical application of machine learning [19]: Linear Classifier (LC), Support Vector Machine (SVM) and Gaussian Na¨ıve Bayes Classifier (GNB). The physiological signals have been separated in the different tasks (relaxation, selective attention and sustained attention) for a total length of 15 minutes. All the feature have been extracted, separated into windows of 2.5 seconds and assigned to a class. The three simple algorithms have been trained on this dataset and then evaluated by computing the cross-validation accuracy for the classification. This accuracy is presented in Table II.
As seen in Table II, although the models can estimate the attentional seven times out of ten, the results for ML models can still be improved. For this purpose, different approach may be considered. Moreover, it can be interesting to consider features used in other BCI as downsample signal (that are mainly used for detecting a specific temporal pattern in EEG), like fractal dimension as presented in Joadder et al. 2019 [17] or EEG entropy as presented in Eroglu et al. 2018 [14]. Another interesting approach to consider could be the used of deeper models as mentioned above, however, this method requiring a huge amount of data. It will be considered in future works when the dataset’s size will be sufficient.
V. CONCLUSION
In this work, we proposed an innovative framework aiming to assess attention in virtual reality environments. It aims to have better knowledge on the mechanisms behind attention and to be able to detect the loss and gain of attention from physiological signals, e.g. Electroencephalogram, eyes information (pupils size, saccade) or head-movement. The detector created could be used in further work to design neurofeedback for children with ADHD in virtual reality. Besides, to provide an emotionally comfortable environment by allowing the participant to make her choice, the framework presents encouraging results regarding the classification of states of attention. Three different machine learning-based classifiers have been tested on feature vectors built from the physiological signals and can predict well the attention state in many cases.
For the future works, a larger study will lead to an increase of the dataset that will allow us to try other classification
Cross-Validation Accuracy [%] LC 55.25
SVM 70.35 GNB 65.87
TABLE II: Cross-validation accuracy for ML algorithms.
methods. Moreover, it will also be possible to study a wider population to add personalisation features to the models.
For the next years, virtual reality combined with signal acquisition, as in the VERA framework, could be used for diagnosis, symptoms assessments and also as a help for the innovative treatment methods such as neurofeedback.
ACKNOWLEDGMENT
The authors would like to thank the research group of Cognitive Psychology and Neuropsychology of the Faculty of Psychology of the University of Mons for their helps in the definition of the attentional tasks. This colaboration has been made in the context of the CiPsE research centre [?].
REFERENCES
[1] American Psychiatric Association. Diagnostic and Statistical Manual of Mental Disorders. American Psychiatric Association, fifth edition edition, 2013.
[2] Martijn Arns, C. Keith Conners, and Helena C. Kraemer. A decade of EEG theta/beta ratio research in ADHD: a meta-analysis. 17(5):374– 383, 2013.
[3] Alexandre Barachant and Marco Congedo. A plug&play p300 BCI using information geometry. 2014. eprint: 1409.0107.
[4] Azadeh Bashiri, Marjan Ghazisaeedi, and Leila Shahmoradi. The opportunities of virtual reality in the rehabilitation of children with attention deficit hyperactivity disorder: a literature review. 60(11):337– 343, 2017.
[5] Pouya Bashivan, Irina Rish, Mohammed Yeasin, and Noel Codella. Learning representations from EEG with deep recurrent-convolutional neural networks. 2016. eprint: 1511.06448.
[6] O. M. Bazanova and L. I. Aftanas. Individual EEG alpha activity analysis for enhancement neurofeedback efficiency: Two case studies. 14(3):244–253, 2010.
[7] St´ephanie Bioulac, Diane Purper-Ouakil, Tomas Ros, Hilario Blasco-Fontecilla, Marie Prats, Louis Mayaud, and Daniel Brandeis. Personal-ized at-home neurofeedback compared with long-acting methylpheniyear in an european non-inferiority randomized trial in children with ADHD. 19(1):237, 2019.
[8] Friederike Blume, Justin Hudak, Thomas Dresler, Ann-Christine Ehlis, Jan K¨uhnhausen, Tobias J. Renner, and Caterina Gawrilow. NIRS-based neurofeedback training in a virtual reality classroom for children with attention-deficit/hyperactivity disorder: study protocol for a randomized controlled trial. 18(1):41, 2017.
[9] H. Caci, M. Doepfner, P. Asherson, R. Donfrancesco, S. V. Faraone, A. Hervas, and M. Fitzgerald. Daily life impairments associated with self-reported childhood/adolescent attention-deficit/hyperactivity disorder and experiences of diagnosis and treatment: results from the european lifetime impairment survey. 29(5):316–323, 2014.
[10] Robert Coben, Michael Linden, and Thomas E. Myers. Neurofeedback for autistic spectrum disorder: A review of the literature. 35(1):83, 2009. [11] Marisol Cueli, Celestino Rodr´ıguez, Paloma Cabaleiro, Trinidad Garc´ıa, and Paloma Gonz´alez-Castro. Differential efficacy of neurofeedback in children with ADHD presentations. 8(2), 2019.
[12] Daniel G. Dillon and Diego A. Pizzagalli. Inhibition of action, thought, and emotion: A selective neurobiological review. 12(3):99–114, 2007. [13] Hyojung Eom, Kwanguk (Kenny) Kim, Sungmi Lee, Yeon-Ju Hong,
Jiwoong Heo, Jae-Jin Kim, and Eunjoo Kim. Development of virtual reality continuous performance test utilizing social cues for children and adolescents with attention-deficit/hyperactivity disorder. 22(3):198–204, 2019. Publisher: Mary Ann Liebert, Inc., publishers.
[14] G. Ero˘glu, S. Aydın, M. C¸ etin, and S. Balcisoy. Improving cognitive functions of dyslexies using multi-sensory learning and EEG neurofeed-back. In 2018 26th Signal Processing and Communications Applications Conference (SIU), pages 1–4, 2018.
[15] Alba Garc´ıa-Baos, Tomas D’Amelio, Isadora Oliveira, Peter Collins, Carme Echevarria, Laura P´erez Zapata, Elizabeth Liddle, and Hans Sup`er. Novel interactive eye-tracking game for training attention in children with attention-deficit/hyperactivity disorsder. 21(4), 2019. [16] Alexandre Gramfort, Martin Luessi, Eric Larson, Denis A. Engemann,
Daniel Strohmeier, Christian Brodbeck, Roman Goj, Mainak Jas, Teon Brooks, Lauri Parkkonen, and Matti H¨am¨al¨ainen. MEG and EEG data analysis with MNE-python. 7, 2013. Publisher: Frontiers.
[17] Md. A. M. Joadder, S. Siuly, E. Kabir, H. Wang, and Y. Zhang. A new design of mental state classification for subject independent BCI systems. 40(5):297–305, 2019.
[18] F Lotte, L Bougrain, A Cichocki, M Clerc, M Congedo, A Rakotoma-monjy, and F Yger. A review of classification algorithms for EEG-based brain–computer interfaces: a 10 year upyear. 15(3):031005, 2018. Publisher: IOP Publishing.
[19] Fabien Lotte. A tutorial on EEG signal-processing techniques for mental-state recognition in brain–computer interfaces. In Eduardo Reck Miranda and Julien Castet, editors, Guide to Brain-Computer Music Interfacing, pages 133–161. Springer London, 2014.
[20] Joel F. Lubar. Discourse on the development of EEG diagnostics and biofeedback for attention-deficit/hyperactivity disorders. 16(3):201–225, 1991.
[21] B.S. Oken, M.C. Salinsky, and S.M. Elsas. Vigilance, alertness, or sustained attention: physiological basis and measurement. 117(9):1885– 1901, 2006.
[22] Yehuda Pollak, Patricia L. Weiss, Albert A. Rizzo, Merav Weizer, Liron Shriki, Ruth S. Shalev, and Varda Gross-Tsur. The utility of a continuous performance test embedded in virtual reality in measuring ADHD-related deficits. 30(1):2–6, 2009.
[23] Brain Products. acticap slim and acticap snap – the next generation active electrode system. Accessed 2020-03-10, https://www.brainproducts.com. [24] Sudha R Raman, Kenneth K C Man, Shahram Bahmanyar, Anick Berard, Scott Bilder, Takoua Boukhris, Greta Bushnell, Stephen Crystal, Kari Furu, Yea-Huei KaoYang, Øystein Karlstad, Helle Kieler, Kiyoshi Kubota, Edward Chia-Cheng Lai, Jaana E Martikainen, G´eric Maura, Nicholas Moore, Dolores Montero, Hidefumi Nakamura, Anke Neu-mann, Virginia Pate, Anton Potteg˚ard, Nicole L Pratt, Elizabeth E Roughead, Diego Macias Saint-Gerons, Til St¨urmer, Chien-Chou Su, Helga Zoega, Miriam C J M Sturkenbroom, Esther W Chan, David Coghill, Patrick Ip, and Ian C K Wong. Trends in attention-deficit hyperactivity disorder medication use: a retrospective observational study using population-based databases. 5(10):824–835, 2018. [25] Albert A. Rizzo, Todd Bowerly, J. Galen Buckwalter, Dean Klimchuk,
Roman Mitura, and Thomas D. Parsons. A virtual reality scenario for all seasons: The virtual classroom. 11(1):35–44, 2006.
[26] Yannick Roy, Hubert Banville, Isabela Albuquerque, Alexandre Gram-fort, Tiago H. Falk, and Jocelyn Faubert. Deep learning-based electroen-cephalography analysis: a systematic review. 16(5):051001, 2019. [27] Elke A. Schoneveld, Monique Malmberg, Anna Lichtwarck-Aschoff,
Geert P. Verheijen, Rutger C. M. E. Engels, and Isabela Granic. A neurofeedback video game (MindLight) to prevent anxiety in children: A randomized controlled trial. 63:321–333, 2016.
[28] Y. Tan, D. Zhu, H. Gao, T. Lin, H. Wu, S. Yeh, and T. Hsu. Virtual classroom: An ADHD assessment and diagnosis system based on virtual reality. In 2019 IEEE International Conference on Industrial Cyber Physical Systems (ICPS), pages 203–208, 2019.
[29] No´e Tits, Fengna Wang, Kevin El Haddad, Vincent Pagel, and Thierry Dutoit. Visualization and interpretation of latent spaces for controlling expressive speech synthesis through audio analysis. 2019. eprint: 1903.11570.
[30] Paloma Varela Casal, Flavia Lorena Esposito, Imanol Morata Mart´ınez, Alba Capdevila, Maria Sol´e Puig, N´uria de la Osa, Lourdes Ezpeleta, Alexandre Perera i Lluna, Stephen V. Faraone, Josep Antoni Ramos-Quiroga, Hans Sup`er, and Jose Ca˜nete. Clinical validation of eye vergence as an objective marker for diagnosis of ADHD in children. 23(6):599–614, 2019.
[31] Erik G. Willcutt. The prevalence of DSM-IV attention-deficit/hyperactivity disorder: a meta-analytic review. 9(3):490–499, 2012.
[32] Anna Zilverstand, Bettina Sorger, Pegah Sarkheil, and Rainer Goebel. fMRI neurofeedback facilitates anxiety regulation in females with spider phobia. 9, 2015. Publisher: Frontiers.