HAL Id: hal-02326743
https://hal.archives-ouvertes.fr/hal-02326743
Submitted on 23 Oct 2019HAL is a multi-disciplinary open access archive for the deposit and dissemination of sci-entific research documents, whether they are pub-lished or not. The documents may come from teaching and research institutions in France or abroad, or from public or private research centers.
L’archive ouverte pluridisciplinaire HAL, est destinée au dépôt et à la diffusion de documents scientifiques de niveau recherche, publiés ou non, émanant des établissements d’enseignement et de recherche français ou étrangers, des laboratoires publics ou privés.
Gaétan Sary, Laurent Garrigues, Jean-Pierre Boeuf
To cite this version:
Gaétan Sary, Laurent Garrigues, Jean-Pierre Boeuf. Hollow cathode modeling: II. Physical analy-sis and parametric study. Plasma Sources Science and Technology, IOP Publishing, 2017, 26 (5), pp.055008. �10.1088/1361-6595/aa6210�. �hal-02326743�
HOLLOW CATHODE MODELING:
II.
PHYSICAL ANALYSIS
AND PARAMETRIC STUDY
Gaétan Sary1,2, Laurent Garrigues1,2, and Jean-Pierre Boeuf1,2
1Université de Toulouse ; UPS, INPT ; LAPLACE (Laboratoire Plasma et Conversion d’Energie) ; 118 route de Narbonne, F-31062 Toulouse cedex 9, France.
2 CNRS ; LAPLACE ; F-31062 Toulouse, France.
E-mail: [email protected]
ABSTRACT
A numerical emissive hollow cathode model which couples plasma and thermal aspects of the NASA NSTAR cathode has been presented in a companion paper and simulation results obtained using the plasma model were compared to experimental data. We now compare simulation results with measurements using the full coupled model. Inside the cathode, the simulated plasma density profile agrees with the experimental data up to the ±50 % experimental uncertainty while the simulated emitter temperature differs from measurements by at most 5 . We then proceed to an analysis of the cathode discharge both inside the cathode where electron emission is dominant and outside in the near plume where electron transport instabilities are important. As observed previously in the literature, the total emitted electron current is much larger (34 ) than the set discharge current collected at the anode (13 ) while ionization plays a negligible role. Extracted electrons are emitted from a region much shorter than the full emitter (0.9 vs. 2.5 ). The influence of an applied axial magnetic field in the plume is also assessed and we observe that it leads to a 10-fold increase of the plasma density 1 cm downstream of the orifice entrance while the simulated discharge potential at the anode is increased from 10 up to 35.5 .
Lastly, we perform a parametric study on both the operating point (discharge current, mass flow rate) and design (inner radius) of the cathode. The simulated useful operating envelope is shown to be limited at low discharge current mostly because of the probable ion sputtering of the emitter and at high discharge current because of emitter evaporation, plasma oscillations and sputtering of the keeper electrode. The behavior of the cathode is also analyzed w.r.t. its internal radius and simulation results show that the useful emitter length scales linearly with the cathode radius.
3 4 5 6 7 8 9 10 11 12 13 14 15 16 17 18 19 20 21 22 23 24 25 26 27 28 29 30 31 32 33 34 35 36 37 38 39 40 41 42 43 44 45 46 47 48 49 50 51 52 53 54 55 56 57 58 59 60
INTRODUCTION
In a companion paper [1], we have presented a numerical model of the plasma inside and in the near plume of an emissive hollow cathode. Heat transfer in the structure of the hollow cathode is modelled as well, using a thermal model coupled to the plasma model through plasma bombardment and electron emission. The cathode model obtained is self-consistent and does not require in principle the input from experimental data to specify the emitter temperature for instance. Parameters relevant to the thermal model (thermal emissivities and conductivities) still need to be set for a given cathode. Ideally, this could be done based on the cathode design alone. However, as these thermal parameters are neither readily available in the literature for each part constitutive of the cathode nor easily determined experimentally for a given cathode design, these parameters were estimated so as to obtain the best possible agreement between experimental data and simulation results inside the cathode (see our companion paper [1] as well as section I.A below). The values obtained for the thermal parameters are realistic with regards to the materials used in the cathode design though [1]. The thermal parameters are left unchanged for the rest of this study.
In order to compare plasma simulation results with measurements, we have first set the emitter temperature to an experimentally measured profile and simulated the plasma in the associated operating point [1]. Inside the cathode, the discrepancy between the simulated and measured plasma density along the cathode axis (for the NASA NSTAR hollow cathode at its TH 15 operating point) is smaller than the ±50 % experimental error bars. In the cathode plume, the cathode model presented in [1], which focuses on hollow cathodes for Hall thrusters (HTs), does not include the applied axial magnetic field present in the experimental setup [2]. Therefore, the agreement between the simulated plasma density and potential and measurements in the plume remains at best qualitative. Even in absence of magnetic field, some qualitative differences between simulation results and experimental data remained and it was shown in the early cathode modeling literature [3,4] that accounting for the excitation of ion acoustic instabilities in the orifice and in the plume (through an anomalous collision frequency for electrons) may successfully reconcile simulation results with measurements in the plume. Definitive evidence for these instabilities was provided much later by Jorns et al. [5] who demonstrated experimentally the occurrence of ion acoustic instabilities in the plume of high-current hollow cathodes. Based on this success of numerical cathode models, we presented in our companion paper a self-consistent fluid model of the ion acoustic instability in the cathode plume [1,6] and described its influence on simulated time-averaged plasma density and potential profiles.
3 4 5 6 7 8 9 10 11 12 13 14 15 16 17 18 19 20 21 22 23 24 25 26 27 28 29 30 31 32 33 34 35 36 37 38 39 40 41 42 43 44 45 46 47 48 49 50 51 52 53 54 55 56 57 58 59 60
In this paper, we first compare simulation results obtained with the coupled plasma-thermal model with measurements for the NASA NSTAR TH 15 operating point ( = 13 and = 3.6 ). Then, we will present a physical analysis of the plasma inside the cathode and of the important mechanisms which drive the cathode behavior, and in particular its current and energy balance. Moving on to the plume of the cathode, we will describe the plume plasma and the occurrence and influence of ion acoustic instabilities in the model on both the plasma and macroscopic quantities related to the cathode performance such as the discharge potential. We will also briefly discuss the impact of an applied axial magnetic field on plasma simulation results. Last, thanks to the self-consistent character of the coupled plasma-thermal model, we will present a parametric study of the cathode behavior for various operating points and design choices. This will help us identify some useful trends which might facilitate the development of future hollow cathodes for high power HTs.
In this paper, notations from our companion paper will be used here directly without re-introducing them.
I.
EMITTER REGION
A. C
OUPLED PLASMA
-
HEAT TRANSFER SIMULATIONS
We compare in figure 1 the emitter temperature profile computed using the coupled model with measurements for the NSTAR cathode at a discharge current of = 13 and a xenon flow rate of = 3.6 . The current extracted from the keeper electrode is set to = 1.5 (see our companion paper [1], and the discussion below in section III.A.1). The simulated emitter temperature is in quantitative agreement with experimental data and differs from measurements by at most 5 over the whole emitter. Close to the emitter tip (located at abscissa 3 in fig. 1) we observe an abrupt variation of the gradient of the emitter temperature. However, no temperature measurements are available this close to the orifice plate [7] and therefore it is difficult to confirm simulation results there. The temperature profile in this short section has little influence on the plasma simulation though: as we will see below, the simulated plasma density for the coupled model remains very close to the plasma density profile simulated earlier when the emitter temperature profile was set (see fig. 1), even if the two temperature profiles diverge close to the emitter tip. The simulated temperature along the outer radial edge of the orifice plate varies spatially between 1377 and 1395 , whereas a temperature of 1365 was measured at roughly the same location [7].
3 4 5 6 7 8 9 10 11 12 13 14 15 16 17 18 19 20 21 22 23 24 25 26 27 28 29 30 31 32 33 34 35 36 37 38 39 40 41 42 43 44 45 46 47 48 49 50 51 52 53 54 55 56 57 58 59 60
We observed in simulations that the thermal surface conductance between the emitter and the tube (set here to = 800 . . , see our companion paper [1]) has a strong impact on both the temperature distribution and the peak temperature reached: the simulated emitter temperature profile (see fig. 1) becomes more spatially “linear” when is increased and the local maximum of the emitter temperature close to the emitter tip is reduced. When = 2400 . . , the peak emitter decreases by 15 (w.r.t to the profile shown in fig. 1) whereas if we assume a perfect conductivity, the temperature profile becomes linear and ranges from 1268 to 1427 . The decrease of the emitter temperature when is increased was expected since the emitter becomes less well thermally insulated and loses more heat to the cathode tube. Lastly, we note that the parameter is difficult to quantify experimentally and the lack of a predetermined value (i.e. not obtained through model tuning to experimental data) is clearly a weakness of the thermal model used here.
Figure 1: Simulated emitter temperature distribution (coupled model) and measurements taken from [7] for the NSTAR cathode running at the 15 operating point ( = 13 and = 3.6 ). The emitter temperature profile used earlier in our companion paper [1] for uncoupled plasma simulations is plotted here for comparison. The emitter spans from abscissa
0.5 to 3 and the orifice entrance is located in the 3 plane.
A comparison between the simulated plasma density profile along the cathode axis in the coupled model and experimental data is shown in figure 2 (a). The plasma density profile simulated in our companion paper [1] for a set emitter profile is also plotted here for comparison. Since the simulated emitter temperature was very close to the profile prescribed earlier (see fig. 1), it is only natural for plasma density simulations done here to reproduce earlier results almost identically. This is clearly seen in fig. 2 (a) for the plasma density as well as in fig. 2 (b) for the plasma potential. However, thanks to the coupled model, we now know that the simulated plasma distribution is consistent with the thermal fluxes necessary to maintain the emitter temperature profile. This further justifies the consistency of our cathode model. As expected, the disagreement between the simulated plasma density in the plume (fig. 2 (a)) and measurements remains unchanged. The same remark is true for the
3 4 5 6 7 8 9 10 11 12 13 14 15 16 17 18 19 20 21 22 23 24 25 26 27 28 29 30 31 32 33 34 35 36 37 38 39 40 41 42 43 44 45 46 47 48 49 50 51 52 53 54 55 56 57 58 59 60
plasma potential (fig. 2 (b)), in particular inside the cathode where the discrepancy between simulation results and measurement is the most striking (see our companion paper [1] for a discussion of this issue).
(a) (b)
Figure 2: Simulated plasma density (a) and plasma potential (b) in the coupled model along the axis of the NSTAR cathode running at the 15 operating point ( = 13 and = 3.6 ) and comparison with experimental data [2] and with
the profiles simulated in our companion paper [1] assuming a set emitter temperature.
B. I
NTERNAL PLASMA
The plasma in the interior region of hollow cathodes has been analyzed in numerous earlier works [4,7,8]. We briefly present some of the important features of the internal plasma shown by our model in the NSTAR cathode, and underline the role of electron emission at the walls. The coupled plasma-thermal model is used for these simulations and the ion acoustic is described in the plume with = 0.3 × 10 . We account for the porosity of the emitter with = 2. See our companion paper [1] for a description of these parameters.
The simulated plasma and neutral density profiles are shown in fig. 3 and are overlaid with ion and neutral streamlines.
Figure 3: Simulated plasma density and neutral density inside the NSTAR cathode at the TH 15 operating point ( = 13 and = 3.6 ). Ion and neutral density profiles are overlaid respectively with ion and neutral flow streamlines.
Dimensions are in cm. 3 4 5 6 7 8 9 10 11 12 13 14 15 16 17 18 19 20 21 22 23 24 25 26 27 28 29 30 31 32 33 34 35 36 37 38 39 40 41 42 43 44 45 46 47 48 49 50 51 52 53 54 55 56 57 58 59 60
The xenon inlet is located to the left in fig. 3 (see also the description of the simulation domain in our companion paper [1]) and we represent here in this section only a small portion of the simulation domain focused on the interior region: the true inlet boundary is located upstream at abscissa 0 and the domain extends in the plume up to abscissa 5.5 . Since the simulation domain is 2D-axisymetric, only one half of a longitudinal cut of the cathode is represented. The electron emitter, which is 2.5 long, covers the entire outer radius of the interior region of the cathode in fig. 3.We mentioned in our companion paper [1] that accounting for the ion acoustic instability in the plume leads to a non-stationary behavior of the cathode (see also below in section II). Simulated quantities inside the cathode remain nearly stationary though, since plasma conditions are not favorable to the growth of the instability there.
We observe in fig. 3 that the plasma is located in a narrow region, approximately half a cm long, close to the orifice. The maximum simulated plasma density is 1.41 × 10 . This behavior is in agreement with experimental measurements (see fig. 2) and earlier studies about this cathode published in the literature [8,9]. Neutral xenon flows unperturbed from the inlet upstream down to abscissa 2.2 and is mainly pressure driven in the upstream region (not shown on this figure). The simulated static neutral pressure at the inlet is 962 , and it is almost constant over most of the cathode: it is still as high as 930 at abscissa 2.5 and starts to decrease sharply only downstream of this section. At abscissa 3 , the simulated neutral gas pressure is approximately 490 . In the dense plasma region, some neutral streamlines seem to emerge from the wall (fig. 3) since ions that fall through the plasma sheaths are recombined there and return to the interior region as neutrals. Ionizing collisions between electrons and neutrals occur mostly in the vicinity of the orifice because of the elevated electron temperature there (see below). The resulting ions are headed both upstream where they fall in the electric field towards the walls and downstream towards the plume thanks mainly to the drag caused by collisions with electrons (since the electron current is intense in this region, locally as high as 2 × 10 . ) which allows ions to flow opposite to the electric field (fig. 3). An analog behavior was observed for the cathode investigated in [10], although that cathode ran at lower discharge current and had a smaller orifice which led in that case to the dominance of neutral drag over electron drag on ions. Downstream of the orifice, ions fall towards the orifice plate and the keeper (this is only partly visible in fig. 3).
The plasma potential profile, electron current lines (on top of the potential profile) and electron temperature profile are shown in fig. 4.
3 4 5 6 7 8 9 10 11 12 13 14 15 16 17 18 19 20 21 22 23 24 25 26 27 28 29 30 31 32 33 34 35 36 37 38 39 40 41 42 43 44 45 46 47 48 49 50 51 52 53 54 55 56 57 58 59 60
Figure 4: Simulated plasma potential and electron temperature inside the NSTAR cathode at the TH 15 operating point ( = 13 and = 3.6 ). The plasma potential profile is overlaid with electron current lines. Dimensions are in cm.
The plasma potential rises from the gas inlet upstream towards the orifice so as to extract electrons, where the simulated potential is 11 . This corresponds to a potential drop on the order of 7 in the interior region between the orifice and the emissive sheath at the location where the emission is the most intense, roughly at the abscissa 2.7 in fig. 4 (see the next section). Current lines associated with electrons extracted from the cathode (i.e. current lines that cross the orifice) intersect a short 0.9 long region of the emitter close to the orifice (whereas the emitter itself is 2.5 long). Thus, the truly “useful” region of the emitter is much shorter than its full physical length. This observation will be discussed several times in this paper. Further upstream, some electron current lines have both ends attached to the emitter. Physically, this shows that some regions of the emitter collect more electrons than they emit. A similar behavior was already mentioned in the literature [8] although the occurrence of electron collecting patches on the emitter was less obvious, and the “lost” electron current lines closed themselves mostly on the non-emissive wall adjacent to the emitter. We will see in the next section that the emissive sheath model described in our companion paper [1] enables us to describe smoothly the transition between truly emissive and electron collecting regions of the emitter.
The electron fluid loses part of its drift energy and converts it to heat in collisions with ions and neutrals. Hence, the electron temperature is the highest in the orifice section where the current density is the largest and resistive heating is the most important. Ions produced in volume in the cathode come mainly from this region.
Temperature distributions of the heavy species inside the cathode are shown in fig. 5:
3 4 5 6 7 8 9 10 11 12 13 14 15 16 17 18 19 20 21 22 23 24 25 26 27 28 29 30 31 32 33 34 35 36 37 38 39 40 41 42 43 44 45 46 47 48 49 50 51 52 53 54 55 56 57 58 59 60
Figure 5: Simulated heavy species temperature distributions inside the NSTAR cathode at the TH 15 operating point ( =
13 and = 3.6 ).
Neutrals are the hottest at the orifice entrance (seen from the inside of the cathode) and their maximum temperature reach 3100 . The maximum ion temperature is 3200 and is obtained in a slightly more diffuse region, two upstream. While the simulated peak neutral temperature is close to the value obtained earlier in the literature for the NSTAR cathode [9], temperature distributions differ: the neutral temperature distributions peaks in the orifice section in our simulations, while in the literature the peak is obtained at abscissa 2.9 (using axis of fig. 5). Upstream, the neutral temperature gradient is almost aligned with the cathode axis, and at the inlet boundary (not shown in fig. 5), the simulated neutral temperature is 1050 . This relatively hot temperature (especially when compared with the ion temperature, see fig. 5) is linked with our inlet boundary condition (see our companion paper [1]) which specifies that the temperature of neutrals fed into the cathode is set to that of the adjacent wall (obtained from the thermal model). On the contrary, as no ions are injected at the inlet, this species cools down as it expands upstream into the less dense plasma region.
Although the peak temperatures of neutrals and ions are close, these species are not in thermal equilibrium (as clearly visible in fig. 5): while the collision frequencies between ions and electrons on the one hand and neutrals and electrons on the other hand are on the order of 10 in the dense plasma region, the collision frequency between ions and neutrals is on the order of 10 . Even if the mass ratio between the colliding species is more favorable to energy exchange between ions and neutrals (see our companion paper [1]), these collisions are not frequent enough to thermalize these species and both ions and neutrals remain predominantly heated by collisions with electrons. The same ordering of collision frequencies was obtained in the dense plasma region for the 25 discharge current cathode described in [4].
C. C
URRENT AND ENERGY BALANCE
3 4 5 6 7 8 9 10 11 12 13 14 15 16 17 18 19 20 21 22 23 24 25 26 27 28 29 30 31 32 33 34 35 36 37 38 39 40 41 42 43 44 45 46 47 48 49 50 51 52 53 54 55 56 57 58 59 60
At the operating point studied here, 13 of electron current is extracted at the anode (as well as 1.5 at the keeper electrode). The electron current “produced” by the cathode comes predominantly from thermionic emission at the wall (34.2 ) whereas ionization of the xenon in volume plays a less important role (equivalent to about 2.7 of both electron and ion current). From the equivalent total electron current, 23.9 are lost to the metallic parts of the cathode (keeper included). Ions produced in volume are lost in the plasma sheaths and recombined. At this operating point, over 90 % of the total electron current stems from thermionic emission. A similar current balance was already described in the literature for this cathode in [8]. This does not mean however that ionization is completely unnecessary: indeed, ions are needed to maintain the quasi-neutrality inside the cathode and to increase the plasma density so as to avoid a regime where the electron current would be space charge limited. If the totality of the injected xenon (3.6 ) were ionized (a single time), we would obtain an equivalent current produced through ionization close to 0.26 . Since the collected ion current at the walls is much higher (2.7 ), this means that neutrals are ionized and recombined a large number of times before leaving the cathode. Therefore, despite the large thermionic emission current, ionization in volume is still needed in this cathode, although not for the purpose of electron multiplication.
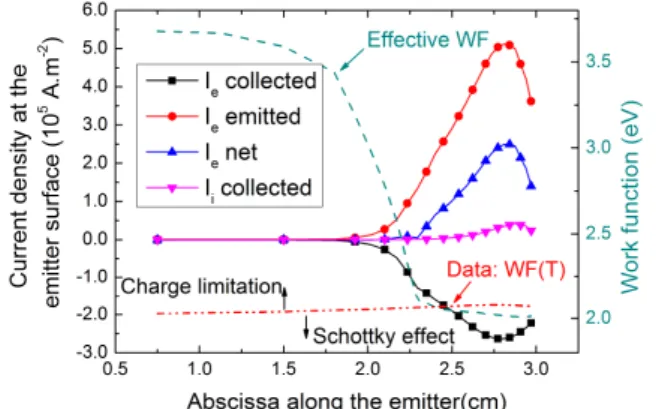
The ion and electron current densities at the surface of the emitter (along the unitary normal oriented from the plasma towards the emitter) are shown in fig. 6. The electron and ion current are defined respectively by = − and = , hence the current density for emitted electrons and collected ions are positive, while it is negative for collected electrons. The computed effective work function (which takes into account the Schottky effect and space charge limitation effects) is also plotted in fig. 6, along with the work function computed from its dependence on the emitter temperature alone.
The most emissive region is located close to the orifice (see fig. 6) in front of the dense plasma region described earlier (fig. 3). The maximum simulated emission current density reaches 5 × 10 . (this is two times less than in simulations in [8]), although it is worth mentioning that we assumed a porous emitter with a true emissive surface two times larger ( = 2) than the geometrical surface. Therefore, the emitted current density in this case from a microscopic element would be closer to 2.5 × 10 . . Even if a large electron current is emitted from this region, the collected electron current density is very high as well 2.6 × 10 . . This is easily explained by the high plasma density at the sheath boundary (2 × 10 ) and the low sheath potential (at most 5.7 ) relatively to the electron temperature (1.6 ) in this region. Compared to electrons, few ions are collected, and the maximum ion current density is at most 0.4 × 10 . .
3 4 5 6 7 8 9 10 11 12 13 14 15 16 17 18 19 20 21 22 23 24 25 26 27 28 29 30 31 32 33 34 35 36 37 38 39 40 41 42 43 44 45 46 47 48 49 50 51 52 53 54 55 56 57 58 59 60
We note in fig. 6 that the strongly emissive region coincides with the “useful” region of the cathode described earlier based on the extracted electron current lines (see fig. 4). Upstream, the emitted current density decreases sharply while the effective work function increases well above the value expected from its dependence on the emitter temperature alone (compare the curves “effective WF” and “Data: WF(T)” in fig. 6). Since the emission current density is proportional to exp (− / ) where is the effective work function and the wall temperature (see our companion paper [1]), emission is strongly inhibited at abscissas lower than 2.2 . Physically, the low emission current is explained by the insufficient plasma density deep inside the cathode (see fig. 3) which leads to a space charge limited sheath. On the contrary, in the dense plasma region (at abscissa 2.7 in fig. 6), the effective work function is lowered thanks to the Schottky effect by approximately 0.08 . Once again, the transition between the two regions where the plasma has either a positive influence (Schottky effect) or is insufficiently dense (space charge limitation) occurs approximately 0.7 upstream of the orifice (abscissa 2.3 in fig. 6). The ability to describe smoothly the transition between these two regimes on a physical basis is an illustration of the generality of the emissive sheath model described in our companion paper [1].
Figure 6: Current density at the surface of the emitter along the normal leaving the plasma domain towards the emitter. The effective work function (WF) (see our companion paper [1]) is also plotted, as well as the dependence of the emitter work function solely on the emitter temperature (WF(T)), using the simulated temperature distribution, fig. 1 and the dependence
of the WF on the temperature (see our companion paper [1]).
Intense energy fluxes are associated with the particle fluxes to and from the emitter. Macroscopically, the emitter spends 79.1 of thermal energy to thermionic emission, while it recovers 95.5 and 23.4 respectively through electron and ion bombardment on its surface. When summed over all surfaces of the cathode (anode excluded), the energy flux carried by electrons is slightly larger and evaluates to 116.6 . We see here that the energy balance is positive for the emitter: even if we consider energy fluxes directly incident on the emitter, we obtain: −79.1 + 95.5 + 23.4 = 39.8 . This heat flux is then dissipated partly at the radiative boundaries of the
3 4 5 6 7 8 9 10 11 12 13 14 15 16 17 18 19 20 21 22 23 24 25 26 27 28 29 30 31 32 33 34 35 36 37 38 39 40 41 42 43 44 45 46 47 48 49 50 51 52 53 54 55 56 57 58 59 60
cathode and mostly through heat conduction towards the cathode mount (where the temperature is set to 300 , see the description of the thermal model in [1]).
We observe that the thermal energy gained by the emitter comes mostly from electron bombardment, as noted earlier in [8]. Even if some emitted electrons are lost in the process, such a behavior of the cathode is actually beneficial to its life duration: if the cathode were predominantly heated by ion bombardment, the ensuing sputtering of the emitter might lead to its premature degradation.
It is worth mentioning that the energy gain for the emitter does not come for free: if we consider an electron consecutively emitted towards the plasma (the plasma electrons being at temperature ) and collected back at the wall after having thermalized with the electron fluid, it results in a net energy flux incident on the emitter equal on average to 2 (see the sheath model in [1]). At the same time, this energy gain for the emitter is an energy loss for the plasma, which is compensated by resistive heating in the volume thanks to the applied discharge potential.
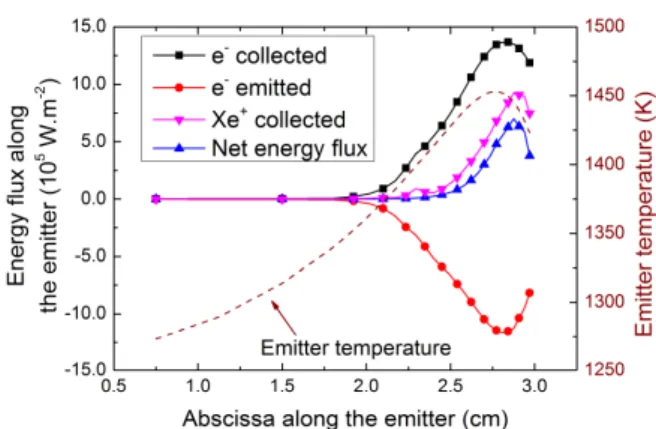
Lastly, we plot in fig. 7 the energy flux densities incident on the surface of the emitter, along with the emitter temperature.
Figure 7: Energy fluxes at the emitter surface along the unitary normal oriented from the plasma towards the emitter. Fluxes represented are caused by the plasma bombardment (energy gain, positive in the figure) and electron emission (energy loss,
negative in the figure). The computed emitter temperature is plotted as well.
Although the collected ion current at the emitter is quite weak relative to the collected electron current (see fig. 6), the associated energy flux is not negligible, thanks to the kinetic energy gain in the sheath as well as the ionization energy potential released during recombination. Locally, the thermal energy gained by the emitter through plasma bombardment is comparable for both electrons and ions, and reaches as high as 1 × 10 . . Globally, the largest part of the thermal energy gained by the emitter comes from electron bombardment though.
3 4 5 6 7 8 9 10 11 12 13 14 15 16 17 18 19 20 21 22 23 24 25 26 27 28 29 30 31 32 33 34 35 36 37 38 39 40 41 42 43 44 45 46 47 48 49 50 51 52 53 54 55 56 57 58 59 60
We also see in fig. 7 that the energy balance is positive all along the emitter, and the net energy flux density carried to the emitter is the largest where the emitter is the hottest. This does not mean that a local energy balance would be sufficient to describe the temperature distribution of the emitter though. Indeed, even if this is not obvious from the simulation results shown here, maintaining the peaked emitter temperature profile shown in fig. 7 requires heat conduction from the orifice plate downstream to the emitter. The importance of plasma bombardment of the orifice plate and of its thermal insulation in the global thermal balance of the cathode was already recognized in [7].
II. CATHODE PLUME
A. PLUME PLASMA AND ELECTRON CURRENT TRANSPORT
In the plume, the plasma density sharply decreases as the plasma expands in vacuum. We have shown in our companion paper [1] that including a qualitative model of the ion acoustic instability in the plume leads to an increase of the simulated plasma density along the cathode axis w.r.t. quasi-neutral fluid simulations that consider only “classical” collision frequencies. The plasma potential in the plume and the discharge potential are increased as well since the excitation of the ion acoustic instability leads to an increase of the effective electron collision frequency [1]. The same conclusion was reached in previous work by Mikellides et al. [3] using a macroscopic model of the anomalous collision frequency in the cathode plume based on the well-known scaling by Sagdeev & Galeev of ion acoustic turbulent energy density with electron to ion temperature ratio and electron Mach number [11]. Once again, we stress that the simulations results presented so far do not include any applied magnetic field. This will be discussed in the next section. However, it remains interesting to understand the conditions of occurrence of instabilities in absence of magnetic field, as this configuration is of practical interest for HTs.
As a result of the ion acoustic instability in the plume, the discharge potential at the anode oscillates between approximately 16 and 30 . The simulated mean potential value is 18.6 and the standard deviation 4.3 . The simulated time series of the discharge potential (not shown here) exhibit oscillations in mainly two ranges of frequency: low amplitude oscillations (a few volts) at 25 to 50 and large amplitude oscillations (over ten volts) at frequencies on the order of 1 . As we will see below, these oscillations grow in the keeper orifice region and then propagate towards the anode.
3 4 5 6 7 8 9 10 11 12 13 14 15 16 17 18 19 20 21 22 23 24 25 26 27 28 29 30 31 32 33 34 35 36 37 38 39 40 41 42 43 44 45 46 47 48 49 50 51 52 53 54 55 56 57 58 59 60
A similar oscillatory behavior was observed experimentally in [2] (with an applied magnetic field), yet the spectral characteristics of the oscillations simulated here do not fully match measurements: oscillations in similar frequency ranges are observed experimentally in the plasma, especially near the keeper exit, but in measurements, the largest amplitude oscillations occur in the low frequency range [2], in contrast with our simulation results.
Several aspects of the numerical model might explain these discrepancies,such as the poor applicability of fluid plasma equations in the plume. Indeed, as the plasma expands in the vacuum outside the cathode, intra-species collisions become less frequent and mean free-paths become large with respect to the characteristic size of the domain: using the simulated ion temperature in the plume (on the order of 500 to 1000 ), along with the expression for the Coulomb ion-ion collision frequency from Ref. [12], we estimate in the plume ≈ 10 . The ion thermal velocity evaluates to 350 . and we obtain a mean free path for ion-ion collisions larger than a few tenths of mm. As this non negligible with respect to the characteristic size of the orifice for instance, kinetic effects may become relevant and might modify the low frequency response of the plasma density to electric field fluctuations associated with the instabilities. Experimentally, kinetic effects show up notably in the radial velocity distribution for ions in the plume (see [2]) which exhibits a high velocity tail in the NSTAR cathode. This tail most certainly created by ion acoustic instabilities in the plume (as pointed out in [2]) but the distribution would relax to a maxwellian shape if collisions were more frequent. Kinetic effects in the plume were studied [13] using a hybrid (kinetic ions and fluid electrons) numerical model in a lower current cathode.
Our model also lacks a description of the experimentally applied magnetic field (in the NSTAR discharge cathode, this is briefly discussed below in section B) and assumes a perfect regulation of the extracted discharge current at the anode [1].
We now describe the plasma instabilities in the plume which lead to the simulated discharge current oscillations. The plasma potential profile and the normalized ion acoustic instability fluctuation energy density , in the plume are represented in figure 8. , is defined here as , ≔ / where was defined in our companion paper [1] as the electric field fluctuations energy density linked to the ion acoustic instability. Since the growth of the instability is assumed to saturate due to kinetic effects when reaches a fraction of the electron thermal energy defined by the parameter (see [1]), we have , ∈ 0, . We have defined in [1] the anomalous electron collision frequency associated with the ion acoustic instability as =
3 4 5 6 7 8 9 10 11 12 13 14 15 16 17 18 19 20 21 22 23 24 25 26 27 28 29 30 31 32 33 34 35 36 37 38 39 40 41 42 43 44 45 46 47 48 49 50 51 52 53 54 55 56 57 58 59 60
2√ , . Hence, , provides both an image of the excitation of the ion acoustic instability and a proxy for the associated anomalous collision frequency.
We observe in the profile for , (see fig. 8) the occurrence of wave-like features which seem to grow in the keeper orifice region and then propagate over time outwards in the plume (to the right in fig. 8). These features cause locally a strong increase of the total electron collision frequency , and thus of the resistivity of the plasma. The simulated anomalous collision frequency is much larger than the classical collision frequency in the plume: at abscissa 4.5 in fig. 8 on the axis of the cathode, increases temporarily up to 2.8 × 10 , while the classical electron collision frequency (computed from collisions with neutrals and ions) is only on the order of 1.1 × 10 at the same location. The correspondence between the ion acoustic instability energy density and the plasma potential gradients in the plume is obvious in fig. 8.
Lastly, we stress that is proportional to . Thus, even if the value for , reaches its saturation threshold far in the plume, the decrease of the plasma density (see fig. 2) leads to a global decrease of the maximum value reached by far from the orifice.
Figure 8: Snapshot of the plasma potential and normalized ion acoustic instability energy density ( , ≔ / ) in the cathode near-plume. Dimensions are in
The ion acoustic instability grows when the electron drift velocity exceeds the ion acoustic velocity , = / by a sufficient margin to counter-act collisional damping terms [1] (Landau damping when / is on the order of the unity and neutral-ion collisions). Recall that the ion acoustic instability fluid model presented in [1] includes heating terms for ions and electrons which physically dissipate the energy contained in the fluctuations of the electric field, which itself stems originally from the electron drift kinetic energy. Hence, the
3 4 5 6 7 8 9 10 11 12 13 14 15 16 17 18 19 20 21 22 23 24 25 26 27 28 29 30 31 32 33 34 35 36 37 38 39 40 41 42 43 44 45 46 47 48 49 50 51 52 53 54 55 56 57 58 59 60
simulated electron temperature in the plume (and also the ion temperature) varies at high frequency with the excitation of the instability.
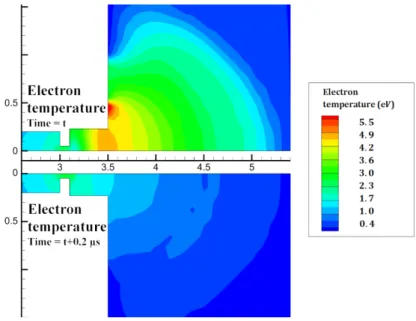
In figure 9, we show the simulated electron temperature in the plume at two instants separated by 0.2 which are representative of the transient phenomena in the plume of the cathode. Electrons are repeatedly heated in the plume, at a frequency on the order of the and the electron temperature distribution alternates between two extremal states corresponding to either a warm (4 to 5 ) and extended plasma plume which ranges a few downstream of the orifice or a much colder plume in which the electron temperature falls immediately outside the orifice to temperatures on the order of 1 (see fig. 9). In simulations, the repeated heating of electrons echoes the high frequency component of the fluctuations of the discharge potential mentioned earlier. Ions are heated up to 3000 by the plasma instability in the plume, whereas when the acoustic instability is not taken into account, the simulated ion temperature on the axis of cathode in the keeper plane is as low as 190 . In both cases, the peak ion temperature inside the cathode is 3200 (fig. 5) and is unaffected by the ion acoustic instability (since it is inactive inside the cathode, see fig. 8). Thus, in our simulations, the heating effect of the ion acoustic instability in the plume is clearly dominant. However, we underline once again the fact that the use of a fluid model for ions in the plume [1] (where kinetic effects might play a role due to the large mean free path) may yield an inaccurate estimate of the ion temperature.
The heating of electrons in the plume leads to a change in the growth rate of the ion acoustic instability since both the ion acoustic velocity , and the Landau damping terms depend on [1]. We observe that the overall effect of the instability in the plume of this cathode at this operating point is the decay of the ion acoustic instability when electrons are heated. Therefore, we suggest the following mechanism for the generation of plasma potential oscillations in the keeper region of the cathode: starting from a situation where electrons in the plume are cold, the electron drift velocity is sufficiently high w.r.t. , (on the order of 1200 . in the plume) to provoke the growth of the ion acoustic instability. The fluctuations associated with the instability then propagate in the plume at the ion acoustic velocity. Meanwhile, electrons (and ions) are heated by the instability and the instability eventually quenches itself close to the keeper exit and the cycle may start anew. From the simulations results, it is therefore tempting to associate the high frequency component of the oscillations of the discharge potential to the excitation and quenching of the instability in the orifice region, and the low frequency to the propagation of the instability towards the anode at the ion acoustic velocity. Since the anode is distant here from the orifice by a few , this yields a frequency on the order of a few tens of . Experimentally, the
3 4 5 6 7 8 9 10 11 12 13 14 15 16 17 18 19 20 21 22 23 24 25 26 27 28 29 30 31 32 33 34 35 36 37 38 39 40 41 42 43 44 45 46 47 48 49 50 51 52 53 54 55 56 57 58 59 60
discharge potential contains indeed a signal in this frequency range. However, it is generally associated in the literature with an ionization instability of the plume rather than with a ion acoustic instability induced mode [2]. In our simulations, electrons are heated periodically in the plume by the ion acoustic instability (see fig. 9). The ionization source term in the orifice plane follows this evolution (through the electron temperature dependence, see [1]). However, it does not remain large enough for a sufficiently long period to lead to a true depletion of neutrals: even if the ionizing collision frequency for electrons oscillates between almost 0 (when is too far below the ionization threshold of Xe) and 8 × 10 , the simulated amplitude of neutral density oscillations is only on the order of the percent of the mean neutral density ( ≈ 7 × 10 in the orifice plane). This is far too low to be associated with an ionization instability. Simulations results obtained with the ion acoustic instability model disabled do not show evidence for such an ionization instability either [1].
Figure 9: Electron temperature in the plume at two representative instants. The transient heating effect of the ion acoustic instability is clearly seen.
Experimentally, a luminous emission is observed in the vicinity of the keeper exit [2]. This zone is known to be quite small at low discharge currents (w.r.t. the orifice size and mass flow rate), in the so called spot mode, while it extends further downstream at higher discharge currents (the plume mode). Since the simulated warm electrons in the plume (fig. 9) may excite the xenon in the plume and cause a visible glow in the plume, it seems reasonable to associate the simulated electron temperature profile to the experimentally observed behavior. In our simulations, when = 13 (the simulation case shown here), the warm electron region extends far in the plume, whereas when = 8 for instance, the electron temperature distribution remains spatially less extended (more similar to the lower half of fig. 9). Therefore, we associate simulation results in = 13 to the plume mode of the cathode, whereas results obtained in the = 8 case seem to correlate with what is expected from
3 4 5 6 7 8 9 10 11 12 13 14 15 16 17 18 19 20 21 22 23 24 25 26 27 28 29 30 31 32 33 34 35 36 37 38 39 40 41 42 43 44 45 46 47 48 49 50 51 52 53 54 55 56 57 58 59 60
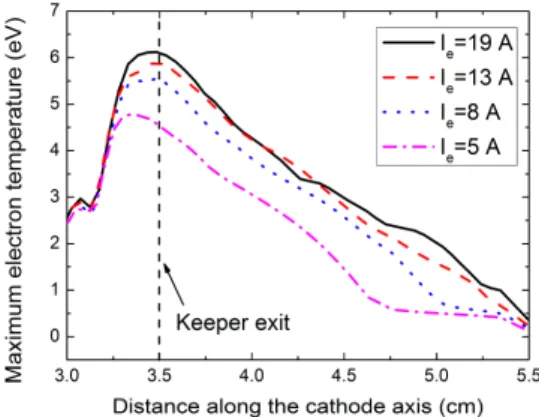
the spot mode [2]. This simulated trend seems consistent with experimental observations. To better illustrate this trend, we show the maximum electron temperature (over time) in the plume of the cathode along its axis in figure 10. The hotter electron region (and hence the luminous region) is clearly more extended when the discharge current is increased (the difference is easily seen between cases = 5 and = 13 ), hinting at a transition from the spot mode to the plume mode in simulation results. This should not mean that the operation mode (spot or plume) of the cathode may be reduced to the exclusive characterization of the electron temperature distribution though, as the transition to plume mode is also linked experimentally for instance to a more instable discharge potential as well as an accelerated degradation of the keeper electrode [2]. The occurrence of these phenomena in our simulations is discussed below in section III.A.1.
Figure 10: Maximum electron temperature reached over time in the plume.
B. I
NFLUENCE OF AN APPLIED MAGNETIC FIELD
In this section, we include in simulations an applied magnetic field in the plume of cathode so as to better replicate the experimental setup in [2] and show the strong impact of the magnetic field in the plume plasma of the cathode. Since the experimental applied magnetic field aims at reproducing the NSTAR thruster magnetic field arrangement inside the discharge chamber, we use the magnetic field profile described in [14] for the NSTAR thruster along the discharge cathode axis. The magnetic field in the cathode region is roughly aligned with the cathode axis and its magnitude is shown in the figure 11. In our simulations, we assume that the applied magnetic field is purely axial (noted below as the direction) and specify its magnitude | | using the profile in fig. 11. In the radial direction (designated by ), the magnitude of the magnetic field | | is assumed constant. Since its maximum amplitude is on the order of 100 , only electrons are magnetized in our model. The magnetic field arrangement used in this model is a much simplified representation of the true magnetic field
3 4 5 6 7 8 9 10 11 12 13 14 15 16 17 18 19 20 21 22 23 24 25 26 27 28 29 30 31 32 33 34 35 36 37 38 39 40 41 42 43 44 45 46 47 48 49 50 51 52 53 54 55 56 57 58 59 60
topology. It remains comparable to the applied magnetic field topology in some cathode numerical models published in the literature though [3].
Figure 11: Axial magnetic field magnitude along the axis of the cathode inside the discharge chamber of the NSTAR thruster (taken from [14]). The origin of the abscissas in the figure is the same as in simulations of the cathode shown above.
Since the magnetic field magnitude does not fall off radially in our model, we expect the plume resistivity in the model to exceed its experimental counterpart. Indeed, as we will see below, the discharge potential and simulated electron density in the plume show an excessive radial confinement of the electrons, and even more so as a cylindrical anode is used which forces the electrons to cross the magnetic barrier.
In our model, the anode boundary condition is somewhat arbitrary, since a uniform electron current density is collected at the anode [1]. The anode could be represented more accurately in the model as a voltage biased electrode. However, we would then also need to implement a discharge current regulation mechanism at the anode, since the plasma discharge is naturally non-stationary in the plume in many cases. This mechanism could then impact the dynamic behavior of the cathode. The choice we made here (i.e. a uniformly current collecting boundary) is easier to implement and more robust numerically. However, it is also less physical, especially when the anode is large and a magnetic field is applied, as it forces a constant current density at its surface irrespective of the local plasma density and electron mobility. When the anode geometry described in [1] was used (i.e. a 2 long cylindrical anode placed immediately downstream of the keeper orifice) while applying the magnetic field described in fig. 11, the discharge potential at the anode became unrealistically large since the electron current was forced through the region where | | is the most intense (fig. 11). We circumvent this difficulty by pushing back the anode further downstream: in the simulation results presented in this section (and this section only) the anode extends between abscissas 8 and 10 (see fig. 11). Other geometric parameters are left unchanged. With this new simulation domain, | | is on the order of 20 in front of the anode, compared to 80 in the earlier case.
3 4 5 6 7 8 9 10 11 12 13 14 15 16 17 18 19 20 21 22 23 24 25 26 27 28 29 30 31 32 33 34 35 36 37 38 39 40 41 42 43 44 45 46 47 48 49 50 51 52 53 54 55 56 57 58 59 60
Since the applied magnetic field is purely axial and the model 2D-axisymetric, the electron mobility differs from the classical mobility only the radial direction ( ) and the Hall term needs not be considered. Using the notations in our companion paper [1], the electron drift-diffusion equation in presence of the applied axial magnetic field reads:
( ) , = 1
1 + ℎ [− + ] + [− + ] (1)
where ℎ = / is the electron Hall parameter, with the total electron collision frequency. [⋅] symbolizes the projection on a single component (in this case radial). The electron fluid internal energy equation [1] is also modified accordingly. In the model, the effect of the applied magnetic field is considered exclusively downstream of the orifice entry section (seen from the interior region), as the frequent collisions inside the cathode forbid any strong magnetization of the electrons.
In simulation results presented in this section, the thermal model of the cathode is not solved and the temperature of the emitter is set using the experimentally measured profile measured for the NSTAR cathode running at its TH 15 operating point ( = 13 , = 3.6 ) (see [1]). This precautionary measure was taken to ensure that the modification of the plume resistivity (because of the magnetic field) does not alter the simulated temperature distribution at the emitter surface (however weakly) and reduce the significance of the comparison between plasma simulation results obtained with and without the magnetic field. The ion acoustic instability model in the plume is not included as its dispersion relation would not be valid anymore in the radial direction due to the magnetization of the electrons. As the magnetic field is purely axial in our simulation, electrons have to move across magnetic field lines to reach the anode and the effective collision frequency associated with the instability might be altered in that direction. Simulation results shown below are very close to stationary states, with simulated variations of the plasma density and potential below 1 % of the average value.
The simulated plasma density and plasma potential profiles along the cathode axis for this simulation setup are shown in fig. 12. We also plot simulation results obtained earlier with no applied magnetic field, not taking into account the ion acoustic instability in the plume but still including the porosity effect of the emitter [1].
3 4 5 6 7 8 9 10 11 12 13 14 15 16 17 18 19 20 21 22 23 24 25 26 27 28 29 30 31 32 33 34 35 36 37 38 39 40 41 42 43 44 45 46 47 48 49 50 51 52 53 54 55 56 57 58 59 60
(a) (b)
Figure 12: Simulated plasma density (a) and plasma potential (b) along the cathode axis with an applied magnetic field and comparison to experimental measurements. Earlier simulation results (with no instability in the plume and no magnetic field
are shown for comparison [1]). We recall that the anode is cylindrical.
The application of an axial magnetic field in the plume results in a strong increase of the plasma density in the plume (see fig. 12 (a)), due to the radial confinement of electrons. Half a downstream of the keeper on the axis (abscissa 4 in fig. 12 (a)), the simulated plasma density is now 1.6 × 10 , whereas in the simulation case with no applied magnetic field, the simulated density was below 10 (in fig. 12 (a), the density 10 is the lower bound allowed by the model). Experimentally, the measured plasma density at this location is 7.4 × 10 . In our model, the applied magnetic field profile leads clearly to an overestimation of the plasma density in the plume. In fig. 12 (b), we note that the simulated plasma potential profile along the axis becomes monotonous in the plume when the axial magnetic field is applied. In the plume, it is also within experimental error bars with the exception of the furthest measurement point downstream. When compared to the simulated profile with no applied magnetic field (fig. 12 (b)), we may interpret the disappearance of the plasma potential hills in the plume as a consequence of the additional confinement of electrons: since the radial expansion of electrons is slowed down by the magnetic field, the presence of a repelling electric field (in the simulation case with no applied magnetic field) is not needed anymore to prevent the quasi-neutrality from breaking up in the plume.
The simulated discharge potential at the anode is increased to 35.5 w.r.t. the “no applied magnetic field” case, for which the discharge potential was 10 [1]. Experimentally, the measured discharge potential at the anode is about 25 . Since the anode is cylindrical [1], both experimental data and simulation results with an applied magnetic field exhibit a plasma potential trough on the cathode axis, yet it is clearly overestimated in our model.
In the model, the overestimation of the experimental plasma density in the plume (fig. 12 (a)) and of the discharge potential at the cylindrical anode point to an excessive radial confinement of the electrons along the
3 4 5 6 7 8 9 10 11 12 13 14 15 16 17 18 19 20 21 22 23 24 25 26 27 28 29 30 31 32 33 34 35 36 37 38 39 40 41 42 43 44 45 46 47 48 49 50 51 52 53 54 55 56 57 58 59 60
axial magnetic field lines. Possible causes of this include the simplistic treatment of the anode as well as the inaccurate applied magnetic field profile. Anomalous collisions for electrons, such as the ones triggered by the ion acoustic instability [1] may also play a de-confining role which would allow electrons to cross the magnetic field barrier more efficiently (similarly to the mechanism suggested in HTs).
In the last two sections, we have illustrated the increased resistivity of the plume and confining effect on electrons of first ion acoustic instabilities (section A, and also [1]) and then of an applied axial magnetic field (section B). In the case of the applied magnetic field, the resulting confining effect led to an overestimation of the plasma density in the plume. The simplicity of the applied magnetic field arrangement in simulation relative to the experimental setup is a probable cause of this discrepancy. However, in cathodes for HTs, a magnetic field is rarely considered as the cathode is often located outside of magnetic field lines [15] (except when the cathode is centrally mounted on some high power HTs). Therefore, in the rest of this study, we will not include an applied magnetic field in the plume and keep solely the effects of the ion acoustic instability on the discharge, as this phenomenon may cause plasma potential oscillations in the cathode which limit its operating envelope. Obviously, the absence of the axial magnetic field in simulations will lead to discrepancies between simulation results and measurements for the NSTAR cathode. However, we believe that some useful trends may still be extracted from the model through the comparison of simulation results for various operating points and cathode designs.
III. PARAMETRIC STUDY
In this section, we use the coupled model of the NSTAR cathode (both plasma and heat transfer models) to assess the influence of the discharge current, the mass flow rate and the inner radius of the emitter on macroscopic characteristics of the discharge, such as the discharge potential at the anode, the maximum temperature of the emitter or the internal gas pressure inside the cathode.
A. OPERATING POINT
1.
D
ISCHARGE CURRENTWe now run the coupled numerical model for various discharge currents in the range ∈ [5 , 22 ], and plot the resulting time-averaged discharge potential at the anode, keeper potential and plasma potential in the keeper orifice. The total emitted electron current is plotted, as well as the ion and electron current collected at the
3 4 5 6 7 8 9 10 11 12 13 14 15 16 17 18 19 20 21 22 23 24 25 26 27 28 29 30 31 32 33 34 35 36 37 38 39 40 41 42 43 44 45 46 47 48 49 50 51 52 53 54 55 56 57 58 59 60
metallic walls of the cathode (anode excluded). These plots are shown in figure 13. The current extracted from the keeper is set to = 1.5 and the mass flow rate to = 3.6 .
Figure 13: Discharge potential ( ), keeper electric potential ( ) and plasma potential at the center of the keeper orifice ( . ) vs. discharge current . The total emitted electron current ( ) and collected electron current ( ) and
ion current ( ) on surfaces other than the anode are also plotted.
As the discharge current is increased, the anode potential decreases, passes by a minimum (for ∈ [8 , 13 ] and increases again at larger discharge currents. Meanwhile the keeper potential decreases over the whole discharge current range analyzed here. Both these trends are observed experimentally [16]. When the discharge current is increased, the cathode has to provide for the additional electron current either through ionization in volume or thermionic emission at the walls. Since ions are mostly produced in the interior region of the cathode and in the orifice region, the collected ion current at the walls enables us to estimate the importance of ionization in the macroscopic electron current balance (w.r.t. electron emission). We see on fig. 13 that as is increased, is barely affected (it increases from 2.4 when = 5 to 3.1 when = 22 ). Consequently, the missing electron current has to be supplied by thermionic emission. Both the emitted and collected electron current increase with . We mentioned during our analysis of the simulation case at = 13 (see section I.C) that 90 % of the “produced” electron current comes from thermionic emission. Thanks to the simulations carried out here, we may compare this to other cases: when = 5, 75 % of the electron stems from emission whereas when = 22 , this fraction rises up to 96 %. Thus, we see that the cathode relies increasingly on thermionic emission as is increased, rather than ionization inside the cathode. This also means that sputtering of the emitter caused by ion bombardment (from ions produced in the volume of the cathode) is not expected based on these simulation results. Finally, we see that the plasma potential in the keeper orifice exit plane ( . in fig. 13) decreases when increases. Thus, the increase of the discharge potential of the anode does not come from the energy spent (i.e. the potential drop) in the interior region in heating the plasma electrons and ionizing
3 4 5 6 7 8 9 10 11 12 13 14 15 16 17 18 19 20 21 22 23 24 25 26 27 28 29 30 31 32 33 34 35 36 37 38 39 40 41 42 43 44 45 46 47 48 49 50 51 52 53 54 55 56 57 58 59 60
neutrals but rather from the increased resistivity of the plume. The ability to model this trend is a consequence of our treatment of the ion acoustic instability in the cathode plume [1].
Since the emission current increases with , the temperature of the emitter has to increase accordingly (see Richardson-Dushman law [1]). We plot in figure 14 the computed maximum ( ) and minimum ( ) temperature along the emitter. The heating power deposited directly on the emitter from electron bombardment ( ), ion bombardment ( ) and the power lost to thermionic emission cooling ( ) are also plotted. A non-negligible fraction of the total heating power is deposited on other metallic surfaces of the cathode as well: about 25 % of is transferred to non-emissive walls of the cathode when = 13 , and then partly transferred to the emitter through conduction. However, it suffices to focus on fluxes deposited directly on the emitter to illustrate the macroscopic behavior of the cathode.
Figure 14: Minimum ( ) and maximum ( ) of the simulated temperature along the emitter. Heat fluxes on the emitter resulting from electron collection ( ), ion collection ( ) and election emission ( ) are plotted as well.
In figure 14, the maximum simulated temperature along the emitter increases with . The amplitude of the temperature variation ( − ) along the emitter increases slightly as well. Both these trends are observed experimentally [16]. In order to sustain the higher temperature of the emitter, the heating power deposited through plasma bombardment has to increase as well (through electron bombardment, in fig. 14). Since more electrons are emitted when increases (see fig. 13), the heat flux lost through emission cooling increases as well ( in fig. 14). We note in fig. 14 that the heat flux brought to the emitter through ion bombardment ( ) actually decreases when is increased. This results from both a slight decrease of the ion flux bombarding the emitter (from 2 when = 5 down to 1.23 when = 22 ) and from a decrease of the plasma sheath height in front of the emitter (locally as high as 10.7 when = 5 whereas it falls below 2.7 when = 22 ). When the discharge current is low, the emitter is predominantly heated by ion bombardment: when =
3 4 5 6 7 8 9 10 11 12 13 14 15 16 17 18 19 20 21 22 23 24 25 26 27 28 29 30 31 32 33 34 35 36 37 38 39 40 41 42 43 44 45 46 47 48 49 50 51 52 53 54 55 56 57 58 59 60
5 , 83 % of the plasma bombardment heat flux incident on the emitter comes from ions. As the discharge current is increased, the fraction of the heating power brought by electrons increases (52 % when = 8 , 80 % when = 13 and over 90 % when ≥ 19 ) and at a high discharge current, the heating power supplied to the emitter comes almost exclusively from electrons. In terms of lifetime of the emitter, this is a profitable behavior as a more intense ion bombardment would most likely degrade the emitter through sputtering.
This should not imply however that this cathode would be able to run for extended periods of time at a discharge current much larger than = 13 . Indeed, in section I.C, we have seen that, when = 13 (a nominal operation point for this cathode), the current density emitted from the (porous) true surface of the emitter is locally already as high as 2.5 × 10 . . When = 16 , it rises up to 4.3 × 10 . , and up to even larger current densities in higher discharge current conditions (e.g. 6.5 × 10 . when = 19 ). It is known in the literature [17] that high emission current densities are associated with an increased evaporation rate of the emitter. Hence, operating this cathode at some of the highest discharge current conditions considered here could lead to the quick destruction of the emitter. Discussing the various constraints that limit the lifetime and applicability of a specific emitter from the point of view of material science is outside the scope of this article though.
We have seen in section II.A that a new feature of this model is its ability to describe plasma potential oscillations and electron heating in the plume that result from the excitation of ion acoustic instabilities. In figure 15, we have represented the amplitude of plasma potential oscillations in the keeper orifice exit plane and at the anode over the range of considered for this cathode. The maximum electron temperature reached during plasma oscillations in the keeper orifice exit plane is plotted as well. Let us recall once more that no magnetic field was applied in these simulations, and therefore, the simulated characteristics of the instabilities described here might differ from those observed experimentally in [2].
3 4 5 6 7 8 9 10 11 12 13 14 15 16 17 18 19 20 21 22 23 24 25 26 27 28 29 30 31 32 33 34 35 36 37 38 39 40 41 42 43 44 45 46 47 48 49 50 51 52 53 54 55 56 57 58 59 60
Figure 15: Plasma potential oscillations in the keeper exit plane ( . ) and at the anode ( ) vs. the set discharge current ( ). The maximum electron temperature ( ) reached in the keeper exit plane during oscillations is plotted as well.
We see in figure 15 that both the plasma potential and anode potential oscillations intensify as is increased. This is consistent with the experimental trend observed in [2] for the two operating points TH 15 ( = 13 ) and TH 8 ( = 8 ). When increases, electrons in the keeper exit plane are heated to higher temperatures (see fig. 15) and the hot electron region extends further downstream of the orifice. We interpret this behavior as an indication of the transition of the cathode from the spot mode to the plume (see section II.A).
Physically, an intensification of the ion acoustic instability is expected when is increased as the electron drift velocity (which is responsible for the growth of the instability) increases as well. We see here that even the lowest discharge current cases considered here with our model are not immune to instabilities. A direct comparison to experimental data in [2] is difficult though: since an axial magnetic field is applied in that experimental setup, the plasma density in the near-plume is increased and the electron drift velocity diminishes for a given discharge current (w.r.t. to the non-magnetized case). Therefore, the threshold for the onset of ion acoustic oscillations in the plume could be pushed back to higher discharge current conditions.
The plasma oscillations that grow in the keeper exit plane not only propagate to the anode but also accelerate some ions towards the keeper up to high kinetic energies (w.r.t. the mean plasma potential). When = 5 , the maximum kinetic energy of ions accelerated towards the keeper is about 12 , whereas at = 13 , their maximum kinetic energy increases up to 23 and even 29 at = 22 . When averaged over time, the kinetic energy of ions impacting the keeper electrode is much lower though and never exceeds 6 (at = 22 ). These high energy ions could lead to a quick degradation of the downstream parts of the cathode such as the orifice or the keeper electrode. Such a behavior has been observed experimentally and reported in [3]. It is important to distinguish simulation results obtained here from the energy spectrum of ions measured experimentally using a Retarding Potential Analyzer in [2]: in the literature, a high energy ion tail has been
3 4 5 6 7 8 9 10 11 12 13 14 15 16 17 18 19 20 21 22 23 24 25 26 27 28 29 30 31 32 33 34 35 36 37 38 39 40 41 42 43 44 45 46 47 48 49 50 51 52 53 54 55 56 57 58 59 60
measured as a result of essentially kinetic effects in the plasma. Here we always assume that a fluid description is valid and thus the kinetic energy of ions deduced from the simulations results corresponds to the maximum ensemble kinetic energy of ions incident on the keeper that is reached periodically over time as a consequence of plasma potential oscillations.
We conclude this section about the behavior of the cathode w.r.t. the discharge current with a brief discussion of the influence in our numerical simulations of the current extracted from the keeper electrode (noted ). So far, we have chosen = 1.5 for all simulation cases. Setting = 13 and = 3.6 (as in section I and II), the behavior of the cathode was analyzed for in the range ∈ [0 , 3 ]. Simulation results obtained in this case were very similar to those obtained earlier for a variation of alone and an analogy could be drawn between couples of simulation results for which the sum + remained constant. Indeed, as electrons collected on the keeper do not contribute to the cathode heating in our model, these are simply seen as lost from the perspective of the current and energy balance. We note however that a larger value of led in simulations to a higher keeper electric potential (i.e. closer the plasma potential in the keeper orifice, so as to collect more electrons) and thus to a lower plasma sheath potential in front of the keeper. Consequently, the average kinetic energy of ions that bombard the keeper is decreased when is increased. This effect was most visible for the simulation cases = 0 (floating keeper) and = 0.75 : on average, ions impacting the keeper in the = 0 case carry a kinetic energy of 12 , while it is lower than 5 for ≥ 0.75 (the decrease of the kinetic energy of ions is much smaller for higher values of ). Therefore, it seems that operating a cathode with a non-zero value of might reduce the sputtering rate of the orifice plate.
2.
M
ASS FLOW RATEAnother key parameter of the cathode operating point is the xenon mass flow rate injected at the cathode inlet. In this section, the discharge current is set to = 13 and the current extracted from the keeper to = 1.5 while the mass flow rate is varied in the range ∈ [2 , 7 ].
In our simulations, the set mass flow rate had a weak influence on the discharge potential: a slight increase of the average discharge potential at the anode and of the plasma potential in the keeper orifice by about 5 was noted when = 2 w.r.t. to simulation cases with ≥ 3.6 . The current balance was barely affected as well, as the emitted and collected electron current are increased from 33 and 22 respectively when = 2 up to 36 and 26 respectively when = 7 .
3 4 5 6 7 8 9 10 11 12 13 14 15 16 17 18 19 20 21 22 23 24 25 26 27 28 29 30 31 32 33 34 35 36 37 38 39 40 41 42 43 44 45 46 47 48 49 50 51 52 53 54 55 56 57 58 59 60
![Figure 1: Simulated emitter temperature distribution (coupled model) and measurements taken from [7] for the NSTAR cathode running at the 15 operating point ( = 13 and = 3.6 )](https://thumb-eu.123doks.com/thumbv2/123doknet/14373022.504650/5.892.288.573.493.697/figure-simulated-emitter-temperature-distribution-coupled-measurements-operating.webp)
![Figure 2: Simulated plasma density (a) and plasma potential (b) in the coupled model along the axis of the NSTAR cathode running at the 15 operating point ( = 13 and = 3.6 ) and comparison with experimental data [2] and with](https://thumb-eu.123doks.com/thumbv2/123doknet/14373022.504650/6.892.116.754.212.448/figure-simulated-density-potential-coupled-operating-comparison-experimental.webp)


![Figure 11: Axial magnetic field magnitude along the axis of the cathode inside the discharge chamber of the NSTAR thruster (taken from [14])](https://thumb-eu.123doks.com/thumbv2/123doknet/14373022.504650/19.892.287.573.208.423/figure-axial-magnetic-magnitude-cathode-discharge-chamber-thruster.webp)
