OATAO is an open access repository that collects the work of Toulouse
researchers and makes it freely available over the web where possible
Any correspondence concerning this service should be sent
to the repository administrator:
[email protected]
This is an author’s version published in:
http://oatao.univ-toulouse.fr/21457
To cite this version:
Lei, Fang and Dupuis, Pascal and Durrieu, Olivier and Zissis,
Georges and Maussion, Pascal Acoustic Resonance
Detection Using Statistical Methods of Voltage Envelope
Characterization in Metal Halide Lamps. (2017) IEEE
Transactions on Industry Applications, 53 (6). 5988 -5996.
ISSN 0093-9994
Official URL:
https://doi.org/10.1109/TIA.2017.2742978
Acoustic
Resonance Detection Using Statistical
Methods
of Voltage Envelope Characterization in
Metal
Halide Lamps
Fang
Lei, Pascal Dupuis, Olivier Durrieu, Georges Zissis and Pascal Maussion
Abstract—Acoustic resonance (AR) phenomenon occurs in metal
halide lamps and can cause light flicker, lamp arc bending and ro-tation, lamp extinction, and in the worst case, arc tube explosion. This study takes place in the context of developing electronic bal-lasts with robust AR detection and avoidance mechanisms. To this end, a lock-in amplifier is used to measure and characterize lamp voltage root mean square (rms) short-term fluctuations. Statisti-cal criteria based on the standard deviation of this rms value are proposed to assess AR presence and classify its severity. A set of metal halide lamps from different manufacturers and with differ-ent powers were tested. The average electrical power and AR level are controlled by adjusting the lamp operating frequency of high-frequency electronic ballast. The proposed criteria enable classify-ing healthy (without AR) and faulty (with AR) cases based upon either a two-dimensional plane or a boxplot. Regardless of lamp operating power, the results from this study show that the voltage rms variations and the defined criteria are significantly correlated with AR level.
Index Terms—Acoustic resonance (AR), boxplot, detection,
lock-in amplifier, metal halide (MH) lamps, standard deviation, statis-tics, two-dimensional (2-D) plane, voltage envelope.
I. INTRODUCTION
M
ETAL halide (MH) lamp is one of the most compact high-performance light sources [1]. Because of their good color rendering index (CRI) and high luminous efficiency (>80 lm/W), MH lamps are often preferred in locations where color and efficiency are important, such as supermarkets, gymnasiums, ice rinks, and sporting arenas. Furthermore, in situations requiring the production of a large amount of lumen (scenery lighting, plant growth, etc.), LED-based luminairesThe authors are with the Laboratory on Plasma and Conversion of En-ergy (LAPLACE), Universit´e de Toulouse, Centre National de la Recherche Scientifique (CNRS), National Polytechnic Institute of Toulouse (INPT), Universit´e Paul Sabatier (UPS), Toulouse Cedex 931062, France (e-mail: [email protected]; [email protected]; [email protected]; [email protected]; [email protected]).
are commercially available with similar characteristics but at higher cost. Therefore, because of economic incentives, MH lamps will be kept as legacy devices for at least one decade.
High-frequency power electronic systems offer many advan-tages like smaller component values, reduced volume, easier shielding to reduce electro-magnetic compatibility concerns. In the case of discharge lamps, half-bridge inverter ballasts increase system efficiency, leading to lower operating costs [2], [3]. Traditional low-frequency square-wave ballasts with full-bridge inverter presents higher cost in this respect.
Discharge lamps operated at higher frequencies present a re-duced I–V hysteresis area. This area is proportional to plasma losses [4]. However, there is a tradeoff as acoustic resonance (AR) occurs in MH lamps operating above 1 kHz [5]. AR can cause lamp arc distortion, rotation, extinction, and in the worst case, lamp explosion [6]–[8]. Obviously, AR hinders the devel-opment of MH lamps and gives rise to unknown risks on MH lamps or electronic ballasts.
AR can be understood as standing pressure waves in the gas of the arc tube [9]. A continuous flow of gas within the discharge vessel of the MH lamp is mainly caused by convection and diffusion [10]. There are some methods to detect AR, which can be categorized into three groups: optically, electrically, and sound based [11].
An automatic AR detection workbench was presented in high-intensity discharge (HID) lamps controlled by computer [12]. This detection method is based on an array of photodetectors with the ability to identify arc distortions. Relative intensity measurements at different points of projections are made and analyzed statistically to detect AR. This is an accurate method to detect AR phenomenon. Nonetheless, due to maladjustments of the projection system or differences of photodiode sensitivity, it is difficult to choose the reference measurement of the system.
Low-frequency fluctuations of the lamp current are produced when AR appears in MH lamps [13]. The lamp current is de-tected by a current transformer and then filtered to eliminate the switching frequencies and amplified. The enlarged current signal is sampled and analyzed by fast Fourier transform.
An autotracking control strategy was proposed to detect AR [14]. In case AR occurs, the variation of lamp voltage is de-tected and the operating frequency is gradually changed until a stable operation is reached. The autotracking strategy is able
to efficiently detect and control AR. Nevertheless, changing the operating frequency could be a risky way to avoid AR. At some AR frequencies, lamp extinction occurs if the step and direction of frequency sweep are not proper.
Sound spectra of pressure waves were detected in high-pressure mercury discharge lamps [15], [16]. This method showed that AR is not related to visual arc instabilities.
Although electrical methods are reliable to detect AR, most of them are not easy to implement. As presented in the paper [6], the lamp voltage increases and current decreases when AR occurs in HID lamps. However, at slight AR level, detecting lamp voltage and current variations from oscilloscope observation is uneasy. The AR intensity is difficult to define. This assessment is based on subjective criteria of visual observations (human eyes) [14], [16]. The electrical parameters of lamps such as power, voltage, and current, present amplitude variations when AR appears in HID lamps. Additionally, the variations of these pa-rameters can be classified as in this order:ΔP < ΔI < ΔU in the open-loop operation [6].
The baseband envelope variations reflect the amplitude vari-ations of the input signal. A lock-in amplifier can therefore extract a signal with a known carrier wave from an extremely noisy environment [18]. The voltage envelope variations con-tain the signature of whether AR occurs or not in MH lamps. In our experiments, the lamp voltage envelope is obtained by a Stanford Research System SR830 lock-in amplifier. Its time constant was set to 30 ms. In order to classify different AR levels in MH lamps, statistical methods are used to analyze and characterize voltage envelope variations.
To the authors’ knowledge, this is the first study providing an objective method to classify different AR levels. Neverthe-less, a lock-in amplifier is an expensive device. It permitted to validate the approach reported in this paper. In the ongoing pa-per, embeddable integrated circuits (ICs) implement equivalent functionality.
This paper is organized as follows. Section II describes the main circuit of the electronic ballast and the experimental setup. Section III shows the principle of AR detection and data acqui-sition. Section IV presents and analyzes experimental results, while Section V gives conclusions.
II. MAINCIRCUIT OFELECTRONICBALLAST AND
EXPERIMENTALSETUP
A. Circuit of the Electronic Ballast
The high-frequency electronic ballast is supplied by an LCC half-bridge inverter [19], which is shown in Fig. 1. The inverter consists of a dc supplyVdc, two switchesQ1andQ2, a coupling capacitorCs, a resonant inductorLs, a resonant capacitorCp, and a lamp. In our experiment, the tested MH lamps are chosen from three manufacturers, Osram, General Electric (GE), and Philips.
B. Schematic of the Experimental Setup
Fig. 2 shows the schematic of experimental setup, which is composed of several parts: power source, power meter,
Fig. 1. Circuit of the high-frequency electronic ballast (Ls= 1.8 mH, Cs=
300 nF, andCp= 15 nF). (a) Schematic of the high-frequency electronic
bal-last. (b) High-frequency electronic balbal-last.
electronic ballast, MH lamps, and measurement devices. The power source is supplied by the power supply (Kikusui PCR500M). The input current, voltage, power, and power factor of the electronic ballast are measured by the power meter (Yoko-gawa WT 210). The lamp current and voltage are measured by the current probe (LEM PR30) and differential probe (Lan-glois ISOL601), respectively. To measure voltage envelope vari-ations, the lock-in amplifier (SR830) is used. The digital oscil-loscope (Agilent DSO1024) displays the lamp voltage, current, and power. To implement the automatic measurement system, the driving signal of the function generator (Yokogawa FN120) and the lock-in amplifier are connected to a computer via GPIB bus lines. LabVIEW software is used to control the program and carry out the acquisition, storage, and monitoring [20].
III. PRINCIPLE OFENVELOPEDETECTION ANDEXPLANATION OFDATAACQUISITION
A. Detection Principle of Acoustic Resonance
An envelope detector is an electronic circuit that takes a high-frequency signal as input and provides an output, which is the envelope of the original signal. For lamps, three kinds of signals: lamp voltage, current, and power, can be taken as the input of an envelope detector. The voltage variation is easier to measure and use than current and power in HID lamps [16], [21].
Fig. 3 presents the envelope detection operating principle. There are two input signals, one is the lamp voltage coming from the differential probe, and the other one is the reference signal, which is the same as the driving signal of the electronic ballast. The maximum amplitude of the input signal of the lock-in amplifier (SR830) is 1 V. Therefore, a differential probe whose attenuation ratio gain is 1/200 is used. Finally, a low-pass filter is used to get low-frequency variations of the voltage envelope.
Fig. 2. Schematic of the experimental setup.
Fig. 3. Envelope detection principle in MH lamps.
Fig. 4. Principle of the voltage envelope acquisition in lock-in amplifier.
B. Data Acquisition of the Voltage Envelope in LabVIEW
In the experiment, LabVIEW implements the supervision pro-gram. The principle of the voltage envelope acquisition is shown in Fig. 4. Between two measurement points, the time interval is
24 s, which means that new data are obtained every 24 s after lamp ignition.
MH lamps require a period of time 1–15 min to reach 90% of their full light output. This period is called the warm-up (or run-up) time. After the light output is stable, a frequency sweep is used to change the lamp power. According to dimming system manufacturers, MH lamps used with their systems do not immediately adjust light output when the dimming setting is changed. It takes 3–10 min for light output to stabilize. A supplemental warm-up of 10 min is allowed to obtain reliable data. 51 measurement points over a time window of 20 min are then recorded in no AR or AR situation.
The voltage envelope is evaluated by the lock-in amplifier with a sample rate of 8 Hz within 4 s (32 samples). The short-time average value and standard deviation are computed on those 32 samples. Those two variables are then plotted in the two-dimensional (2-D) plane. Additionally, in each situation and for each manufacturer’s lamp, two close operating frequencies are chosen within a range of 100 Hz.
IV. EXPERIMENTALRESULTS
In the experiment, three kinds of 150-W MH lamps are tested from three different manufacturers: Osram (Powerball HCI-TT), GE (Constant Color CMH), and Philips (Master City White CDO-TT).
Fig. 5 shows arc images with the absence of AR in MH lamps. The lamp arc is straight and no light flicker is observed. Conversely, in the presence of AR phenomenon, the arcs bend and light flashes. In Fig. 6, such deformations can be clearly observed.
AR phenomenon is quite serious in 150-W MH lamps. During the first experiments, MH lamps extinctions occurred a few times during frequency sweep. A few lamps were also destroyed at nominal power. Additionally, previous research has already
Fig. 5. Arc images of MH lamps in no AR situation. (a) Osram (b) GE. (c) Philips.
Fig. 6. Arc images of MH lamps in AR situation. (a) Osram. (b) GE. (c) Philips.
shown that AR level increases with the rise of the operating power in HID lamps [12].
In the reported set of experiments, the lamp operating power was kept at a safe level. To simplify testing, the same dc level was indeed applied in AR and no AR situations, only the frequency was swept. This explains why the power in no AR situation is lower than the nominal operating value.
A. Voltage Envelope in New Osram MH Lamp (Aged 100 h) at Different Operating Power
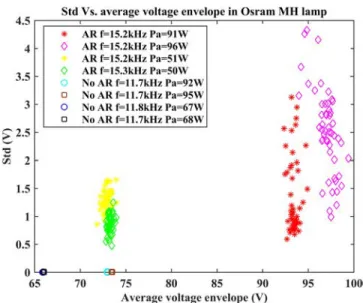
In the Osram 150-W Powerball MH lamp, f = 15.2 kHz andf = 15.3 kHz are inside an AR-frequency band, and f = 11.7 kHz andf = 11.8 kHz are in an AR-free frequency band. To analyze voltage envelope characterizations, it is worth considering the 2-D plane of the standard deviation of the volt-age envelope versus the avervolt-age voltvolt-age envelope. Fig. 7 illus-trates those values obtained with the Osram MH lamp at differ-ent operating powers. Table I lists the corresponding electrical parameters.
As can be observed from Fig. 7, in AR cases atf = 15.2 kHz andf = 15.3 kHz, the standard deviation of voltage envelope fluctuates a lot whatever the lamp operating power (vertical axis). The horizontal axis reveals that average voltage envelopes also exhibit some fluctuations during the 20 min observation window. However, in the no AR situation, the situation is quite different. The points form a dense cloud. The short-time root
Fig. 7. Voltage envelope standard deviation versus average voltage envelope in Osram MH lamp.
TABLE I
ELECTRICALPARAMETERS INOSRAMMH LAMP ATHIGHERPOWER INFIG. 7
Operation state Vd c(V) f (kHz) Long-term average active power (W) Average voltage (V) min–max STD (V) min–max AR 370 15.2 91 92.0–96.0 0.5–3.0 380 15.2 96 94.0–100.0 0.7–4.5 AR 270 15.2 51 72.0–74.0 0.8–1.8 270 15.3 50 72.9–74.0 0.4–1.4 No AR 300 11.7 92 73.0 1.1e-3–1.1e-2 310 11.7 95 74.0 1.3e-3–1.3e-2 No AR 270 11.8 67 65.8 1.1e-3–7.7e-3 270 11.7 68 66.0 1.1 e-3–1.4e-2
mean square (rms) values voltage envelopes are nearly con-stant during the 20 min interval and their short-time standard deviations are close to zero. It is thus easy to graphically spot the differences between the AR and no AR cases in the 2-D plane. Results show that the occurrence of the AR phenomenon influences significantly the lamp voltage envelopes.
To probe further, Fig. 8 illustrates the boxplot of the two previ-ously used quantities. The boxplot is a tool aimed at graphically illustrating some quantiles and the spread of a random variable. Particularly, if the boxplot of two groups of data have no overlap, those two groups can be considered as significantly different.
The results contained in Fig. 8 confirm the observations per-formed in Fig. 7, but in clearer way. In the no AR cases, all the boxplot of the short-term standard deviation overlaps around zero, while in the AR cases, there is a partial overlap, with a range going between 0.5 and 4.5 V. The boxplot of the short-term average value reveals f.i. that the combination of no AR @11.7 kHz, 92 W cannot be distinguished from AR @15.2 kHz, 51 W.
Fig. 8. Boxplot of the voltage envelope in Osram MH lamp. (a) Boxplot of the average voltage envelope. (b) Boxplot of the voltage envelope standard deviation.
B. Voltage Envelope in New GE MH Lamp (Aged 100 h)
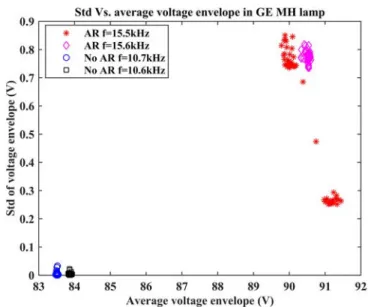
In the GE 150-W Constant Color MH lamp,f = 15.5 kHz and f = 15.6 kHz are in AR frequency band, whereas AR-free frequency band contains f= 10.7 kHz and f = 10.6 kHz. Fig. 9 shows the voltage envelope standard deviation versus the average voltage envelope. Table II lists the corresponding electrical parameters of the lamp.
The clustering patterns observed in Fig. 9 are similar to the previous case. In the no AR situation, both the X- and Y-axis dispersions are quite limited. Standard deviations of voltage envelopes range between around 1 mV up to a few tens of millivolts. However, in the AR situation, data are much scat-tered and their standard deviations are quite different from zero. The rms voltage envelopes randomly changes between 90.0 and
Fig. 9. Voltage envelope standard deviation versus average voltage envelope in GE MH lamp.
TABLE II
ELECTRICALPARAMETERS INGE MH LAMP INFIG. 9
Operation state Vd c(V) f (kHz) Long-term average active power (W) Average voltage (V) min–max STD (V) min–max AR 270 15.5 56 90.0–91.5 0.2–0.9 270 15.6 54 90.0–91.0 0.7–0.9 No AR 270 10.7 99 83.5 1.1e-3-3.3e-2 270 10.6 101 83.8 1.1e-3–2.2e-2
91.5 V. The minimum of their standard deviations is at least 0.2 V. Furthermore, at 15.5 kHz, data are visually clustered in two parts. This implies that the associated AR phenomenon randomly switches between two distinct modes.
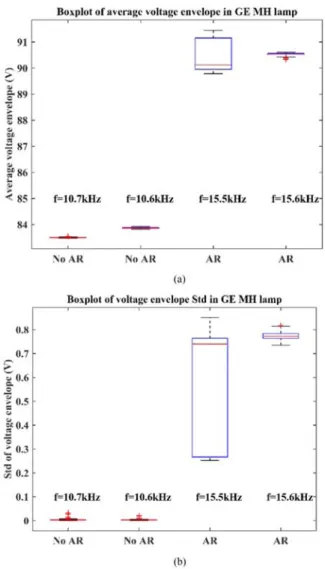
Fig. 10 illustrates the boxplot of the Fig. 9 data. The observed patterns are quite similar to the results obtained with the Osram MH lamp.
In no AR situation, the rms values change significantly with operating frequency as there is no overlap between the associ-ated boxplots. Their standard deviations, except for a few iso-lated points, overlap within a range whose upper value is 8 mV. In the AR situation, the lower value of the 95% confidence in-terval is around 250 mV. By splitting the data at 15.5 kHz with a low threshold of 0.3 V and an upper threshold of 0.7 V, the boxplots reveal the existence of two separated, nonoverlapping, clusters. The lower one contains around 40% of the samples.
C. Voltage Envelope in Old Philips (Aged 8000 h) MH Lamp
In the Philips Master City White MH lamp,f = 12.5 kHz andf = 12.4 kHz are inside an AR-frequency band, whereas
f = 10.5 kHz and f = 10.4 kHz are in an AR-free frequency
band. Fig. 11 illustrates the standard deviation of the voltage envelope versus the average voltage envelope at these frequen-cies. Table III lists the corresponding electrical parameters of the lamp.
Fig. 10. Boxplot of the voltage envelope in GE MH lamp. (a) Boxplot of the average voltage envelope. (b) Boxplot of the voltage envelope standard deviation.
Fig. 11. Voltage envelope standard deviation versus average voltage envelope in Philips MH lamp.
TABLE III
ELECTRICALPARAMETERS INPHILIPSMH LAMP INFIG. 11
Operation state Vd c(V) f (kHz) Long-term average active power (W) RMS voltage (V) min–max STD (V) min–max AR 270 12.5 64 77.0–90.0 0.8–8.0 270 12.4 58 85.0–97.0 4.0–9.0 No AR 270 10.5 104 78.0–80.0 2.0e-3–6.2e-2 270 10.4 102 80.0–81.0 2.3e-3–3.1e-2
According to Fig. 11, when AR occurs in the Philips MH lamp, average voltage envelopes (X-axis) change between 77.0 and 90.0 V atf = 12.5 kHz and between 82.0 and 97.0 V at
f= 12.4 kHz. The standard deviations of the voltage envelope
(Y-axis) span a range overlapping the values in the no AR case. In the no AR situation, average voltage envelopes are stable within a 1 V interval. Their short-term standard deviations are limited to around 60 mV.
The boxplot of the rms voltage envelope illustrated in Fig. 12(a) reveals that the groups of data are overlapping. In consequence, they cannot be classified by this criterion only. The boxplot of their standard deviations, Fig. 12(b), exhibits an apparent overlap of the two situations.
The reasons behind this overlap can be inferred from Fig. 13. This figure contains the time values of the short-term rms voltage envelope. Three phenomena can be observed as follows.
1) Even in the no AR situation, jumps with amplitude of around 5 V were detected.
2) In the AR situation, oscillations between stable and noised operating points occurred randomly. Stable, AR-free pe-riods of up to 2 min are intermixed with AR pepe-riods, all the parameters being kept constant.
3) The same oscillating behavior is also observable on short-time observation window, as displayed in Fig. 13(b), where the stable period is 2 s.
This explains the apparent discrepancies between this lamp and the two other lamps. The analysis should be refined one step further, splitting the signal between stable and noisy periods. Furthermore, this oscillation between no-AR and AR modes at constant applied voltage and switching frequency may be an indicator of the lamp health.
One possible explanation is that the elements present in the lamp burner significantly changed over time. Their concentra-tion being lower, the chemical equilibria have drifted, leading to other plasma modes. Another explanation is that there is a buildup of traps at the glass interface, leading to sudden capture and release of elements.
D. Results Intercomparison
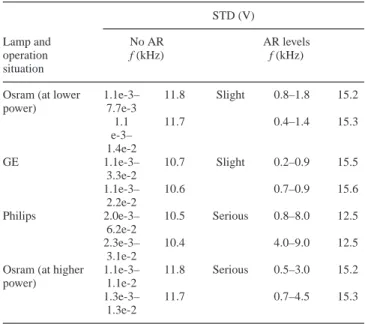
Based on the fact that there seems not be a scientific agree-ment over the definition of AR level, we propose an objective definition classifying the AR phenomenon according to the volt-age envelope standard deviation. Table IV compares this value
Fig. 12. Boxplot of the voltage envelope in Philips MH lamp. (a) Boxplot of the average voltage envelope. (b) Boxplot of the voltage envelope standard deviation.
at different AR levels in different MH lamps. It can be inferred from those observations that the following statements hold.
1) The no AR mode corresponds to a stable voltage envelope; the associated standard deviation magnitude is in the range from 10 to 100 mV. The produced light does not exhibit flicker.
2) The most extreme AR situation that was applied without destroying the lamp corresponds to observable flicker and arc bending. In those cases, the associated short-time stan-dard deviation on observation window of 4 s peaks is at least at 2 V.
3) In between are intermediate cases: arc bending can be detected but the light variation stays low. Those situations correspond to a minimum of standard deviation always greater than 200 mV, but never greater than 2 V.
It was sometimes observed that the lamp envelope switched quickly between two stable values. This is why it is important
Fig. 13. Voltage envelope waveform in Philips MH lamp. (a) Voltage envelope atf = 12.5 kHz and f = 10.5 kHz (51 measurement points at each frequency). (b) Voltage envelope atf = 12.5 kHz and f = 10.5 kHz during 4 s.
to perform standard deviation computation on short timescales and monitor it on wider observation window.
As commented previously, the rms value alone is not sufficient to detect AR as different combinations of dc power supply and frequency may result in values that are not significantly different. To summarize, in AR case, the standard deviation of the voltage rms value and its fluctuations are order of magnitude greater than in the no AR case. The proposed new criterion can therefore provide in real time a quantitative evaluation of the AR presence and severity level.
E. Future Work and Perspectives
Our ongoing developments deal with a fast-online AR detec-tion based upon voltage envelope monitoring directly embed-ded into the electronic ballast with a few simple ICs and passive components, coupled with the ballast electrically programmable logic device.
TABLE IV
VOLTAGEENVELOPESTANDARDDEVIATIONS INDIFFERENTMH LAMPS
STD (V) Lamp and operation situation No AR f (kHz) AR levels f (kHz)
Osram (at lower power) 1.1e-3– 7.7e-3 11.8 Slight 0.8–1.8 15.2 1.1 e-3– 1.4e-2 11.7 0.4–1.4 15.3 GE 1.1e-3– 3.3e-2 10.7 Slight 0.2–0.9 15.5 1.1e-3– 2.2e-2 10.6 0.7–0.9 15.6 Philips 2.0e-3– 6.2e-2 10.5 Serious 0.8–8.0 12.5 2.3e-3– 3.1e-2 10.4 4.0–9.0 12.5
Osram (at higher power) 1.1e-3– 1.1e-2 11.8 Serious 0.5–3.0 15.2 1.3e-3– 1.3e-2 11.7 0.7–4.5 15.3
The presented results show that the voltage envelope varia-tions are linked with AR phenomenon in MH lamps. Further-more, detecting level crossing implies to evaluate the rms value with a resolution of around 50 mV on a full scale of 100 V. This corresponds to a numerical resolution of 12 bits with a sampling rate of 125 ms.
However, lock-in amplifier is an expensive device that can-not be routinely associated to lamps operating. Other options to achieve the same results are f.i. to monitor the voltage en-velope through synchronous multiplication or peak detection using a rectifier circuit. The multiplier circuit uses the same principle as presented in Fig. 3. The rectifier circuit is much simpler, containing only two amplifiers and an RC low-pass filter. The assessment of both options is currently under re-view. These two kinds of circuit’s present similar sensitivity compared to the lock-in amplifier, but at much lower cost and volume.
V. CONCLUSION
This paper proposes to use the voltage envelope characteriza-tions in order to quantify in real time the AR phenomena in MH lamps. Statistical methods have shown that voltage envelope variations exhibit significantly different patterns in response to AR levels. A new criterion classifying AR levels is therefore defined, based upon the level of the voltage envelope standard deviation. A threshold of 200 mV seems to be the border be-tween no AR and slight AR coupled to observable optical phe-nomenon. Furthermore, some oscillation patterns only appeared in aged lamps, leading to the possibility to use this method as a health monitoring tool of the lamp lifetime.
This approach is currently under development in order to implement the measurement and detection of envelope standard deviation directly on the ballast board. This way, real-time
control could be achieved, leading to the use of MH lamps at higher frequencies with AR avoidance.
ACKNOWLEDGMENT
This design and basic experiment has been achieved in the Laboratory on Plasma and Conversion of Energy (LAPLACE), Toulouse, France.
REFERENCES
[1] K. Stockwald, H. Kaestle, and H. Ernst, “Highly efficient metal halide HID systems with acoustically stabilized convection,” IEEE Trans. Ind.
Appl., vol. 50, no. 1, pp. 94–103, Feb. 2014.
[2] R. Redl and J. D. Paul, “A new high-frequency and high-efficiency elec-tronic ballast for HID lamps: Topology, analysis, design, and experimental results,” in Proc. Appl. Power Electron. Conf. Expo., Mar. 1999, vol. 1, pp. 486–492.
[3] R. L. Steigerwald, “A comparison of half-bridge resonant converter topologies,” IEEE Trans. Power Electron., vol. 3, no. 2, pp. 174–182, Apr. 1988.
[4] C. Blanco et al., “A discharge lamp model based on lamp dynamic con-ductance,” IEEE Trans. Power Electron., vol. 22, no. 3, pp. 727–734, May 2007.
[5] W. Kaiser, R. P. Marques, and A. F. Correa, “An alternative optical method for acoustic resonance detection in HID Lamps,” in Proc. IEEE IAS Annu.
Meeting, Oct. 2009, pp. 1–6.
[6] L. Chhun, P. Maussion, S. Bhosle, and G. Zissis, “Characterization of acoustic resonance in a high-pressure sodium lamp,” IEEE Trans. Ind.
Appl., vol. 4, no. 2, pp. 1071–1076, Dec. 2010.
[7] H. Peng, S. Ratanapanachote, P. Enjeti, L. Laskai, and I. Pitel, “Evaluation of acoustic resonance in metal halide (MH) lamps and an approach to detect its occurrence,” in Proc. IEEE IAS Annu. Meeting, Oct. 1997, vol. 3, pp. 2276–2283.
[8] A. Burgio and D. Menniti, “HID lamp acoustic resonance detection: A simple current-based method using sample-hold circuits,” in Proc. Int.
Conf. Environ. Elect. Eng., May 2011, pp. 1–4.
[9] H. L. Witting, “Acoustic resonances in cylindrical high-pressure arc dis-charges,” J. Appl. Phys., vol. 49, no. 5, pp. 2680–2683, Jun. 1978. [10] F. Afshar, “The theory of acoustic resonance and acoustic instability in
HID lamps,” LEUKOS, J. Illum. Eng. Soc. North Amer., vol. 5, no. 1, pp. 27–38, Sep. 2008.
[11] F. Afshar, “Allowed level of the power ripple in low frequency square wave ballast of metal halide lamps,” LEUKOS, J. Illum. Eng. Soc. North
Amer., vol. 3, no. 2, pp. 143–157, Oct. 2006.
[12] J. C. A. Anton et al., “An acoustic resonance band detection workbench for HID lamps,” IEEE Trans. Ind. Appl., vol. 43, no. 5, pp. 1191–1198, Mar. 2011.
[13] J. Yan, S. Miaosen, L. Hua, and Q. Zhaoming, “An adaptive acoustic resonance free electronic ballast for HID lamps,” in Proc. IEEE IAS Annu.
Meeting, Oct. 2003, vol. 2, pp. 1020–1024.
[14] S. Moo, C. K. Huang, and Y. N. Hsiao, “High-frequency electronic ballast with auto-tracking control for metal halide lamps,” in Proc. IEEE IAS
Annu. Meeting, Oct. 2003, vol. 2, pp. 1025–1029.
[15] R. Sch¨afer and H. Stromberg, “Investigations on the fundamental longitu-dinal resonance of high pressure discharge lamps,” J. Appl. Phys., vol. 53, pp. 3476–3480, 1982.
[16] H. Stromberg and R. Sch¨afer, “Excitation of acoustic instabilities in dis-charge lamps with pulsed supply voltage,” Lighting Res. Technol., vol. 15, no. 3, pp. 127–132, 1983.
[17] C. S. Moo, C. K. Huang, and C. Y. Yang, “Acoustic-resonance-free high-frequency electronic ballast for metal halide lamps,” IEEE Trans. Ind.
Electron., vol. 55, no. 10, pp. 3653–3660, Apr. 2008.
[18] F. Lei, P. Dupuis, O. Durrieu, G. Zissis, and P. Maussion, “Acoustic reso-nance detection using statistical methods of voltage envelope characteriza-tion in metal halide lamps,” in Proc. IEEE IAS Annu. Meeting, Oct. 2016, pp. 1–7.
[19] J. M. Alonso, C. Blanco, E. Lopez, A. J. Calleja, and M. Rico, “Analysis, design, and optimization of the LCC resonant inverter as a high-intensity discharge lamp ballast,” IEEE Trans. Power Electron., vol. 13, no. 3, pp. 573–585, May 1998.
[20] [Online]. Available: http://www.ni.com/getting-started/labview-basics/ environment
[21] Y. C. Hsieh, C. S. Moo, H. W. Chen, and M. J. Soong, “Detection of acoustic resonance in metal halide lamps,” in Proc. IEEE Int. Symp. Ind.
Electron., Jun. 2001, vol. 2, pp. 881–885.
[22] J. Correa, M. Ponce, J. Arau, M. Sanchez, and J. M. Alonso, “Evaluation of frequency modulation techniques to avoid acoustic resonances in elec-tronic ballast for HID lamps: Analysis and methodology,” in Proc. IEEE
Power Electron., Oct. 2004, vol. 10, pp. 245–250.
Fang Lei received the M.S. degree in control
engi-neering from Xi’an Shiyou University, Xi’an, China, in 2014. She is currently working toward the Ph.D. degree with the National Polytechnic Institute (INP) of Toulouse, Toulouse, France and the Laboratory of Plasma and Conversion of Energy (LAPLACE), Uni-versity of Toulouse, Toulouse.
Her research interests include electronic ballasts, and the detection and avoidance of acoustic resonance phenomenon in high intensity discharge lamps.
Pascal Dupuis (S’88–M’09–SM’17) received the
M.Sc. degree in electrical engineering and the Ph.D. degree in applied sciences from the Louvain School of Engineering, Louvain-la-Neuve, Belgium, in 1989 and 2001, respectively.
From 2002 to 2006, he was a Postdoc-toral Researcher at Katholieke University Leuven, Leuven, Belgium. From 2006 to 2012, he was a Senior Researcher at the Louvain School of Engi-neering. In 2012, he joined Paul Sabatier University, Toulouse, France, as a Development Engineer. His background includes measurements in a wide sense, for which he applied sta-tistical approaches to validate data extracted from raw measurements in various contexts, where a priori information about the system behavior or evolution was not available. He is currently working on lighting systems in a wide sense, including power supplies, conversion efficiency, photometric and colorimetric properties, aging concerns, and environmental and health impacts.
Olivier Durrieu has been a Technician with
the Plasma and Energy Conversion Laboratory (LAPLACE), National Polytechnic Institute (INP) of Toulouse, Toulouse, France, since 1997. He is cur-rently an Electronics Board Designer and a Prototype Maker for the teaching and research with LAPLACE.
Georges Zissis (SM’06) received the M.Sc. and
Ph.D. degrees in plasma science from Paul Sabatier University, Toulouse, France, in 1987 and 1990, respectively.
He is currently a Full Professor with Paul Sabatier University, and the Director of the Light and Mat-ter Research Group with the laboratory of plasma and conversion of energy (LAPLACE), Toulouse. His primary area of work is in the field of light sources science and technology. His research inter-ests include the physics of electrical discharges used as light sources; system and metrology issues for solid-state lighting systems; normalization and quality issues for light sources; impact of lighting to en-ergy, environment, quality of life, health, and security; interaction between light source and associated power supply; and illumination and lighting.
Dr. Zissis received the Energy Globe Award for France in 2009, and the Fresnel Medal from the French Illuminating Engineering Society. In 2011, he was named Professor Honoris Causa at Saint Petersburg State University (Russian Federation). He is the President-Elect of the IEEE Industrial Applica-tion Society for the period 2017–18.
Pascal Maussion (M’11) received the M.Sc. and
Ph.D. degrees in electrical engineering from the National Polytechnic Institute (INP) of Toulouse, Toulouse, France, in 1985 and 1990, respectively.
He is currently a Full Professor with the Laboratory of Plasma and Conversion of Energy (LAPLACE), University of Toulouse, Toulouse. He was the Head of the Control and Diagnostic Research Group, LAPLACE, for ten years, and is currently the Vice President of the INP Toulouse for International Affairs. His research interests include control and di-agnostic of electrical systems such as power converters, drives and lighting, and with the design of experiments for optimization in control and diagnostics.