HAL Id: hal-02902604
https://hal.archives-ouvertes.fr/hal-02902604
Submitted on 28 Oct 2020
HAL is a multi-disciplinary open access
archive for the deposit and dissemination of
sci-entific research documents, whether they are
pub-lished or not. The documents may come from
teaching and research institutions in France or
abroad, or from public or private research centers.
L’archive ouverte pluridisciplinaire HAL, est
destinée au dépôt et à la diffusion de documents
scientifiques de niveau recherche, publiés ou non,
émanant des établissements d’enseignement et de
recherche français ou étrangers, des laboratoires
publics ou privés.
Retrieval of atmospheric properties and surface
bidirectional reflectances over land from
POLDER/ADEOS
M. Leroy, J. Deuzé, F.M. Bréon, O. Hautecoeur, M. Herman, J. Buriez, D.
Tanré, S. Bouffiès, P. Chazette, J. Roujean
To cite this version:
M. Leroy, J. Deuzé, F.M. Bréon, O. Hautecoeur, M. Herman, et al..
Retrieval of atmospheric
properties and surface bidirectional reflectances over land from POLDER/ADEOS. Journal of
Geo-physical Research: Atmospheres, American GeoGeo-physical Union, 1997, 102 (D14), pp.17023-17037.
�10.1029/96JD02662�. �hal-02902604�
JOURNAL OF GEOPHYSICAL RESEARCH, VOL. 102, NO. D14, PAGES 17,023-17,037, JULY 27, 1997
Retrieval of atmospheric properties and surface bidirectional
reflectances over land from POLDER/ADEOS
M. Leroy,
• J. L. Deuz•, 2 F. M. Br•on, 30. Hautecoeur,
• M. Herman,
2 J. C. Buriez,
2
D. Tanrfi,
2 S. Bouf-fi•s,
3 P. Chazette,
3 and J. L. Roujean
4
Abstract. Polarization and Directionality of the Earth's Reflectances (POLDER) is a
new instrument devoted to the global observation of the polarization and directionality of
solar radiation reflected by the Earth-atmosphere system. It will fly onboard the ADEOS
platform in 1996. This paper outlines the improvements expected from POLDER in the
description of atmospheric aerosols and water vapor over land, and of surface
bidirectional reflectances. It then gives a detailed description of the operational algorithms
which are implemented in the "land surface and atmosphere over land" processing line.
This line is part of an effort initiated by Centre National d'Etudes Spatiales
(the French
Space Agency) to develop lines of products
in order to facilitate the exploration
of
POLDER's new capabilities by the international science community. Emphasis is given in
this paper to the presentation of the principles, physical rationale, and elements of
validation
of the algorithms
of this processing
line. The main products
are (1) for each
orbit segment,
the amount and type of aerosols,
the water vapor content, and bidirectional
reflectances
corrected
for atmospheric
effects, and (2) every 10 days, global maps of
surface directional signatures, of hemispherical surface reflectances, and of parameters
describing the statistical distribution of aerosol and water vapor content. These products
will be made available to all interested investigators. The most innovative algorithms of
the processing
line are (1) cloud detection,
based on a series
of tests involving
reflectance
thresholds, oxygen pressure estimates, and analysis of polarized radiance in the rainbow
direction, (2) retrieval of aerosol optical thickness
and type from directional polarized
radiance measurements,
and (3) retrieval of surface directional signature
through an
adjustment of a time series of directional reflectance measurements with a semiempirical
bidirectional reflectance model.
1. Introduction
Before the end of the century, a series of Earth-orbiting satellites will carry several advanced, well-calibrated instru-
ments designed to provide global observations of the Earth's
oceans, land, and atmosphere. Among them, Polarization and
Directionality of the Earth's Reflectances (POLDER) is a new
instrument devoted to the global observation of solar radiation
reflected by the Earth surface-atmosphere system. Two iden-
tical versions of this instrument will fly on the Japanese Ad-
vanced Earth Observing Satellite (ADEOS) platforms sched-
uled for launch in 1996 and 1999. In order to facilitate the
exploration of POLDER new capabilities by the international
science community, Centre National d'Etudes Spatiales (CNES) has initiated an effort aiming at the development of
processing lines of science products. Three lines are developed
1Centre d'Etudes Spatiales de la Biosphere, Unit6 Mixte Centre
National d'Etudes Spatiales/Centre National de la Recherche Scienti- fique/Universit6 Paul Sabatier, Toulouse, France.
2Laboratoire d'Optique Atmosph6rique, USTL-Centre National de
la Recherche Scientifique, Villeneuve d'Ascq, France.
3Laboratoire de Mod61isation du Climat et de l'Environnement,
Commissariat h l'Energie Atomique/Saclay, Gif-sur-Yvette, France.
4Centre National de Recherches en M6t6orologie, M6t6o-France,
Toulouse, France.
Copyright 1997 by the American Geophysical Union. Paper number 96JD02662.
0148-0227/97/96JD-02662509.00
(1) land surfaces and atmosphere over land, (2) ocean color
and aerosols over ocean, and (3) Earth radiation budget, water
vapor, and clouds. The products will be processed operation-
ally in the Toulouse center of CNES and made available to all interested scientific investigators. The "land surface and atmo-
sphere
over land" processing
line, which
is the subject
of this
paper, is designed to support the science objectives related to
the monitoring of land surfaces, as well as atmospheric aerosols
and water vapor over land.
Aerosols have a large effect on the Earth radiation budget both directly, by modifying the Earth's albedo, and indirectly, by playing an important role in the formation of condensation
nuclei which trigger cloud formation [Charlson et al., 1992].
Also, aerosols over land may affect vegetation growth [Swap et
al., 1992]. The cycling of the aerosols, that is, aerosol sources, transport in the atmosphere, and sinks, is of interest in various fields of science, e.g., desertification, pollution, and biogeo- chemical cycles. A quantitative assessment of .the aerosol ef- fects on the Earth's climate and environment and, in particu-
lar, that of anthropogenic aerosols requires a global mapping
of the type and concentration of tropospheric aerosols.
Atmospheric water vapor is a key climatologic variable be-
cause of its capacity to drive energy exchanges between the
ocean and atmosphere and within the atmosphere by releasing
latent heat. Moreover, of all atmospheric gases, water vapor
exhibits the largest spatial and temporal variations and has the potential to drive a large positive feedback in global warming
scenarios [Rind et al., 1991]. Accurate global mapping of at-
17,024 LEROY ET AL.: ATMOSPHERIC PROPERTIES AND SURFACE REFLECTANCES
Table 1. Characteristics of POLDER Channels
Central
Wavelength, Bandwidth, Dynamic
nm nm Polarization Range Main Mission 443 20 no 0.05-0.22 443 20 yes 0.05-1.1 490 20 no 0.034-0.17 565 20 no 0.019-0.11 670 20 yes 0.013-1.1 763 10 no 0.007-1.1 765 40 no 0.007-1.1 865 40 yes 0.007-1.1 910 20 no 0.007-1.1 Ocean color
Vegetation, aerosols, Earth radiation budget
Ocean color Ocean color
Vegetation, aerosols, Earth radiation budget Cloud top pressure
Vegetation, aerosols, cloud top pressure Vegetation, aerosols, Earth radiation budget Water vapor amount
The dynamic range is expressed in reflectances for the Sun at zenith.
mospheric water vapor is an important objective of the Global
Energy and Water Cycle Experiment (GEWEX) program. The monitoring of land surfaces is another major science
objective, stressed by the International Geosphere-Biosphere
Program (IGBP). It is necessary to identify precisely the major
biomes on the surface of the planet and to be able to detect
changes in their composition or mapping, due either to anthro-
pogenic or climatic causes. Deforestation and desertification
are among the most critical and timely issues of land cover
change. Land monitoring from space is also a key methodolog-
ical step to understanding and modeling the general function-
ing of the terrestrial biosphere system, i.e., vegetation growth, maturity, and decay, at regional or global scales [Fung et al.,
1987; Ruimy et al., 1994]. Finally, land surfaces are a major
component of the climate system. Land monitoring can pro-
vide valuable information on the boundary conditions that
should be specified in general circulation models (GCM) to
describe accurately the exchanges of mass, momentum, and
energy at the biosphere-atmosphere interface [Dickinson,
1984; Sellers et al., 1994].
The POLDER data should provide a valuable contribution to these different issues. The scientific processing applied op- erationally to the data is a key issue to meeting this scientific challenge. The goal of this paper is to present the principles of the "land surface and atmosphere over land" processing line, the physical rationale of its algorithms, and the elements of
validation of these algorithms when available. Sections 2 and 3
of the paper summarize the main characteristics of the POLDER instrument concept and outline the potential con-
tributions of the POLDER products in the field of atmospheric
properties over land, and land surface monitoring. Section 4
then presents a general overview and a detailed description of
the algorithms and products of the processing line. Note that
the framework and goals of this processing line have some
similarities with those of the lines of products related to the
atmosphere [King et al., 1992] and to the surface [Running et
al., 1994] developed together with the moderate-resolution
imaging spectroradiometer (MODIS) instrument.
2. Instrument Characteristics
The POLDER instrument is described extensively by De-
schamps e! al. [1994]. The description is briefly summarized
here. POLDER is composed of a bidimensional CCD matrix,
a rotating wheel that carries filters and polarizers, and a wide (114 ø) field of view lens. The field of view seen by the CCD matrix is ___43 ø along track and ___51 ø across track. The pixel size
on the ground at nadir is 6 x 7 km 2 for the ADEOS altitude of
800 km. The rotating wheel carries filters which allow spectral
measurements at eight different wavelengths. The spectral
bands are described in Table 1. One image of each spectral
band is acquired every 19.6 s. The bands at 490 and 565 nm are used with a low dynamic range (see Table 1) and are thus
unused over land surfaces where they will saturate frequently.
There is a large overlap between successive images. A surface
target is viewed up to 14 times during the satellite overpass with various viewing angles. Thus the POLDER instrument concept allows sampling of the bidirectional reflectance distri- bution function (BRDF). The directional configuration
changes each day owing to orbital shift on successive days.
Thus, after a few days, assuming cloud-free conditions, the
successive orbits provide a complete description of the BRDF,
in the limits of the instrument field of view.
Three of the channels (443, 670, and 865 nm) also measure
the linear polarization of the incident light. This is achieved by
three measurements with polarizers turned by steps of 60 ø. A
combination of the three measurements yields the Stokes pa-
rameters I, Q, U, from which the total radiance L = I, the
polarized
radiance
Lpo
1 -- (Q2 q_
U 2) 1/2,
and
the direction
of
polarization may be deduced. Radiative transfer simulations
and experimental evidence show that the polarization is mostly
linear for natural targets (the fourth Stokes parameter V is very small compared to the other three), so that the triplet (I, Q, U) is sufficient to describe the polarization of reflected sunlight.
The expected radiometric resolution, in terms of noise
equivalent differential reflectance (NeDR) at the top of the
atmosphere,
is better
than 5 x 10
-4 (with the Sun at zenith)
for the bands used for land surface monitoring. The objectives of multiangular, multispectral, multitemporal, and absolute ra-
diometric calibration accuracies are 1%, 1%, 2%, and 2-3%,
respectively, for these bands [Deschamps et al., 1994]. As for
the geometry, the multipolarization, multispectral, multiangu-
lar, and multitemporal geometric registrations should be better
than 0.1, 0.1, 0.2, and 0.3 pixel, respectively. These perfor-
mances are needed for accurate derivation of the polarized radiance, polarization direction, BRDF, and vegetation spec- tral indices.
3. Contributions of POLDER 3.1. Tropospheric Aerosols Over Land
Global monitoring of tropospheric aerosols remains a chal-
LEROY ET AL.: ATMOSPHERIC PROPERTIES AND SURFACE REFLECTANCES 17,025
the top of the atmosphere (TOA) reflectance is generally much
smaller than the surface contribution. Different possibilities of aerosol monitoring exist, however. For example, Kaufman and Sendra [1988] have shown that the aerosol contribution to the
reflectance can be determined when the surface reflectance is
low, which is the case over dark, dense vegetation in the blue (443 nm) and in the red (665 nm). However, the usual vege- tation indices may be inadequate for the selection of dense
vegetation pixels because of the perturbation of these indices
by aerosol scattering. A possibility is to base the selection on
observations at longer wavelengths (2.1 or 3.7 /xm) that are
much less affected by aerosol scattering (except for dust) and
are still sensitive to the surface characteristics [Kaufman and
Tanr•, 1996]. Algorithms assuming that the surface is invariant
have been also used for multitemporal studies. If the surface reflectance is stable, the temporal evolution of the satellite signal is related to the temporal evolution of the aerosol con- tent [Fraser et al., 1984; Kaufman et al., 1990]. The retrieval of
the aerosol optical thickness may be achieved also from the
contrast degradation [Tanr• et al., 1988; Holben et al., 1992] over ground targets exhibiting both a high temporal stability
and a large spatial heterogeneity, such as some desert areas.
Aerosol events may also be detected over desert areas by using
infrared imagery [Legrand et al., 1988, 1989], since the radiative
temperature of the atmosphere-surface system is affected by
the presence of a dust aerosol layer.
These methods, although powerful over specific areas, can-
not be used for global analysis without crude interpolation
schemes. Moreover, a shortcoming of the methods that use a
single directional reflectance measurement to derive aerosol parameters is that the observation is only sensitive to the prod- uct of the aerosol phase function and the aerosol optical thick- ness. Thus an assumption is needed on the aerosol phase
function if the optical thickness is to be estimated.
The information provided by POLDER will permit the de-
velopment of a new approach to retrieving the aerosol loading
at a global scale and providing some indication of aerosol type
[Herman et al., this issue]. The principle of this approach is that
the main contribution to the TOA polarized radiance at short
wavelengths is due to the aerosols and molecules of the atmo-
sphere, while the contribution of the surface is generally smaller and less variable than that of the aerosols. The contri-
bution of atmospheric molecules, although significant at short
wavelengths, is nearly invariant and can be easily modeled.
That of the surface is more variable, but experimental evidence
shows that it can be modeled with some confidence at least for
dense vegetation cover [Rondeaux and Herman, 1991] or for
bare soils [Br•on et al., 1995]. Thus the aerosol contribution to
the polarized radiance can, in principle, be extracted from the
measurement. For typical aerosol optical thickness, this con-
tribution is approximately proportional to the product of the
aerosol optical thickness ra and of the aerosol polarized phase
function, which depends on the observation geometry primar-
ily through the scattering angle 19. Thanks to the bidirectional
capabilities of POLDER, retrievals of this product in different
directions are possible. The magnitude of the aerosol contri-
bution is related to the aerosol optical thickness, while the
detailed shape of the angular variations of the polarized radi- ance is related to the aerosol polarized phase function. The latter should, in turn, permit the discrimination of various
types of aerosols, characterized by their refractive index and
size distributions.
Global mapping of aerosol content and type will be useful in
several respects. The impact of atmospheric aerosols on the
Earth's radiative budget has been demonstrated. They directly
perturb the radiative budget by their scattering and absorption
of sunlight [Coakley and Cess, 1985]; they modify the cloud
microphysics by acting as cloud condensation nuclei, and as a
result, they also impact cloud radiative properties [Twomey et
al., 1984]. As POLDER observes the same pixel under differ-
ent viewing angles and in several spectral channels, the anisot-
ropy of the reflected radiation field is directly measured. Thus
the determination of the reflected solar flux from satellite will
be more accurate, and a better assessment of the impact of
aerosols on the radiative budget is expected. In-cloud pro- cesses modify the aerosol size distribution, as shown by Hoppel et al. [1990], with an increase of aerosol size due to a coagu-
lation process. POLDER gives a good opportunity to study this
feedback by connecting the cloud albedo to the concentration
and size distribution of aerosols surrounding the clouds. Kauf- man and Nakajima [1993] performed such a study using ad- vanced very high resolution radiometer (AVHRR) data with smoke particles emitted by biomass burning in the Amazon Basin.
Aerosol particles also make an important contribution to
many biogeochemical cycles. Estimation of dust deposition, for
instance, should be possible with POLDER, since the main uncertainty comes from the aerosol size distribution [Fraser, 1976; Dulac et al., 1992].
3.2. Precipitable Water Vapor Over Land
Thanks to the SSM/I data (microwave measurements by the
special sensor microwave imager onboard the U.S. Defense Meteorological Satellites Program platforms), precipitable wa- ter is reliably retrieved over the oceans, where the surface microwave emissivity is well known. This method cannot be
applied over land because of the land emissivity variability.
Over land, infrared sounders like Tiros N operational vertical
sounder (TOVS) are able to retrieve the water vapor profile
from the atmospheric temperature profile. However, the re-
sulting accuracy may be very poor in regions where most of the
water vapor is concentrated in the lower atmospheric layers,
like in Sahelian regions [Holben et al., 1990; Justice et al., 1991].
Precipitable water vapor can also be derived from conventional
radiosoundings by vertically integrating pressure and relative
humidity profiles, but radiosoundings are, unfortunately, sparse and unevenly distributed over the globe.
POLDER provides a new opportunity to retrieve the total
atmospheric water vapor amount on a daily basis with a com-
paratively high spatial resolution (20 km). The method uses a
differential absorption technique [Frouin et al., 1990; Gao and
Goetz, 1990; Kaufman and Gao, 1992] that exploits measure- ments collected by the 9!0-nm channel centered on a water
vapor absorption band. The radiances measured at this wave-
length are compared to those measured at 865 nm, where the water vapor absorption is very weak. The ratio of these two radiances is related to the atmospheric water vapor amount.
Although some uncertainties in this approach result from aero-
sol scattering and surface reflectance variations between the
two wavelengths, global accuracies of the order of 10% are
expected [Bouffibs et al., 1995] (see section 4.5 below).
The water vapor products of POLDER will not be available
in real time, and therefore an assessment of the potential
impact of these products on weather forecasting in a fully operational context is not possible at present. On the other hand, the validation of water vapor retrieval over land from
17,026 LEROY ET AL.: ATMOSPHERIC PROPERTIES AND SURFACE REFLECTANCES
POLDER using sunphotometer network will permit an evalu-
ation of the validity of the differential absorption technique. It
will then be interesting to determine experimentally whether
the real-time availability of POLDER data could improve
short-term weather forecasts. In the long term, this may pro-
mote the use of a similar instrument for operational weather forecasting.
3.3. Bidirectional Surface Reflectances
Towards accurate, frequent measurements of surface reflec-
tance. Monitoring of terrestrial vegetation from satellites at
global or regional scales requires accurate and frequent mea-
surements of surface reflectance. The key improvement brought by POLDER in this context will be to provide, at high
temporal repetitiveness, measurements of surface reflectance
corrected for atmospheric effects and brought to the same
directional standard.
Directional effects are a major source of perturbations for
land surface monitoring. They are intrinsically related to the
desired high repetitiveness of observations. A given pixel is
seen under very different view angles in successive observa-
tions from a polar orbiting satellite, or under different Sun
angles from a geostationary platform. Temporal variations of
the measurements of AVHRR resulting from changes in the
observation geometry have a strong amplitude, typically 50-
100% of the average signal [Gutman, 1987; Roujean et al., 1992a].
The atmosphere is another major source of perturbations in
land surface sensing. While the part of the signal due to atmo-
spheric molecule scattering can be predicted with sufficient accuracy, the variations of absorbing gases and aerosols at fine
temporal and spatial scales can induce severe fluctuations of
the signal measured by the sensor. Choosing appropriate spec-
tral bands permits either the obtention of a signal insensitive to
absorbing gases, or the retrieval of some information on these
gases that allows a correction of their influence on the ob- served signal (see section 3.2). The part of the signal due to aerosols is generally much more difficult to correct (see section 3.1). For example, the uncertainties in the correction of aerosol effect are of the same order of magnitude as the surface re- flectance for vegetated areas in the visible [e.g., Tanr• et al., 1992; Kaufman and Tanr•, 1996].
Thus the processing of AVHRR observations requires the
composition of a time series of measurements to simulta-
neously minimize atmospheric and directional effects, and also
the effects of poor cloud detection. A data-compositing
method widely applied to AVHRR data is the maximum value
composite (MVC) technique [Tarpley et al., 1984]. Its principle
is to select, during a given period of composition, from i week
to i month, the AVHRR data which maximize the normalized
differential vegetation index (NDVI). The MVC technique has
been a standard routine in the context of vegetation monitor-
ing [e.g., Tucker et al., 1985; Justice et al., 1985]. More recent
developments are based either on improvements of the MVC
technique, using more sophisticated data filtering [Viovy et al., 1992], or on correction of directional effects derived from the original data set [Gutman, 1991; Leroy and Roujean, 1994; Wu et al., 1995; Ba et al., 1995].
The accuracy of this latter method should be much higher
with POLDER, which will cover directional space much better
than AVHRR, in particular, in azimuth [Deschamps et al.,
1994]. Consequently, the minimum time period of measure-
ments needed to derive by compositing a measure normalized
for directional effects is expected to be shorter with POLDER
than with AVHRR.
The improvement of atmospheric corrections (with a better
account of aerosols; see section 3.1) and access to highly re-
petitive measurements of surface reflectance corrected for di-
rectional effects with POLDER are expected to improve, at regional and global scales, both land cover studies and net
primary production estimates. Classifications of land cover
types at continental scales which classify coarse resolution pix-
els on the basis of the NDVI temporal signature [Townsbend et
al., 1987] should take advantage of an improvement of the accuracy of observed surface reflectances. Terrestrial net pri- mary production may be derived from an evaluation of the
absorption of photosynthetically active Sun radiation, in turn
related to the NDVI [Prince, 1991; Ruimy et al., 1994; Field et al., 1995]. The limitations of this approach result from the
crude description of the functional link between production
and sensor measurements, but also from perturbating effects in
satellite measurements [Maisongrande et al., 1995].
Directional signature. Another important aspect is that,
after compositing of satellite measurements, the land surface
BRDF will be available at regional and global scales. Several
science products can take advantage of this new signature.
Albedo: The BRDF measurements will permit an estimate
of spectral hemispherical reflectances. This is an important
step forward for the estimation of daily surface albedo, which
plays a key role in water and energy exchanges between surface
and atmosphere. At present, surface albedo is usually specified
rather crudely as a boundary condition in mesoscale meteoro-
logical models and in GCMs. The GCMs generally make use of
land cover classification maps such as those produced by Mat-
thews [1983]. Each vegetation type is assigned morphological,
physiological, and albedo properties from values obtained in
the ecological literature. The information brought by
POLDER can refine significantly at least the estimate of al-
bedo. An inherent limitation here is that integrations in wave-
length over the solar spectrum and in time over the diurnal
cycle are required to obtain a daily average of albedo from the
measured spectral hemispherical reflectances. Empirical rela-
tionships are needed to complete these steps.
Classifications: The directional signature may be thought
of as additional channels, which add to the more conventional
spectral and temporal information. If it is assumed that the
spectral BRDF at the surface is decomposed as a series of n
basic bidirectional functions (this is the choice made in the processing line with n = 3; see section 4.6), then n different pieces of information are available per spectral band instead of i for nondirectional sensors. Thus, in principle, classifications of land cover types can be refined and improved with the directional signature. This is still, however, an exploratory is-
sue. The variability of directional signatures according to the
surface type has to be assessed, and the amount of new infor-
mation brought by these additional variables to be determined.
Vegetation indices: Some thought has been given in recent years to the design of new vegetation indices to minimize various effects (atmosphere, soil reflectance) which disturb the
direct interpretation of spectral reflectances in terms of vege-
tation photosynthetic activity [e.g., Huete, 1988; Kaufman and
Tanrd, 1992]. Conversely, it should be possible to use the di- rectional signature to construct new vegetation indices and semiempirical relations between these improved indices and
biophysical parameters. Optimal viewing directions may be
LEROY ET AL.: ATMOSPHERIC PROPERTIES AND SURFACE REFLECTANCES 17,027
residual inaccuracies in the atmospheric correction. For exam-
ple, Roujean and Br•on [1995] have established theoretically a
semiempirical relation, independent of vegetation type, be-
tween spectral reflectances in a particular viewing configura-
tion, and the daily fraction of absorbed photosynthetically ac-
tive radiation (PAR).
Inversion: An alternative way of using a directional signa-
ture is to attempt its inversion in terms of biophysical param-
eters, using a model of bidirectional reflectance of the surface. Several authors have elaborated tractable, analytical models of the BRDF, so that they could be inverted against observations
[e.g., Verhoef, 1984; Nilson and Kuusk, 1989; Jupp and Strahler,
1991; Verstraete et al., 1990; Kuusk, 1994; Li et al., 1995]. Some of these models were effectively inverted against field data [e.g., Pinty et al., 1990; Deering et al., 1992; Liang and Strahler, 1994]. Inversion of BRDF models against satellite data is still
at a very preliminary stage [Rahman et al., 1993; Jacquemoud et
al., 1995]. The accumulation of directional data in short peri-
ods of time permitted by the POLDER concept should allow the extraction by inversion of significant information on leaf reflectances, leaf area index, and other structural properties of
vegetation canopies. However, the question of the behavior of
the inversion process in the general case of heterogeneous
pixels has not been addressed yet.
In the context of model inversion, two specific directions are of particular interest, namely, the hot spot and specular direc- tions. The so-called hot spot effect, or opposition effect, that is,
the signal enhancement when the Sun and view directions
coincide, has received considerable attention [e.g., Nilson and
Level 1
Cloud detection
TOMS
• Correction
for
ECMWF absorbing gas
ECMWF
•
Correction for stratospheric aerosols Estimate of atmospheric water vapor contentEstim. optical depth and aerosol type
Correction of atmos. molecules effects on clear days -- Level 2 water vapor and tropospheric aerosols
•R
Level
2
eflectances corrected I for molecules on lclear
days
Figure la. Flow chart of POLDER data processing in the
"land surface and aerosols over land" processing line. From
level 1 (TOA geocoded reflectances) to level 2 (geophysical
products generated for each orbit).
from Day- 15 to Day+ 15 from Day- 15 to Day+ 15
Level 2 Reflectances corr. for molecules on clear days Composite of surface reflectances Level 3 surface albedo corrected NDVI BRDF Level 2 water vapor and tropospheric aerosols Composite of atmospheric parameters Level 3
aerosol optical depth
water vapor content
distribution
Figure lb. Same as Figure la, but from level 2 to level 3
(global products at 10 days frequency).
Kuusk, 1989; Jupp and Strahler, 1991; Verstraete et al., 1990].
The POLDER instrument concept is well adapted to the ob- servation of the hot spot, as was demonstrated during the airborne POLDER campaign on the Boreal Ecosystem-
Atmosphere Study (BOREAS) experimental site [Br•on et al.,
1997]. The POLDER measurements on ADEOS will offer the
first opportunity of systematic and global observations of the
hot spot. One may explain the special interest of these mea-
surements by noting that there is a more direct link between
radiative properties of canopy elements (leaves, soil) and the observed reflectance in that particular direction, since shadows
do not contaminate the observed signal. The width of the hot
spot peak is closely related to the structural characteristics of the canopy, such as leaf area index, and ratio (leaf size)/ (canopy height) [e.g., Nilson and Kuusk, 1989].
Another interesting particular geometry is the specular di- rection, for which the signal is a function of the surface wet- ness. This may be particularly interesting for the monitoring of large rice fields of Southeast Asia for example, or of large
wetland areas, acting as sources of methane, in boreal regions
(V. Vanderbilt, personal communication, 1994). Sharp signa-
tures of the BRDF in the specular direction were obtained from rice fields during the airborne POLDER campaign at the La Crau site in 1991 [Leroy and Br•on, 1996].
4. Description of the Processing Line
4.1. Overview
The processing line "land surfaces and aerosols over land" generates level 2 and 3 products from level 1 products. Here, "level 1" stands for geocoded, calibrated components of the
Stokes vector I, Q, U of the radiance field, for the illuminated
part of an orbit. "Level 2" and "level 3" stand for geophysical
products processed for one orbit and at global scale from a
composite of several days of observation, respectively.
Figure 1 shows the overall flow chart of the "land surface and atmosphere over land" processing line. Cloud detection is first applied to the measurements. If the pixel is recognized as clear, a correction for stratospheric aerosols and absorbing gases (03, H20, and 02) is applied to the 443-, 670-, 765-, 865-,
and 910-nm channels. The inversion of atmospheric parame-
17,028 LEROY ET AL.: ATMOSPHERIC PROPERTIES AND SURFACE REFLECTANCES
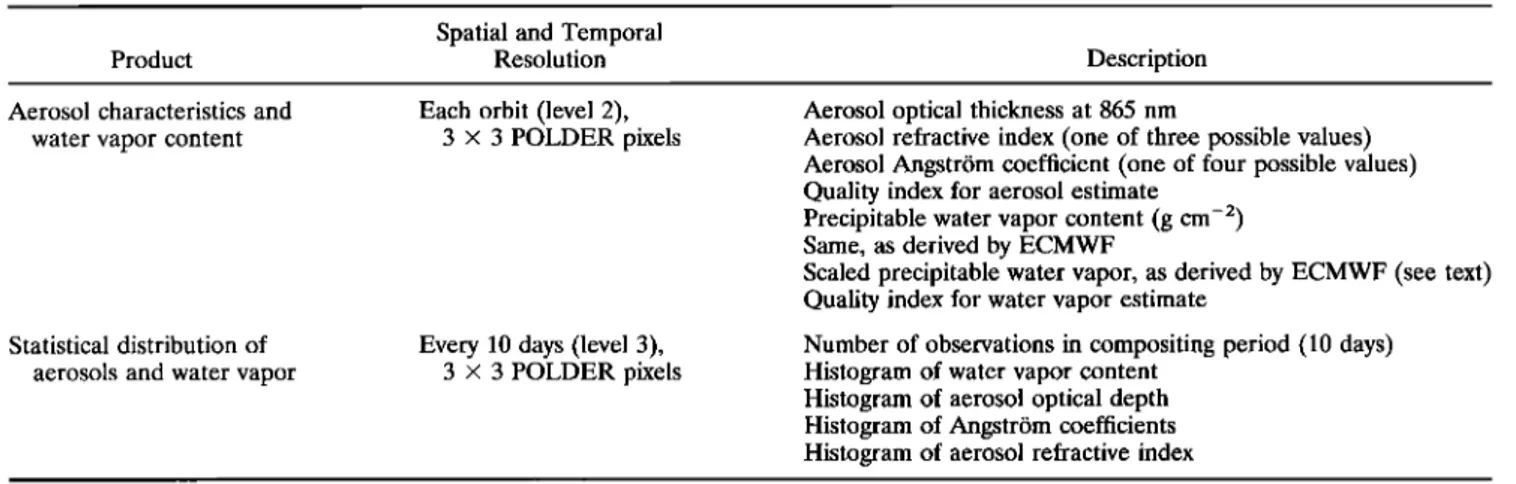
Table 2. Atmospheric Aerosols and Water Vapor Products
Product
Spatial and Temporal
Resolution Description
Aerosol characteristics and
water vapor content
Statistical distribution of aerosols and water vapor
Each orbit (level 2),
3 x 3 POLDER pixels
Every 10 days (level 3),
3 x 3 POLDER pixels
Aerosol optical thickness at 865 nm
Aerosol refractive index (one of three possible values) Aerosol Angstr6m coefficient (one of four possible values)
Quality index for aerosol estimate
Precipitable water vapor content (g cm -2)
Same, as derived by ECMWF
Scaled precipitable water vapor, as derived by ECMWF (see text)
Quality index for water vapor estimate
Number of observations in compositing period (10 days)
Histogram of water vapor content Histogram of aerosol optical depth
Histogram of Angstr6m coefficients
Histogram of aerosol refractive index
rected reflectances, which generates level 2 atmospheric prod-
ucts. An accurate surface reflectance is derived only for nonhazy days: thus, if the retrieved aerosol optical thickness is
smaller than a given value, the directional reflectances are
corrected for molecular scattering and stored as a level 2 prod-
uct. These directional reflectances are subsequently used at
level 3 in a temporal composition of directional reflectances,
which yields spectral hemispherical reflectances and a com-
plete description of the surface BRDF. Level 3 processing also
generates temporal statistics on the retrieved atmospheric pa-
rameters. Tables 2 and 3 give the detailed content of the level
2 and 3 atmospheric and surface reflectance products. The
processing line uses external data from TOMS/ADEOS, for
ozone correction, and from the European Centre for Medium-
Range Weather Forecasts (ECMWF) for water vapor correc-
tion and water vapor retrieval.
4.2. Cloud Detection
Cloud detection is rather difficult with POLDER, in com-
parison with other instruments such as SPOT, AVHRR, or
Meteosat, because of the lack of thermal infrared channels and
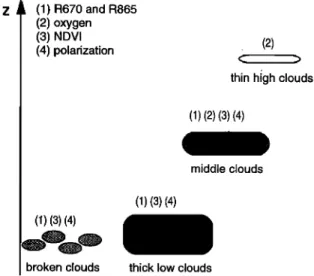
the rather low spatial resolution. The cloud detection strategy
applied to POLDER relies on several complementary princi-
ples, as illustrated in Figure 2. The measured reflectance at 670
and 865 nm is first compared to a threshold value. This thresh-
old varies with space and time and has been derived from an
analysis of a multiannual global vegetation index (GVI) prod-
uct. Similarly, the NDVI from the two spectral measurements
is compared to a threshold which has the same origin. This test
will detect clouds which show a large reflectance contrast with
the surface. The ratio of the 763- and 765-nm measurements is
then used to derive an estimate of the oxygen pressure of the main reflector. This is possible because these channels are centered on the so-called A oxygen absorption band. This pressure is then compared to the surface pressure derived from a digital elevation model at 15-km resolution. Some uncertain- ties result from the surface spectral signature, and the test will only detect medium and high clouds. Finally, when such view- ing directions are available, the algorithm will analyze the polarized reflectance for scattering angles close to 140 ø . At
these angles, liquid clouds show a large polarized reflectance,
which is a clear indication of their presence. This test cannot
detect ice clouds, however.
The tests are applied in sequence to the radiometry of any
given pixel. It is sufficient that one of the tests be positive to declare the pixel cloudy. All tests are applied, and the result of each test is stored for further quality control. Moreover, if one
pixel is declared cloudy after passing the tests, all neighboring
pixels are also declared cloudy. The intention is to discard
pixels contaminated by cloud shadows and to account for the
fact that cloudy areas are generally surrounded by areas with fractional cloud cover. The various cloud tests are described in more detail in the following.
Reflectance and vegetation index thresholds. The princi-
ple of this test is to compare the TOA reflectances observed by
POLDER, to a reference data base of TOA reflectances de-
pending on space and time. This database of reflectances is
Table 3. Surface Reflectance Products
Spatial and Temporal
Product Resolution Description
Surface bidirectional reflectances
Each orbit (level 2),
full resolution
Viewing/illumination geometry Quality indices
Reflectances corrected for atmospheric effects at 443, 670, 765, and 865 nm, for each viewing direction
Hemispherical reflectances Every 10 days, global Median sun zenith angle
and indices (level 3), Composited surface hemispherical reflectances at 443, 670, 765, and 865 nm
full resolution Normalized vegetation index derived from hemispherical reflectances at 670 and 865 nm
Distribution function of bidirectional
reflectances
Every 10 days, global Number of measurements in compositing period
(level 3), Coefficients of BRDF model at 443, 670, 765, and 865 nm
LEROY ET AL.: ATMOSPHERIC PROPERTIES AND SURFACE REFLECTANCES 17,029
derived from AVHRR/GVI data, that is, weekly composites of
AVHRR global area coverage (GAC) reflectance data in the
visible and near-infrared at 15-km resolution. The need for a
database ready at launch made it necessary to use AVHRR
observations rather than those of POLDER. Five years of GVI
data are used to generate the threshold base. The GVI data are
processed as described by Bouffiks and Brgon [1996] with the
objective to eliminate cloudy GVI data and to allow interan- nual variability in the reference data set. The GVI data tem- poral resolution has been reduced to 1 month.
The test is not applied when the ECMWF meteorological
field indicates snow coverage. Among the available measure-
ments for a pixel, the observation with the lowest viewing
zenith angle is selected, in order to reduce the influence of bidirectional effects. Finally, if the reflectances R670 or R865 (or the NDVI derived from R670 and R865) are significantly
larger (lower) than the corresponding quantities of the data-
base, then the pixel is declared cloudy.
O2 apparent
pressure. The apparent
pressure
Papp
is de-
rived from POLDER measurements as
(A
exp
(-13X)
+ G(m,X))
1/2
Papp = P0 m (1)
where Po is the standard pressure (1013 hPa), m is the air mass
factor, 2 2
G ( m , X) = • • a om
iX
7,
i=0 /=0 (2) (RTo A -- Rmol)763m = (RTo
A _ Rmol)765.
(3)
Rmo 1 is the precomputed reflectance due to molecular scat-
tering, and/3 and a ii are known numerical coefficients. Rela- tions (1) and (2) have been derived by Br•on and Bouffi•s
[1996] on the basis of radiative transfer calculations. When
taking into account the instrumental noise and errors due to
variable aerosol loading, the expected accuracy of apparent
pressure estimate is of the order of 100 hPa [Br•on and Bouffi•s, 1996]. If the apparent pressure is significantly smaller than the surface pressure expected in clear conditions, the pixel is declared cloudy.
Polarization signature near the rainbow direction. The
polarized phase function of water droplets shows a large max-
imum for a scattering angle of 140 ø (direction of the rainbow).
Therefore polarized radiance measurements allow an accurate
detection of liquid clouds, as was shown with airborne
POLDER measurements [Goloub et al., 1994]. The test will
analyze the directional signature of the polarized reflectance in directions close to the 140 ø scattering angle. The test will de- clare a pixel cloudy if a local maximum is observed in the predicted direction. The major limitation of this test, apart from the case of ice clouds, is the availability of the needed
viewing geometry among POLDER observations of the pixel.
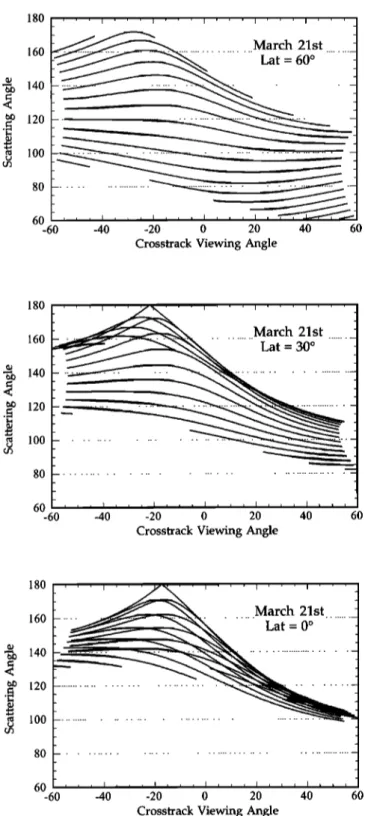
Figure 3 shows a simulation of the range of available scattering
angles that will be observed by POLDER for several northern
latitudes at a given date (March 21). This range varies as expected both with latitude and with the off-nadir viewing
angle in the across-track vertical plane. The pattern of figures
such as that of Figure 3 is roughly symmetrical with respect to
the Equator. If a date other than the equinox is chosen, the pattern of figures is translated in latitude but not substantially
z!
(1) R670
and
R865
(2) oxygen (3) NDVI (4) polarization (1)(3)(4) broken clouds (1) (3)(4) (2)thin high clouds
(1) (2)(3)(4)
middle clouds
thick low clouds
Figure 2. Type of clouds that are expected to be detected by
each of the tests of cloud detection.
modified. Figure 3 and other similar figures show that about 60% of observed pixels satisfy the requirement of availability of 140 ø scattering angles.
The three tests described above involve a series of thresh- olds which are yet to be determined, and which will be tuned
during the validation phase after launch. This validation phase
will also permit one to assess the accuracy of cloud screening once the thresholds are optimally tuned. Several sources of errors may be listed. The test involving a database of reflec- tances and vegetation indices will not be able to account for
interannual variability phenomena. The bands of the AVHRR/
GVI database are not identical to those of POLDER. This
latter drawback can be corrected in a later stage of the pro-
cessing line, by replacing the AVHRR/GVI database by a
database derived from POLDER itself. Subpixel fractional cloud cover will be difficult to detect with any of the imple- mented tests.
4.3. Correction for Stratospheric Aerosol Effects and Gaseous Absorption
The stratospheric aerosol correction module is planned to
handle the case of a large aerosol emission, such as those from
the E1 Chichon or the Pinatubo volcanoes in the recent past. It
is assumed that a few months have passed since the eruption,
so that the stratospheric aerosols have a low influence on the
signal, and may be considered zonally distributed. The optical
thickness used as a function of latitude can be regularly up-
dated from various sources, such as the Stratospheric Aerosol
and Gas Experiment (SAGE) or the existing sunphotometer or
lidar network. For this correction, single scattering is assumed.
The prescribed aerosol phase function will be derived from the
SAGE experiment according to the method of Brogniez et al.
[1996].
Compared to other optical instruments such as AVHRR,
POLDER has relatively narrow bands (between 10 and 40 nm;
see Table 1) which have been chosen to minimize gas absorp-
tion. Except for the 763-, 765-, and 910-nm channels, which are
used as atmospheric probes, gas absorption is relatively weak
(see Table 4), and the correction to be applied is small. The
stratospheric
ozone
column
abundance
Uo3 (cm atm) will be
17,030 LEROY ET AL.' ATMOSPHERIC PROPERTIES AND SURFACE REFLECTANCES 180 160 • 140 < e• 120 .,• lOO 80 6o -60 March 21st Lat = 60 ø -40 -20 0 20 40 60
Crosstrack Viewing Angle
180 160 140 120 100 80 6O -60 March 21st Lat = 30 ø -40 -20 0 20 40 60
Crosstrack Viewing Angle
180 160 140 120 100 80 60 -60 -40 -20 0 20 40 60
Crosstrack Viewing Angle
Figure 3. Simulated range of available scattering angles ac-
quired on one pass, as a function of the off-nadir viewing angle
in the across-track vertical plane, on March 21, for latitudes
60øN, 30øN, and 0 ø.
gcorr = g .... /To• (4)
This simple formulation is possible because the main ozone
layer is located well above the scattering layers. A formulation
similar to (4) is used for the water vapor correction; however,
the transmission
TH2
o is not a direct
transmission
but a total
(direct + diffuse) transmission approximated for each viewing
direction by a second-order polynomial of the R91o/R865 ratio,
the coefficients of which do not depend on the viewing direc-
tion.
A particular treatment concerns the 763- and 765-nm chan-
nels. The reflectance R765 ... that would be measured if there
was no absorption is assumed to be the same in both channels.
The wide band (centered at 765 nm) can be decomposed into
one part including the narrow band (centered at 763 nm),
which is strongly affected by the 02 line absorption, and an-
other one only affected by weak 03 and H20 absorptions.
Therefore the R763 and R765 measured reflectances are linked
by [Parol et al., 1994]
R765 = `4R763 q- (1 - .4)R765,corrTH2oTo3, (5)
where .4 is a constant close to 0.3, which was derived from
line-by-line
simulations.
The ozone
transmission
To3
is param-
eterized
as a function
of m Uo3,
while the water
vapor
trans-
mission
Tx-i2o
is parameterized
as above
as a polynomial
of the
R91o/R865 ratio. Then the reflectance R765 ... is derived from
R763 and R765 measurements by using (5).
4.4. Tropospheric Aerosols
The physical rationale of the algorithm is described in detail by Herman et al. [this issue]. The following concentrates on the
practical aspects of the algorithm implementation. The algo-
rithm is based on the comparison between polarized radiances,
measured at 443, 670, and 865 nm, and precalculated values.
The input polarized radiances are those corrected for strato-
spheric aerosols and gaseous absorption, spatially averaged on areas of size 3 x 3 pixels. The spatial average reduces misreg-
istration effects between the measurements taken by each in-
dividual polarizer in the POLDER instrument. These misreg-
istration effects are more critical with polarized radiances than
with simple radiances, since the Stokes components U and Q,
and also the polarized
radiance
L po
1 involve
differences
be-
tween the radiance measurements (in general much larger
than U or Q) taken by the polarizers. A slight surface heter-
ogeneity, coupled to misregistration effects, induces some
noise in the evaluation of such differences, which can be re-
duced with sufficient averaging.
Table 4. Typical Values of Gaseous Absorption in the
POLDER Channels Used in the "Land Surface and
Atmosphere Over Land" Processing Line
Ozone Oxygen Water Vapor
Channel, Absorption, Absorption, Absorption,
nm % % %
instrument also onboard ADEOS along with POLDER. If, for
some reason, TOMS/ADEOS measurements are not available,
grided data derived from ECMWF meteorological field can be
used with a reasonable accuracy. The transmission of ozone
To3 is precalculated
as a polynomial
function
of m Uo3.
This
precalculation is derived from simulations using a line-by-line
model [Scott, 1974]. The correction then is simply written
443 0.3 0 0.0 670 4.5 0 1.5 763 (narrow) 0.6 41.6 1.4 765 (wide) 0.6 12.4 2.2 865 0.0 0 2.7 910 0.0 0 31.1
These values correspond to a twofold path through the U.S. stan-
LEROY ET AL.: ATMOSPHERIC PROPERTIES AND SURFACE REFLECTANCES 17,031
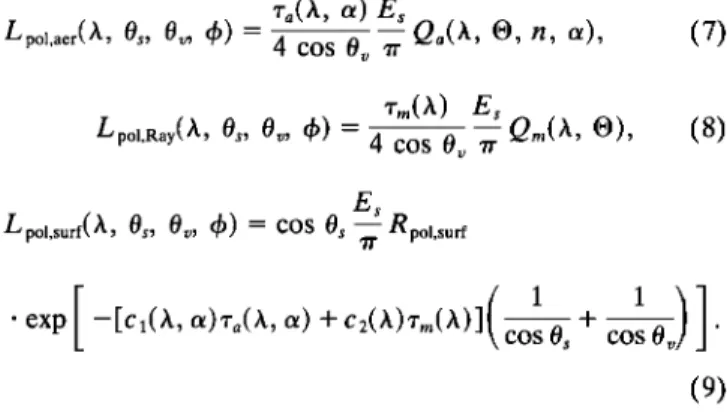
Following the discussion of section 3.1, the measured polar-
ized radiance L po I is modeled as
L pol = L po• .... q- L pol,Ray q- L pol,surf, (6)
that is, the sum
of three contributions:
(1) L po
I ... generated
by aerosol
scattering,
(2) L pol,Ray
, by Rayleigh
scattering,
and
(3) Lpo
• .... f due to the reflection
of sunlight
by the surface,
attenuated by the atmospheric transmission on the down-
welling and upwelling paths. These terms are expressed as
q'a(/•., O/)E,
Lpol
....
()k,
Os,
Ov,
4>)
= 4 COS
0• ,r Qa(A'
•)' n a)
(7)
Tm()k) Es
Lpøl'Ray(/•"
Os'
O
v' 4))=4
cos
0•-• Q
m
( X
' {•
) '
(8)
Es
Lpolsurf(•. Os, Ov, 4))= COS Os--Rpol,surf
[
(1
ß
exp -[c•(X,
O/)Ta(/•.
, O/)
q-
C2(/•.)Tm(/•.)]
COS
O
s
COS(9) In (7)-(9), %(X, a) = (X/865)--aTa865 and Tm(/•. ) are the
optical thicknesses of the aerosols and of the molecules, re-
spectively. Here, q'm(X) is calculated, according to the surface altitude provided by a coarse-resolution digital elevation model. Es is the TOA solar irradiance. Qa (X, ©, n, a) and
Q m(X, O) are precalculated functions, which depend on the
geometric angles Os, Or, 4• only through the scattering angle ©.
Equations (7) and (8) are in the classical form corresponding
to primary scattering approximation, but Q a and Q m are not
just the polarized phase functions for aerosols and molecules.
In order to account crudely for multiple scattering effects, Q a and Qm are calculated as follows. For an average solar zenith
angle
Os
= 45 ø, the TOA polarized
radiance
Lpo
• is calculated
for each aerosol model, for each wavelength, and for the range
of 0•, and 4> covering the POLDER field of view. The calcula- tions are performed for the case of a black ground (so that
Lpol = Lpol
.... q- Lpol,Ray
) and for ra86S
= 0 and ra86s
= 0.20.
Then Q a(X, ©, n, a) and Q m(X, O) are adjusted so that (6)-(8) provide the best adjustment of the results. Q m (X, O) is very close to the molecule polarized phase function for X = 670
and 865 nm, but differs substantially from it at 443 nm, where
single scattering is no longer a good approximation. The func-
tions c • and c2 may also be precalculated. At present, we just
usec• = 0 andc2 = 1.
The aerosol size distributions have been chosen as power
laws, so that Q a depends on the refractive index n and Ang- str6m coefficient a of aerosols. The precalculation of Qa is
made at 443, 670, and 865 nm for 12 aerosol models, which at
present, are characterized by n = 1.33, 1.40, 1.50, and a =
0.5, 1.0, 1.5, 2.0. The choice of this discretization of n and a
results from simulations of aerosol retrieval from the polariza-
tion signal [Herman et al., this issue]. Note that the chosen
models correspond to nonabsorbing aerosols. The choice of
aerosol models will be updated in later stages of the processing
line.
Rpo1
.... f models
the polarized
reflectance
of the surface.
Fol-
lowing the hypothesis that the polarized reflectance is gener-
ated by specular reflectance at the surface, it is considered spectrally neutral. It is modeled for bare soils as [Br•on et al., 1995]
Fv[(w- ©)/2]
Rpo•
....
f(O)
= 4 COS
Os
COS
0v'
(10)
and for vegetated areas as [Rondeaux and Herman, 1991]
Fv[(w- ©)/2]
Rpol
....
f(O)
= 4(COS
Os
+ COS
0v)'
(11)
where Fv(•/) is the polarized Fresnel reflection coefficient for
an incidence angle % In practice, the surface polarized reflec-
tance is a weighted sum of (10) and (11), with weighting coef-
ficients derived from an evaluation of the NDVI, averaged over the available viewing directions.
Equation (6) is solved for the unknown ra865 , for each of the
12 aerosol models, for each available scattering angle, and for
each of the three wavelengths 443, 670, and 865 nm. For each
aerosol model, an average and a dispersion of the resulting
values of ra865 are calculated. The retrieved aerosol model is
that which minimizes this dispersion, and the retrieved ra865 is
the average q'a865 associated to this aerosol model.
A series of tests is made to secure this calculation. First, the
aerosol model is retrieved only if the maximum scattering angle is large enough (typically larger than 140 ø ) because the
signal is sensitive to this parameter mainly in the backscatter-
ing region. The quality of the results is expected to improve as
the available range of scattering angles increases [Herman et
al., this issue]. Figure 3 shows that for the particular date of March 21, the range of variations is about 600-80 ø at latitude 60øN, is always less than 40 ø at the Equator, and even less than 10 ø at this latitude in the eastward part of the orbit. As men-
tioned earlier, if a date other than the equinox is chosen, the
pattern of figures is translated in latitude. Thus some periods and latitudes are more favorable than others for aerosol model inversion.
Moreover, over vegetated pixels (nearly black at 443 nm),
characterized by high NDVI values, a test is made to verify the
consistency between the measured TOA reflectance at 443 nm
and the modeled TOA reflectance:
ra(443, a)Pa(443, ©, n, a) + •'m(443)Pm(©)
mmødel'443
=
4 cos
Os
cos
0v
'
(•2) where P a stand for the aerosol phase function computed with the retrieved values of n and a, and Pm for the molecule phase
function. The aerosol model and optical thickness will not be
retrieved if these two quantities differ too much.
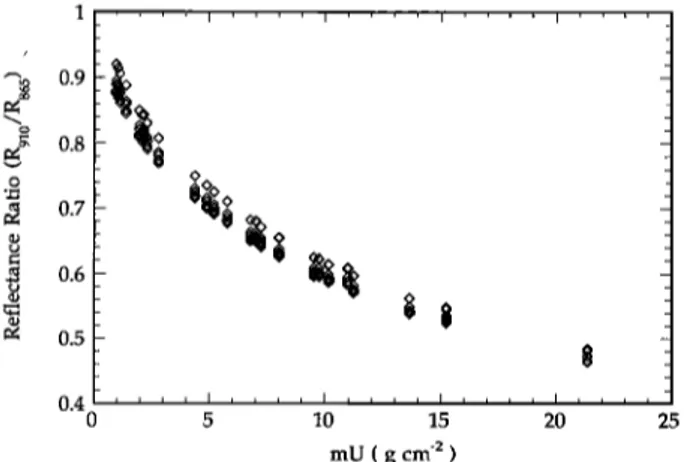
4.5. Precipitable Water Vapor
The precipitable
water
vapor
content
Ui-i2o
(g cm-2)
is de-
rived for each viewing configuration from a precalculated re-
lation between
Ui-i2o
and R9•o/R865.
This relation
proceeds
from simulations of radiative transfer in an absorbing and
scattering atmosphere, where the atmospheric absorption co-
efficient of water vapor is obtained with line-by-line simula-
tions [Bouffibs et al., 1995]. The most important sources of
errors are expected to originate from the coupling between water vapor absorption and atmosphere scattering by mole- cules and aerosols, and from the spectral variations of the
surface reflectance between 865 and 910 nm.
Figure
4 is a scatter
plot of rn Ui-i2o
as a function
of the ratio
R9•o/R865, obtained from simulations made for five different
atmospheric profiles (World Meteorological Organization), 14