8736
Quantitative morphological descriptors confirm
traditionally classified morphotypes of Pentadesma
butyracea Sabine (clusiaceae)
Serge S. Houédjissin 1, Paulin Azokpota 2,3, Assogbadjo Achille 4, Ahanhanzo Corneille*1,
Hounhouigan D. Joseph 2,3
1 Département de Génétique et des Biotechnologies ; Faculté des Sciences et Techniques. Université d’Abomey-Calavi; 01 BP 526 ; Cotonou, Bénin.
2 Laboratoire de Biochimie Microbienne et de Biotechnologie Alimentaires (LMBA), Faculté des Sciences Agronomiques, Université d’Abomey-Calavi; 01 BP 526 ; Cotonou, Bénin.
3 Laboratoire de Biologie Moléculaire et Formulations des Aliments (LAFAB) ; Faculté des Sciences Agronomiques, Université d’Abomey-Calavi; 01 BP 526 Cotonou, Bénin.
4 Laboratoire d’Ecologie Appliquée; Faculté des Sciences Agronomiques, Université d’Abomey-Calavi ; 01 BP 526, Cotonou, Bénin
*1Corresponding author email : Professeur Ahanhanzo Corneille; . [email protected]
Original submitted in on 26th August 2015. Published online at www.m.elewa.org on 30th September 2015
http://dx.doi.org/10.4314/jab.v93i1.7 ABSTRACT
Objective: Pentadesma butyracea is a multi-purpose tree species in Africa with great morphological variability. This study used quantitative descriptors to assess morphological variation of traditionally classified P. butyracea and its relation to ecological conditions.
Methodology and results: 108 trees and 1080 fruits were sampled spanning locally recognized trees morphotypes within four phytodistricts.Six morphological descriptors were measured on the trees and the fruits. Univariate and canonical discrimiant analyses were used to describe variability enters and inside the populations of P. butyracea. These data were supplemented by an evaluation and a modelling of the seeds number per fruit (the principal trait of commercial importance). Principal components analysis (ACP) was carried out to examine ecological influence. The variance components analysis showed substantial variations within morphotypes, suggesting a significant heterogeneity within trees and fruits traditionally classified as belonging to the same morphotypes. Regression equations indicated that fruits length and width are good predictors of seeds yield, although their predictive capacities differ between the phytodistricts. Fruits morphometric variations were significantly correlated with ecological factors. Fruits size (length, width) decreased with temperature, hygrometry and pluviometry increase.
Conclusion and application: The quantitative descriptors made it possible to make precise morphotypes of the various P. butyrarcea trees and to estimate the seeds number per fruit starting from predictive models. This will have positive influence on P. butyracea improvement, conservation and domestication programs in aid of Benin local communities.
Key words: Pentadesma butyracea, morphological variation, indigenous knowledge, Ecological factors, Benin
Journal of Applied Biosciences 93:8736 – 8747
Houédjissin et al. J. Appl. Biosci. 2015 Quantitative morphological descriptors confirm traditionally classified morphotypes of Pentadesma butyracea Sabine (clusiaceae)
8737
INTRODUCTION
The improvement of plant genetic resources is seen as an immediate solution to the problem of sustaining the livelihoods of farmers living in rural areas, e.g. through indigenous fruit trees in agroforestry. Indigenous fruit trees are characteristic in most tropical landscapes and serve a dual function of local livelihood support and biodiversity conservation. They are important to rural house-holds in terms of their contribution to health, food, energy, cash income, and other aspects of human welfare (Cavendish 2000; Mahapatra et al., 2005). In West Africa, many of indigenous plant species are endangered due to various human activities such as logging, cutting and land clearing (Scoones, 1995). Pentadesma butyracea Sabine (Clusiaceae) is an example. It is an evergreen tree which occurs in areas scattered from Guinea, Sierra-Leone, Côte d’Ivoire, Togo, and Benin to the Democratic Republic of Congo, extending eastwards into Tanzania and Uganda where it is being domesticated (Sama & Sacandé, 2007). In Benin, its natural stands occur mostly in threatened ecosystems of riparian forests which stretch along rivers into areas with a diversity of people and cultures (Natta et al., 2003).This species is recognized for its utilities from the points of view economic, food, nutritional, medical, social, cultural, cosmetic and pharmaceutical (Sinsin & Sinadouwirou, 2003 ; Tchobo et al., 2007). In West Africa, its seeds are exploited to make a butter (‘‘kanya’’ butter) used for consumption and as an ingredient in cosmetics and medicinal preparations (Avocèvou-Ayisso, 2011; Natta et al., 2010). It plays a non-negligible role in the rural economy of Benin, Togo and Ivory Coast. In Central Africa, notably in Gabon, the sweet mesocarp of mature fruits is used to make fruit juice (White et Albernethy, 1996). Despite its importance, this plant species is threatened in Benin because (1) seeds are overexploitated, (2) its habitat is destroyed for agricultural extension and (3)
seasonal fires let by farmers and hunters damage the trees (Ewédjè et al., 2012).The genetic diversity of the species might therefore be strongly reduced in the future if no appropriate conservation measures are taken. The identification of elite individuals (plus trees) in the wild populations is, therefore, very important for the development of effective strategies of management and durable use of the species. According to Kouyaté (2005), management and durable using of the trees need a morphological, biochemical and molecular characterization of the tree in order to differentiate the individuals. Information about P. butyracea uses, butter biochemical composition, socioeconomical value, regeneration, spatial distribution, ecology and morphological variation within natural populations is available (Avocèvou-Ayisso 2011; Natta et al., 2010; Tchobo et al., 2007; Natta, 2003; Sinsin et Sinadouwirou, 2003; Ewédjè et al., 2012). To our knowledge, no study has documented indigenous perception of qualitative or size group morphological variation within the species and quantitative morphological and genetic structuring to test whether locally perceived variations and preferences are either genetically or ecologically determined. Such bottom-up approach may help to identify and characterize ‘‘plus trees’’, locate ecological conditions allowing the species to better express its potential, identify links between traits and is crucial to make improvement strategies realistic. The current study aims to match the quantitative assessment of P. butyracea traits with the folk classification based on local knowledge and analyzing its relationship with ecological conditions. Thus, the following questions were addressed: Do quantitative descriptors confirm folk classification of P. butyracea morphotypes? Which ecological factors drive the pattern of morphological variability in P. butyracea?
MATERIALS AND METHODS
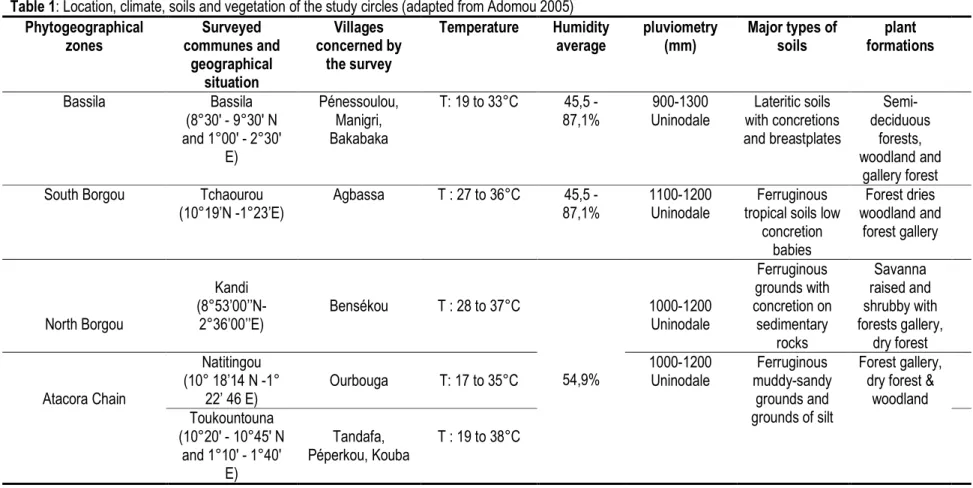
Study area: The study was conducted in Benin (West Africa). Four different ecological zones were targeted based on Pentadesma butyracea distribution range: the
phytogeographical districts of Bassila, chains of Atacora, Southern Borgou and Northern Borgou. Table
8738 1 summarises the ecological characteristics of the four study sites.
Data collection: P. butyracea individuals were sampled in the phytogeographical districts of Bassila, chain of Atacora, Southern Borgou and Northern Borgou ecological zones of Benin. Within each zone, trees were sampled where local people had experience and knowledge on P. butyracea tree (Akoègninou, 2004, Adomou et al., 2007; Natta et al., 2011). Ethnobotanical surveys were carried out on the local perception of the morphological variation in trees of P. butyracea. According to distance from tree to water and soils fertility level, local people distinguish four morphotypes (Table2). 108 trees were sampled in nine villages: 32 trees in phytodistrict of Bassila (Manigri, Bakabaka,Penessoulou), 17 trees in Northern Borgou (Bensekou), 13 trees in Southern Borgou (Agbassa) and 46 trees in chain of Atacora (Kouba, Peperkou, Tandafa,Yimporima). From each selected tree, 10 samples of fruits were collected for measurement. The difference of number of P. butyracea trees sampled is due to the lower density of the trees in each study site. P. butyracea morphological variability was carried out by creating a system of descriptors which took as a starting point the information provided by the rural communities and by the descriptors proposed by several authors (Hijmans et al., 2004; Sanou et al., 2006; Fandohan et al., 2010; Ewédjè, 2012; Vihotogbé et al.,2013). It related to morphological, edaphic and
environmental descriptors.Five morphological descriptors were used: (i) circumference of the trunk, (ii) number of seeds, (iv) length of the fruit, (vi) width of the fruit and (vii) the distance from tree to water.Compared to the environmental descriptors, three descriptors were used: (i) rainfall, (ii) the average temperature (maximum and minimal) and (iii) relative humidity.The fertility of the soil was considered in our study as edaphic descriptor. The circumference of the trunk, expressed in centimetre, was measured using one-meter ribbon of dressmaker (± 1 mm) at the level of the chest (1,30m of the ground).Kouyaté (2005) used this protocol successfully in Mali on Detarium microcarpum.The distance from tree to water was taken using one decametre.The length and the width of the fruits also expressed in centimetre were taken using a slide calliper with a precision of ± 0, 1 Misters. For the number of seeds, we randomly chose 10 fruits under each tree, that we pulped and counted seeds.The fruits were collected in four corners of the summit projection of each tree according to the method of collection used by Leakey et al. (2000). Monthly climatic data (rainfall, relative humidity and temperature) per year for over thirty years (1984-2013) were obtained for each study site within ASECNA (Agence pour la Sécurité de la Navigation Aérienne).Compared to soilfertility of sites sampled, we focused on the work of Willaine and Volkoff (1967) and Adomou (2005) (Table3).
Houédjissin et al. J. Appl. Biosci. 2015 Quantitative morphological descriptors confirm traditionally classified morphotypes of Pentadesma butyracea Sabine (clusiaceae)
Table 1: Location, climate, soils and vegetation of the study circles (adapted from Adomou 2005) Phytogeographical zones Surveyed communes and geographical situation Villages concerned by the survey Temperature Humidity average pluviometry (mm) Major types of soils plant formations Bassila Bassila (8°30′ - 9°30′ N and 1°00′ - 2°30′ E) Pénessoulou, Manigri, Bakabaka T: 19 to 33°C 45,5 - 87,1% 900-1300 Uninodale Lateritic soils with concretions and breastplates Semi-deciduous forests, woodland and gallery forest
South Borgou Tchaourou
(10°19’N -1°23’E) Agbassa T : 27 to 36°C 45,5 - 87,1% 1100-1200 Uninodale Ferruginous tropical soils low
concretion babies Forest dries woodland and forest gallery North Borgou Kandi (8°53’00’’N-2°36’00’’E) Bensékou T : 28 to 37°C 54,9% 1000-1200 Uninodale Ferruginous grounds with concretion on sedimentary rocks Savanna raised and shrubby with forests gallery, dry forest Atacora Chain Natitingou (10° 18’14 N -1° 22’ 46 E) Ourbouga T: 17 to 35°C 1000-1200 Uninodale Ferruginous muddy-sandy grounds and grounds of silt Forest gallery, dry forest &
woodland Toukountouna (10°20′ - 10°45′ N and 1°10′ - 1°40′ E) Tandafa, Péperkou, Kouba T : 19 to 38°C
Table 2: Folk classification of P. butyracea morphotypes
Morphotypes Trees height Trunk dimension Fruit shape Seeds number Fruits productivity
Trees away from water Tall Small Small Few Few
trees waterfront Small Large Large Many Many
Fertile soil trees - - Larg Many Many
8740
Table3: Soils fertility level per phytogeographical district (adapted from Willaine et Volkoff 1967 and Adomou 2005)
Phytodistricts Major types of soils Level of fertility
Southern Borgou Northern Borgou
Ferruginous soils on crystalline rocks Better chemical fertility (BCF) Bassila Ferrallitic soils with concretions and breastplates Weak chemical fertility
(WCF)
Chain of Atacora Poorly evolved & mineral soils Very weak chemical fertility (VWCF) Data analysis: Univariate analyses of variance and
Student Newman–Keuls (SNK) tests were used to describe the morphotypes and identify the discriminative descriptors.Classes of variation are made up by using a scale suggested by Ouédraogo (1995): (1) weak variation (CV = 0-10 %); (2) average variation (CV = 10-15 %); (3) rather significant variation (CV = 15-44 %); and (4) significant variation (CV > 44 %). We proceeded beforehand to a transformation logarithmic curve for the variables numbers seeds, circumference of the trunk and distance from t tree to water, which did not fill the conditions for application of the analysis of the variance. As the number of seeds constitutes the principal trait of commercial importance, we also carried out correlations between the number of seeds and other variables considered (circumference of the trunk, distances fromtree towater, length and width of the fruit). The correlations between the various variables were carried out starting from a canonical
analysis to identify the variables, which discriminate more the number of seeds in each phytodistrict.It was then possible to establish the simple and multiples regression equations which alow to establish prediction models of seeds production starting from discriminating variables in each phytogeographical district. When the best model of regression was obtained for each phytodistricts, normality test of Shapiro-Wilk was carried out to check regression residues and the Breush-Pagan test to check the homogeneity of these residues. In addition, when the conditions for application of the regression (homogeneity and normality of the residues of regression) are not filled, the logarithmetric transformations of the dependent variable (number of seeds) were carried out in order to find a better model adapted to the data, which presents a strong predictive capacity. Indeed, one sought to define the model of regression according to:
Where ß0 = ordered in the beginning (constant), ß1, ß2, ß3 and ß4= coefficients of regression (estimated parameter). Principal components analysis (PCA) was carried out only on the quantitative variables most
discriminating (fruits length and width) to examine ecological influence. Data were processed under STATISTICA (version 6.31) for all analyses.
RESULTS
Comparison of mean values between provenances: Table 4 shows the mean values recorded for quantitative P. butyracea trees and fruit descriptors in four provenances. There were highly significant differences (p˂0, 0001) in mean fruit length and width as well as in mean distance from tree to water between provenances. In contrast, the differences in mean trunk circumference and number of seeds were significantly (p˂0, 05). Trees from phytodistrict of southern Borgou presented the highest values in trunk circumference (2,17±0,09 m), length (15,08±2,06 cm) and width (10,37±1,11 cm) of fruit. Their fruits contained also a greater number of seeds (0,99±0,21). The fruit length (13,06±1,85 cm) and number of seeds (0,76±0,22) per
fruit for trees in northern Borgou populations were lower than for those in the southern Borgou, Bassila ( length: 13,84±1,47 cm; seeds number: 0,84±0,17) and Chain of Atacora (length: 14,90±1,57 cm; seeds number: 0,84±0,21) populations. However, the trunk circumference (2,16±0,12 m) for northern Borgou population trees was greater than for those in the Bassila (2,07±0,16 m) and Chain of Atacora (2,13±0,12 m) populations. The result of variance analysis shows also that the trees from phytodistrict of Bassila were further away water (2,82±1,30 m) than for those in the southern Borgou (1,88±0,71 m), northern Borgou (0,97±1,02 m) and Chain of Atacora (1,50±1,14 m) populations. In addition, distance from tree to water Number of seeds = ß0 + ß1 (distance from the tree to water) + ß2 (trunk circumference) +ß3 (fruit length) + ß4
Houédjissin et al. J. Appl. Biosci. 2015 Quantitative morphological descriptors confirm traditionally classified morphotypes of Pentadesma butyracea Sabine (clusiaceae)
8741 variance among populations ranged from 10,5 to 76%. There was considerable variation in distance from tree to water between provenances. Therefore, an analysis by different classes of distance from tree to water follows.
Comparison of mean values between different classes of distance from tree to water: Six classes of distance were constituted to explain the influence of distance from tree to water on quantitative P. butyracea tree and fruit descriptors (fruit length, fruit width, number of seeds per fruit and trunk circumference):
distance ˂10 m; 10˂distance˂20; 20 ˂distance˂ 30; 30 ˂distance˂ 40; 40 ˂distance˂ 50 and distance˃50 m (Table5). Table 5 shows there were not significant difference (p˃0, 05) in mean fruit length, fruit width, seeds number and trunk circumference between different classes of distance. However, all variables exhibited continuous variation but there were relatively greater variation in seeds number (cv= 24, 68%) than in fruit length (cv= 12, 53%), fruit width (cv= 5, 76%) and circumference (cv= 6, 16%).
Table4: Variations of quantitative morphological descriptors of P. butyracea tree and fruits among sampled phytogeographical districts
Phytodistricts Leng.fruit Wid.fruit Cir.trunk Nber. seeds Dist.water
BN Mean 13,06±1,85b 8,99±1,13b 2,16±0,12a 0,76±0,22b 0,97±1,02b
CV% 14 13 6 29 10,5
BS Mean 15,08±2,06a 10,37±1,11a 2,17±0,09a 0,99±0,21a 1,88±0,71ab
CV% 14 11 4 21 38
BA Mean 13,84±1,47ab 9,08±1,20b 2,07±0,16b 0,84±0,17ab 2,82±1,30a
CV% 11 13 8 20 46
CA Mean 14,90±1,57a 8,70±0,89b 2,13±0,12a 0,84±0,21ab 1,50±1,14b
CV% 11 10 6 25 76 Mean CV% P 14,34±0,18 9,07±0,17 4,86±0,03 1,94±0,05 6,59±0,12 12,48 19,85 4,96 25,26 18,82 0,000*** 0,000*** 0,031* 0,016* 0,000***
Means followed by the same letter wthin a column are not significantly different at p˂ 0, 05; ***: significantly different at p˂0, 1%; *: significantly different at p˂ 0, 05
Legends: Leng.fruit : Length of fruit ; Wid.fruit : Width of fruit ; Cir.trunk : circumference of trunk ; Nber.seeds: Number of seeds ; Dist.water : Distance from tree to water ; CV% : Coefficient of variation ; P : probability ;
BS : southern Borgou; BN: northern Borgou; Ba: Bassila; C A: Chain of Atacora
Table5: Variations of quantitative morphological descriptors of P. butyracea tree and fruits among class of distance from tree to water
Clas.Dist.Water(m) Leng. Fruit Wid. Fruit Cir. Trunk Nber. seeds
˂10 14,51 ±0,21a 2,20±0,01a 4,90±0,03a 1,98±0,05a
[10-20[ 14,30 ±0,49a 2,23±0,03a 4,98±0,08a 2,06±0,13a
[20-30[ 14,10 ±0,80a 2,13±0,05a 4,88±0,13a 1,62±0,21a
[30-40[ 13,87 ±0,63a 2,20±0,04a 4,61±0,10a 1,96±0,16a
[40-50[ 14,53 ±1,03a 2,09±0,07a 4,77±0,17a 1,88±0,27a
˃50 13,33 ±0,59a 2,10±0,04a 4,87±0,10a 1,69±0,15a
Mean 14,32 ±0,17 2,19±0,01 4,88±0,03 1,94±0,05
CV% 12,53 5,76 6,16 24,68
p 0,533NS 0,087NS 0,154NS 0,312NS
Means followed by the same letter wthin a column are not significantly different at p˂ 0, 05; NS: no significantly different at p˂0, 05
Legends: Leng.fruit : Length of fruit ; Wid.fruit : Width of fruit ; Cir.trunk : circumference of trunk ; Nber.seeds: Number of seeds ; Dist.water : Distance from tree to water ; CV% : Coefficient of variation ; P : probability ;
Influence of soils fertility level on quantitative descriptors of P. butyracea tree and fruits Table 6
shows the mean values recorded for quantitative P. bytracea fruit and tree descriptors according to soils
8742 fertility. Mean fruit traits (length, width) and mean trunk circumference significantly differed between soils fertility level (p < 0.05), but not mean seeds number (p˃0, 05). The trees from soils having better chemical fertility level, had the largest trunk circumference (4,96±0,05 m) and presented the highest values for fruit width (9,58±0,21 cm) and number of seeds (1,98±0,09) per fruit. Fruits from Soils having very weak chemical fertility showed the highest values in length (14,94± 0,27 cm) but the lowest values in width (8,73±0,17 cm). By contrast, the trees from Soils having weak chemical fertility portrayed the lowest values in trunk circumference (4,76±0,05 m), fruit length (13,90± 0,31 cm) and seeds number per fruit (1,93±0,08). Variance among fertility level ranged from 5,75 to 25,18% of the total variance for traits related to four characteristics. The multivariate canonical discriminant analysis on P. butyracea tree and fruit descriptors confirmed the relationships between these parameters and soils fertility level. The canonical discriminant analysis performed on the morphotypes showed that the first two axes explained 100 % of the observed variation. These axes were thus used to describe the relationships between the investigated descriptors and soil fertility level. The correlation between the axes and the used descriptors is shown in Table 7. The first axis showed positive link with fruit length and Soils having weak chemical fertility. This axis was negatively correlated with the Soils having very weak chemical fertility. In contrast, the second axis showed negative relationships with fruit width, trunk circumference, seeds number and soils having better
level chemical fertility. In addition, the correlation between both axes and fruit traits, seeds number and trunk circumference showed low values.
Correlations between seeds number and dendrometric variables (trunk circumference, distance from tree to water) and fruit traits (length and width): The relationships between seeds number and fruit traits (length and width) were strongest and highly significant in southern Borgou (fruit length: p˂ 0, 0001; r= 86,2 %; fruit width: p˂0,001; r= 76,86%), Northern Borgou (fruit length: p˂ 0, 0001; r= 76,55 %; fruit width: p˂0,0001; r= 83,04%) and Bassila (fruit length: p˂ 0, 0001; r= 65,73 %; fruit width: p˂0,001; r= 52,13%). Concerning, the relationships between seeds number and trunk circumference, it was positively weakest and no significant (p˃0, 05) for three phytodistricts. Relationships between seeds number and distance from tree to water were also weak and no significant but negative for Northern Borgou (r= - 27, 36%) and Bassila (r= -12, 89%). By contrast, in Chain of Atacora, the relationships between fruit length (r=19, 91%) and seeds number on the hand one, and between seeds number and trunk circumference (r= -0, 07%) and distance from tree to water (r= - 32, 62%) on the other hand, were weakest (Table8). Generally, the positive and strong relationships observed between seeds number and fruit traits in southern Borgou, northern Borgou and Bassila, indicading that seeds number increase with fruit length and width. However, seeds number decrease with trunk circumference and distance from tree to water.
Table6: Variations of quantitative morphological descriptors of P. butyracea tree and fruits among soils fertility level
Variables Leng.fruit Wid.fruit Cir.trunk Nber.seeds
SVWCF 14,94± 0,27a 8,73±0,17b 4,88±0,04ab 1,94±0,7a
SWCF 13,90± 0,31 b 9,06±0,20ab 4,76±0,05b 1,93±0,08a
SBCF 14,00±0,32 ab 9,58±0,21a 4,96±0,05a 1,98±0,09a
Mean 14,28±0,18 9,08±0,11 4,87±0,02 1,95±0,05
Cv% 12,18 12,53 5,75 25,18
P 0,022* 0,010* 0,017* 0,871NS
Means followed by the same letter wthin a column are not significantly different at p˂ 0, 05; ***: significantly different at p˂0, 1%; *: significantly different at p˂ 0, 05
Legends: Leng.fruit : Length of fruit ; Wid.fruit : Width of fruit ; Cir.trunk : circumference of trunk ; Nber.seeds: Number of seeds ; CV% : Coefficient of variation ; P : probability ; SVWCF: Soils very weak chemical fertility; SWCF: Soils weak chemical fertility; SBCF: Soils better chemical fertility
Table7: Correlation between quantitative morphological descriptors of P. butyracea tree, fruit, soil fertility level and Canonical discriminant axes
Houédjissin et al. J. Appl. Biosci. 2015 Quantitative morphological descriptors confirm traditionally classified morphotypes of Pentadesma butyracea Sabine (clusiaceae)
8743
Variables Canonical discriminant axes
Axis1 (67%) Axis2 (100%) Leng.fruit 0,370139 0,089120 Wid.fruit -0,299505 -0,426791 Cir.trunk 0,118630 -0,394283 Nber.seeds 0,005145 -0,201497 SBCF -0,408344 -0,844207 SWCF 0,869672 0,148495 SVWCF -0,894508 0,573342
Legends: Leng.fruit : Length of fruit ; Wid.fruit : Width of fruit ; Cir.trunk : circumference of trunk ; Nber.seeds: Number of seeds ; Dist.water : Distance from tree to water ; SVWCF: Soils very weak chemical fertility; SWCF : Soils weak chemical fertility; SBCF : Soils better chemical fertility
Table8 : Relation between the number of seeds respectively with the length of the fruit, the circumference of the trunk, the width of the fruit and distance from tree to water per phytodistrict
Phytodistricts Variables R (%) P Southern Borgou Nber.Seeds vs. Leng.fruit 86,2 0,000*** Nber.Seeds vs. Wid.fruit 76,86 0,002** Nber.Seeds vs. Cir.trunk 32,2 0,283 NS Nber.Seeds vs. Dist.water 19,1 0,532 NS Northern Borgou Nber.Seeds vs. Leng.fruit 76,55 0,000*** Nber.Seeds vs. Wid.fruit 83,04 0,000*** Nber.Seeds vs. Cir.trunk 47,53 0,053 NS Nber.Seeds vs. Dist.water -27,36 0,287 NS Chain of Atacora Nber.Seeds vs. Leng.fruit 19,91 0,179 NS Nber.Seeds vs. Wid.fruit 49,26 0,000*** Nber.Seeds vs. Cir.trunk -0,07 0,096 NS Nber.Seeds vs. Dist.water -32,62 0,025* Bassila Nber.Seeds vs. Leng.fruit 65,73 0,000*** Nber.Seeds vs. Wid.fruit 52,13 0,002** Nber.Seeds vs. Cir.trunk 21,90 0,228 NS Nber.Seeds vs. Dist.water -12,89 0,481 NS four phytodistricts Nber.Seeds vs. Leng.fruit 57,10 0,000*** Nber.Seeds vs. Wid.fruit 63,55 0,000*** Nber.Seeds vs. Cir.trunk 24,87 0,011* Nber.Seeds vs. Dist.water -15,77 0,111 NS
***: significantly different at p˂0,1% ; **: significantly different at p˂1% ; *: significantly different at p˂ 0,05 ; NS : No significantly different at p˂ 0,05
Legends: R: coefficient of correlation; R2: coefficient of determination; P: probability Leng.fruit: Length of fruit; Wid.fruit: Width of fruit; Cir.trunk: circumference of trunk; Nber.seeds: Number of seeds; Dist.water: Distance from tree to water
Modelling seeds number per fruit : Regression equations were used to build predictive models for seeds number (the principal trait of commercial importance) based on fruit traits (length and width) and trunk circumference for each phytodistrict (Table 9). There were highly significant relationships between seeds number and fruit traits and circumference trunk
for all phytodistrict (p˂ 0, 0001). However, fruit length and width as well as fruit length and trunk circumference were stronger predictors of seed number (higher estimated regression slopes) respectively for Northern Borgou (R² = 0, 71) and Southern Borgou (R² = 0, 73) than for Chain of Atacora (R² = 0, 33) and Bassila (R² = 0, 29) phytodistricts (table9).
Table9: Linear regression model for P. butyracea seeds number per fruit Phytodistricts Equations of régression S (Residual
standard)
R 2 (ajuste)
8744 BS Ln(Nber.seeds) = 3,35281 + 0,223664 Leng.fruit - 0,886907 Ln(Cir.trunk) 0,24 0,73 0,41 0,000*** BN Ln(Nber.seeds) = -1,79763 + 0,118866 Leng.fruit + 0,219979 wid.fruit 0,28 0,71 0,63 0,000*** CA Ln(Nber.seeds) = - 0,809 + 0,315 wid.fruit 0,41 0,33 0,27 0,000*** BA Ln(Nber.seeds) = -0,142268 + 0,14891 wid.fruit 0,33 0, 29 0, 22 0,000*** Equation general (all phytodistricts) Ln(Nber.seeds) = -0,975742 + 0,0828142 Leng.fruit + 0,191334 wid.fruit 0,36 0, 45 0, 42 0,000*** ***: significantly different at p˂0.1%
Legends: BS: Southern Borgou; BN: Northern Borgou; CA: Chain of Atacora; BA: Bassila; P: Probability; R2 = coefficeint of determination; Leng.fruit: Length of the fruit; Wid.fruit: Width of the fruit; Cir.trunk: circumference of the trunk; Nber.seeds: number of seeds
Influence of ecological conditions on the discriminating variables of seeds number : The Principal Component Analysis performed on discriminating variables showed that the first three axes explained 72,52% of the variation. Table10 shows the correlation between the axes and quantitative descriptors. The first axis was found negatively correlated with maximum temperature, minimal relative humidity, maximum relative humidity and precipitation.
The second axis shows a positive link between fruit traits (length and width). Moreover,the third axis was negatively correlated with minimal temperature only. This means that length and width of fruit decline with higher temperature, relative humidity and precipitation. We can thus deduce that the fruits are larger when the temperature, the relative humidity and precipitation are less high.
Table10: Correlation between fruit traits (length and width), ecological factors and PCA factors
Variables Principal component
PC1 (36,95%) PC2 (55,34%) PC3 (72,52%) Leng.fruit -0,280 0,819 0,147 Wid.fruit -0,426 0,642 0,031 Tmin -0,397 0,073 -0,817 Tmax -0,664 -0,089 -0,496 HR min -0,866 -0,111 0,286 HR max -0,812 -0,211 0,427 Pluv. -0,563 -0,364 0,008
Legends: Leng.fruit: Length of the fruit; Wid.fruit: Width of the fruit; Tmin: Minimal temperature; Tmax: Maximum temperature; HR min: Minimal relative humidity; HR max: Maximum relative humidity; Pluv.: pluviometry
DISCUSSION
This study quantifies variation in traditional morphotypes of P. butyracea and provides basic knowledge on the range of variation of several quantitative morphological descriptors within and between locally identified morphotypes, across the different ecological sites. Our study confirms the existence of a large morphological variability in P. butyracea trunk circumference, fruit length, fruit width and seeds number. In general, the results we can
conclude that trees having strong trunk circumference produce a greater fruit and seeds number but these trees are not always close to water as local population expressed. Even trees, which were very close to water, having lower trunk circumference and produce small fruit contained lower or greater seeds number. Therefore, fruit length, fruit width, trunk circumference and seeds production not depending on distance from tree to water. Despite the confirmation of the traditional
Houédjissin et al. J. Appl. Biosci. 2015 Quantitative morphological descriptors confirm traditionally classified morphotypes of Pentadesma butyracea Sabine (clusiaceae)
8745 discrimination, the study revealed that most of the variability of P. butyracea morphotypes is present within the natural populations of the tree. It should be emphasized that this is phenotypic variation, which reflects the genotype, environment and genotype, by environment interaction. The very extensive variation found irrespective of the descriptors is consistent with previous studies on P. butyracea (Ouattara, 1999; Ewédjè et al., 2012). Trees from soils having better chemical fertility level, have the largest mean values for trunk circumference and presented the highest values for fruit width and number of seeds per fruit. On the contrary, the trees from Soils having weak chemical fertility portrayed the lowest values in trunk circumference, fruit length and seeds number per fruit. This could be explained by the amount of nutrients in the soil. This suggests that edaphic conditions affect the phenotypic variation of this tree species, as was described for many other plant species (Schlichting and Pigliucci 1998; Assogbadjo et al., 2009). The quantitative morphological analyses on soils fertility level confirmed the traditional discrimination to be effective. There was a high correlation between seeds number and fruit traits (length and width), but there were weakly or not correlated with trunk circumference and distance from tree to water. This weakness or lack of correlation suggests that trunk circumference and distance from tree to water cannot be used as an indicator of seeds production. The predictive models confirmed the strong correlations between seeds number and fruit traits. The relatively strong relationships between number of seeds and fruit traitssuggested that selection for ‘‘plus trees’’ in seed production could be based on direct measurable of fruit length and width, if these correlations have genetic basis. Inheritance of quantitative traits (weight, length, width etc.) is known to be usually polygenic (Allendorf and Luikart, 2007) and a phenotypic correlation between two polygenic traits may have a genetic or environmental basis and those traits are not transmissible to the next generation (White et al., 2007). Moreover, the correlations found in this study, between
fruit traits (length an width) and some ecological factors confirm environment effects on morphological traits. For instance, length and width of fruit decline with higher temperature, relative humidity and precipitation. In fact, phenotypic variation is caused by genotypic (G) and environmental (E) effects and their interactions. Therefore, if environmental effects are relatively reduced at population or tree level, most of the variations recorded are presumably genetic. One of the factors likely to induce fitness variability in dioecious species is the mating system which determines the genetic structure (Gouwakinnou et al., 2011). For example, Diallo et al. (2008) documented some variation in fruit size and in number of seeds in T. indica fruits to be induced by cross pollination and self incompatibility, which may reduce fruit size and the number of seeds per fruit. Further investigation is requested to understand the underlying factors of the phenotypic correlation assessed in P. butyracea. This understanding would permit the quantification on the genetic basis of this correlation among pairs of traits. This quantification is important for tree improvement programs and the study of natural populations of this indigenous fruit tree. Practical conservation measures are to be taken to preserve genetic diversity and maintain multiple specimens. This study indicates that based on the quantitative descriptors, most of the variation is held within morphotypes. Nevertheless, the between morphotype variation was found to relatively high, particularly for fruit length and width as well as seeds number. In addition, the perceived qualitative variation may be genetically determined and should not be neglected. Thus, one possible strategy for germplasm collection may consist of sampling a moderate number of trees within all the morphotypes. This may ensure capturing a wide range of variation. Because phenotypic variability results from both ecological and genetic effects, studies of genetic diversity and gene flow among ecological zones are needed to explain all the observed variation prior to effective germplasm collection, ‘‘plus trees’’ selection and propagation in traditional agroforestry systems. CONCLUSION
This study highlighted the importance of endogenous knowledge in the strategies of selection, improvement and domestication of the wild species. In spite to entirely confirm traditional discrimination, this study based on the use of the quantitative descriptors revealed the presence of the majority of the variability of the morphological characteristics of the fruits and the
trees of P. butyracea such perceived by the local populations.That suggests that there is a significant heterogeneity within the fruits and trees of P. butyracea considered traditionally as pertaining to same morphotype.This significant variation observed shows the possibilities of selecting morphotypes elites for the production of seeds in order to meet the needs for the
8746 traditional and modern markets.The developed predictive models could allow the researchers and the decision makers, in partnership with the local population, to make a quantitative evaluation of the potential of production out of P. butyracea seeds. However, of the studies on the genetic determinism of the various morphological characters of the fruit and the trees thus prove essential not only to separate the genetic effects of the environmental effects, but also to undertake effective strategies of management of these
genetic resources to the profit of the producers. The local people knowledge listed here, can constitute a pledge for the development of strategies of conservation and durable use of P. butyracea genetic resources, because one of the ways for better validating our results in the rural populations is to take account of their knowledge, and that supports the valorization of their rich person experiments and the adoption of developed technologies.
ACKNOWLEDGMENTS
This work is supported by BIVAP project (Biodiversité et Valorisation Agro-alimentaire de Pentadesma butyracea au Bénin) through the Programme of
Competitive Funds of Research of University of Abomey-Calavi (PFCR/UAC). We are very grateful to local people for their assistance during data collection. REFERENCES
Adomou AC, Akoègninou A, Sinsin B, de Foucault B, van der Maesen LJG, 2007. Biogeographical analysis of the vegetation in Benin. Acta Botanica Gallica 154 (2): 221-233.
Adomou, 2005. Vegetation Patterns and Environmental gradients in Benin.Implications for biogeography and conservation.PhD Dissertation.Wageningen University, Wageningen, the Netherlands.
Akoègninou A, 2004. Recherches botaniques et écologiques sur les forêts actuelles du Bénin. Thèse d’Etat, Université de Cocody-Abidjan (Côte d’Ivoire), 326 p.
Allendorf FW, Luikart G, 2007. Conservation and the Genetics of Populations. Blackwell Publishing, Oxford.
Assogbadjo AE, Kyndt T, Chadare FJ, Sinsin B, Gheysen G, Eyog-Matig O, Van Damme P, 2009. Genetic fingerprinting using AFLP cannot distinguish traditionally classified baobab morphotypes. Agrofor Syst 75:157– 165
Avocèvou-Ayisso CMA, 2011. Etude de la viabilite des populations de Pentadesma butyracea Sabine et de leur socio-economie au Benin. These de doctorat. Universite d’Abomey Calavi, Benin. 223 p.
Cavendish W, 2000. Empirical Regularities in the Poverty-Environment Relationship of Rural Households: Evidence from Zimbabwe. World Development 28:1979–2003.
Diallo BO, Mckey D, Chevallier MH, Joly HI, Hossaert- Mckey M, 2008. Breeding system and pollination biology of the semi-domesticated
fruit tree, Tamarindus indica L. (Leguminosae: Caesalpinioideae): implications for fruit production, selective breeding, and conservation of genetic resources. Afr J Biotechnol 7(22):4068–4075
Ewédjè Eben-Ezer BK, Ingrid Parmentier, Armand Natta, Adam Ahanchédé, Olivier JH , 2012. Morphological variability of the tallow tree, Pentadesma butyracea Sabine (Clusiaceae), in BeninGenet Resour Crop Evol 59:625–633 DOI 10.1007/s10722-012-9802-1 Ewédjè Eben-Ezer BK, 2012. Bilogie de la
reproduction, phylogéographie et diversité de l’arbre à beurre Pentadesma butyracea Sabine (Clusiaceae): Implication pour sa conservation. Thèse de doctorat, Université Libre de Bruxelles. 227 p.
Fandohan B, Assogbadjo AE, Glèlè Kakaï R, Kyndt T, Sinsin B, 2010. Quantitative morphological descriptors confirm traditionally classified morphotypes of Tamarindus indica L. fruits. Genet Resour Crop Evol DOI 10.1007/s10722-010-9575-3
Gouwakinnou GN, Lykke AM, Assogbadjo AE, Sinsin B, 2011. Local knowledge, pattern and diversity of use of Sclerocarya birrea. Journal of Ethnobiology and Ethnomedicine, 7(8): 1746-4269
Hijmans RJ, Cameron SE, Parra JL, Jones PG, Jarvis A, 2004. The WorldClim interpolated global terrestrial climate surfaces. Version 1.3.
http://biogeo.berkeley.edu
Kouyaté AM, 2005. Aspects ethnobotaniques et etude de la variabilite morphologique, biochimique et
Houédjissin et al. J. Appl. Biosci. 2015 Quantitative morphological descriptors confirm traditionally classified morphotypes of Pentadesma butyracea Sabine (clusiaceae)
8747 phénologique de Detarium microcarpum guill. & perr. au Mali. Thèse de doctorat : FACULTEIT
BIOINGENIEURSWETENSCHAPPEN; 207p Leakey RRB, Fondoun JM, Atangana A, Tchoundjeu Z,
2000. Quantitative descriptors of variation in the fruits and seeds of Irvingia gabonensis. Agrofor Syst 50:47–58
Mahapatra A K, Albers H J, Robinson EJ Z, 2005. The Impact of NTFP Sales on Rural Households’ Cash Income in India’s Dry Deciduous Forest. Environmental Management 35(3):258–265. Natta AK, Sinadouwirou TA, Sinsin B, Van der Maesen
LJG, 2003. Spatial distribution and ecological factors determining the occurrence of Pentadesma butyracea Sabine (Clusiaceae) in Benin. Pp. 73-80 in Ecological Assessment of Riparian Forests in Benin: Phytodiversity, phytosociology and spatial distribution of tree species. Edited by A. Natta. Dissertation, Wageningen University, Wageningen, The Netherlands.
Natta A, Sogbegnon R, Tchobo F, 2010. Connaissances Endogènes et Importance du Pentadesma butyracea (Clusiaceae) pour les Populations Autochtones au Nord Ouest Bénin. Fruit, Vegetable, and Cereals Science and Biotechnology, 4, 18-25. Global Science Books; Special issue 1.
Natta AK., Porembski S, 2011. Forêts galeries. In: Sinsin B., et al. (eds.). Atlas écologique du Bénin : Etat actuel de la diversité végétale / Current state of plant diversity.
Ouattara N, 1999. Evolution du taux de germination des semences oléagineuses en fonction du mode et de la durée de conservation. Cas du Pentadesma butyracea Sabine (Lami). In : Ouédraogo A.S. & Boffa J-M. (eds). Vers une approche régionale des ressources génétiques génétiques forestières en Afrique de l’Ouest, Afrique Centrale et Madagascar, Ouagadougou, Burkina-Faso. IPGRI, Rome, Italie. Pp 170-174.
Ouédraogo AS,1995. Parkia biglobosa (Fabaceae) en Afrique de l’Ouest. Biosystématique et amélioration. Thèse. Univ. agron. Wagening. Inst. For. Nat. Res. IBN-DLO. Netherlands. 205 p.
Sama B, Sacandé M, 2007. Pentadesma butyracea Sabine, seed leaflet No. 131 December 2007. In: Schmidt L (ed) Millennium seed bank project. Forest & Landscape Denmark
Sanou H, Picard N, Lovett PN, Dembélé M, Korbo A, Diarisso D, Bouvet JM, 2006. Phenotypic variation of agromorphological traits of the shea tree. Vitellaria paradoxa CF Gaertn, in Mali. Genet Resour Crop Evol 53:145–161 Schlichting CD, Pigliucci M, 1998. Phenotypic evolution:
a reaction norm perspective. Sinauer Associates, Massachusetts,USA
Scoones I, 1995. Living with Uncertainty: New Directions in Pastoral Development in Africa. SRP, Exeter, London.
Sinsin B & Sinadouwirou Th, 2003. Valorisation socio-économique et pérennité du Pentadesma butyracea Sabine en galeries forestières au Bénin. Cahiers Agricultures, 12: 1-5.
Tchobo FP, Natta AK, Barea B, Barouh N, Piombo G, Pina M, Villeneuve P, Soumanou MM, Sohounhloue DCK., 2007. Characterization of Pentadesma butyracea sabine Butters of Different Production Regions in Benin. 2007. Journal of American Oil Chemistry Society, 84, 755-760.
Vihotogbé R, van den Berg RG, Marc SM, 2013. Morphological characterization of African bush mango trees (Irvingia species) in West Africa ; Genet Resour Crop Evol (2013) 60:1597–1614 White L, Albernethy K, 1996. Guide de la Végétation de la Réserve de la Lopé. Traduit de l’anglais par Benoït Fontaine & Anne Rouvière, p 224 White TL, Adams WT, Neale DB, 2007. Forest
Genetics. CAB International, Oxfordshire. Willaine P & Volkoff B, 1967. Carte pédologique du
Dahomey à l’échelle de 1/1000 000. Paris, ORSTOM. 1