Path coefficient analysis of body weight and biometric traits in Ouled-Djellal breed
(Algeria)
Dekhili
1*, M. and A. Aggoun
21 Département d'agronomie. Université Ferhat ABBAS Sétif 1- Sétif-19000, Algérie; 2 Département de mathématiques. Université Ferhat ABBAS Sétif 1- Sétif-19000, Algérie (*)
E-mail : [email protected]
RESUME
Direct et indirect effets de 12 variables quantitatives qui sont: la longueur du cou (lc), la longueur du corps (cl), la longueur du tronc (lt), la largeur du bassin (lb), la largeur des hanches (lh), le tour de poitrine (tp), la largeur de la poitrine (lp), la profondeur de la poitrine (pp), la largeur des hanches (lh), la hauteur au garrot (hg), la hauteur au sacrum (hs), la hauteur au dos (hd), la profondeur du flanc (pf) et le poids vif (pv) de 347 brebis de type Ouled-Djellal, ont été étudiées par la méthode en chemin. Parmi toutes les variables étudiées, 7 ont été trouvées non significatives et ont été éliminées du modèle final. Les 5 variables retenues sont, cl, tp, lp, hg et pf respectivement. Les coefficients de corrélations entre ces variables ont été hautement significatives et on varié de 0.07-0.72. Les effets directs du tour de poitrine et de la longueur du corps ont été de 0.50 et de 0.44, respectivement. Le modèle optimal de la régression multiple enregistre un coefficient de détermination (R²) de 0.87 avec une erreur de 0.13. Les résultats obtenus dans cette investigation peuvent servie d'un outil pratique pour les éleveurs et techniciens, pour l'estimation du poids vif des brebis lors des les programmes de sélection.
ABSTRACT
Direct and indirect effects of twelve variables ( neck length (nl), body length (bl), trunk length (trl), pelvis length (pl), hip width (hw), chest size (cs), chest depth (cd), chest width (cw), height at withers (htw), height at sacrum (hs), height at back (hb), side depth (sd) on body weight of 347 Ouled-Djellal ewes were investigated using path analysis. Seven traits were found not to be important; they were deleted from the full model. So, we ended up with a reduced model, with five traits only ( bl, cs, cw, htw, sd). Pairewise correlations between body weight and zoometrical traits ranged from 0.07-0.72. The direct effects of chest size and body length on body weight prediction were the strongest (0.50 and 0.44, respectively). Chest width, side depth was positive and significant, as well. But height at withers was significant but with negative effect. The optimum multiple regression equation included chest size, body length, chest width, height at withers and side depth, with a determination coefficient (R²) of 0.87 and determination coefficient of error of 0.13 These results obtained in this investigation could help in weight estimation, selection and breeding programmes.
Revue semestrielle – Université Ferhat Abbas Sétif 1
REVUE AGRICULTURE
Revue home page: http.www: http://revue-agro.univ-setif.dz/
UFAS - SETIF
ARTICLE INFO L'histoire de l'article Reçu : 16 – 11 - 2013 Accepté : 14 - 12 - 2013 Mots clés :Ouled-Djellal, poids vif, variables morphométrique, l'analyse en chemin, coefficient de détermination, effet direct et indirect.
Key words:
Ouled-Dellal, body weight, morphometric traits, path- analysis, coefficient of determination, direct effect, indirect effect, pleiotropic action
1. Introduction
Body weight has, always, been considered as an important economic trait in animal's selection. Therefore, improving these economic traits constitute an important objective in animal breeding (Mendes et al., 2005). Adding to this, they are correlated with body components such as age and morphological characters. Many authors, used body measurement, in animals, to estimate body weight (Yakubu, 2010). In animal production, meat constitutes the most important product that is affected by growth and animal body size.
In Algeria, no breeding programmes have been implemented to improve productivity of small ruminants, and they are bred extensively (Dekhili and Aggoun, 2007). So, no information on sheep resources is available, which does not aid for a good management and improvement. According to this, some techniques to animals for breeding purposes towards meat production are needed. These should be reliable and easy to apply for estimating the performance and breeding value of sheep.
To examine relationships between live weight and body measurements of sheep using simple correlation coefficients did not gave reliable explanation (Topal and Esenbuga, 2001; Keskin et al., 2005; Yakubu, 2010). In order to address this limitation, path coefficient and path analysis could be more suitable. Path analysis measures a direct and indirect effect of one variable on another and also separate the correlation coefficients into components of direct effect, indirect effect and compound path (Topal and Esenbuga, 2001; Keskin et al., 2005; Yakubu, 2010). It is an extension of the multiple regression models, which permits the determination of the explanatory variables that affect mostly the response variable.
Ouled-Djellal sheep is one of the most important sheep breed in Algeria (Chellig, 1992). Analysis technique using path analysis has not been exploited in showing the relationship between Ouled-Djellal body weight and its body measurements (Dekhili et al., 2013). The main objective of this investigation is to estimate, in the field body weight from biometric traits of Ouled-Djellal sheep using path analysis with the view to yielding an easy and more appropriate selection criterion.
2. Material and Methods 2.1. Location and study
Data were obtained from 347 randomly selected Ouled-Djellal ewes between March to May 2012. The animals were reared through the extensive system in Sétif Department located in the east of Algeria. The animals were grazed during the day on natural pasture containing legumes, graminea, vicia Sativa, and returned to homestead in the evening. In winter, they were given barley grain as supplements.
2.2. Traits measured
Body live was measured along with twelve biometric traits on each animal. The 13 body measurements obtained were: neck length (nl), body length (bl), trunk length (trl), pelvis length (pl), hip width (hw), chest size (cs), chest depth (cd), chest width (cw), height at withers (htw), height at sacrum (hs), height at back (hb), side depth (sd). Body measurements or quantitative traits were carried out by three technicians using Lydthin stick, tape measure and Vernier calipers. Animals were put on a flat floor and held by farmers. Quantitative traits were collected simultaneously in the field and were reported on files or cards. Individual files were reported before starting analysis. Hence, the data were collected on the conditions in which animals are bred. Once the data were collected, they were reported on Excel file to be analysed later. Questionnaires were elaborated as well, to collect information about production environment, mating, feeding, selection and other activities. To ovoid intra-individual variations, all measurements were taken by the same person.
2.3. Statistical analysis
Means, standard deviations (SD) and coefficients of variation (CV) of the body weight and linear body measurements of Ouled-Djelllal ewes were computed. Pairwise correlations among body weight and morphometric characters were also determined. Standardized partial regression coefficients called path coefficients (beta weights) were calculated, as well. This was to allow direct comparison of values to reflect the relative importance of independant variables in order to explain variation in the dependant variable (Seker and Serin, 2004). Path analysis is a subset of Structural Equation Modeling (SEM), the multivariate procedure, which, as defined by Ullman (1996), allows examination of a set of relationships between one or more independent variables (continuous or discrete), and one or more dependent variables ( continuous or discrete). SEM deals with measured and latent variables. Measured variables are also known as observable variables. A latent variable (factor), however, is a variable which cannot be observed directly and must be inferred from measurable variables. SEM is a combination of multiple regression and factor analysis. Path analysis, on the other hand, deals only with measured variables; in the present study, the observed variables were body weight, neck length, body length, trunk length, pelvis length, hip width, chest size, chest depth, chest width,
height at withers, height at sacrum, height at back, side depth. Path analysis model is not a substitute for regression analysis; rather it is a complementary methodology to regression analysis (Jeonghoon, 2002). In path analysis, it is assumed that the residuals (error term) are uncorrelated with the variables in the model and with each other.
The path coefficient from explanatory variable (X) to a response variable (Y) as described by Mendes et al. (2005) is shown below:
Py.xi = bi Sxi/Sy Where:
Py.x= path coefficient from X to Y (nl,bl,trl,pl,hw,cs,cd,cw,htw,hs,hb,sd), bi = partiel regression coefficient,
Sxi = standard deviation of X, Sy = standard deviation of Y.
The multiple linear regression model adopted was:
Y= a+ b1X1+b2X2+b3X3+b4X4+b5X5+b6X6+b7X7+b8X8+b9X9+b10X10+b11X11+b12X12 where:
Y = endogenous variable (body weight), a = intercept,
b's = regression coefficients,
X's = exogenous variables (nl,bl,trl,pl,hw,cs,cd,cw,htw,hs,hb,sd), e = error term, normally distributed with mean zero variance.
The significance of each path coefficient in the multiple linear regression model was tested by t-statistic. The indirect effect of Xi on Y through Xj were calculated as follows:
IEyxi = rxixjPy.xj where:
IEyxi =the direct effect of Xi via Xj on Y,
rxixj = correlation coefficient between ith and jth independent variables,
Py.xj = path coefficient that indicates the direct effect of jth independent variable on the dependent variable.
Coefficient of determination (R²) was partitioned into its components using path analysis.
The explanatory variables were screened for multicollinearity problems using variance inflation factors (VIF) and tolerance (T) values. SPSS (2001) statistical package was used for the analysis.
3. Results and discussion
3.1. Body weight and morphological traits
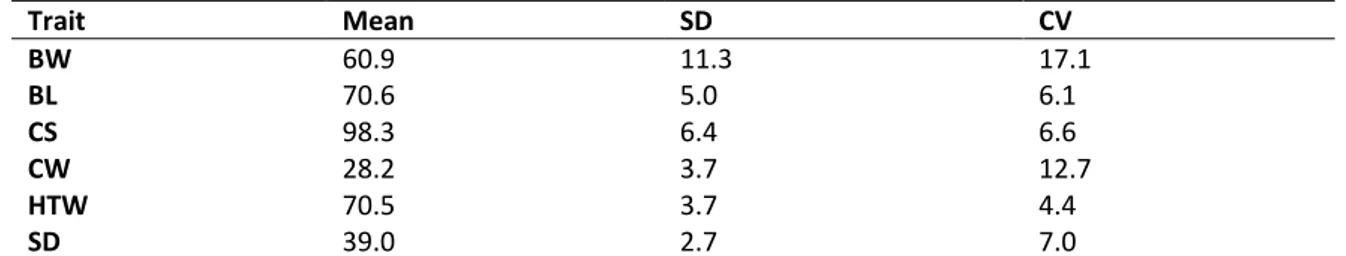
The means, standard deviation and coefficients of variation of each body weight and linear measurements of Ouled-Djellal ewes are presented in Table 1. Ouled-Djellal is well known as bigger animal in term of body configuration compared to the other Algerian breed (Chellig, 1992). This big conformation is attributable to the capacity of free and wide ranging mode of grazing in search of pasture, water and to a long march in the high plateaux of Sétif area.
Table 1: Descriptive statistics of body weight and body dimensions of Ouled-Djellal ewes
Trait Mean SD CV BW 60.9 11.3 17.1 BL 70.6 5.0 6.1 CS 98.3 6.4 6.6 CW 28.2 3.7 12.7 HTW 70.5 3.7 4.4 SD 39.0 2.7 7.0
SD: Standard deviation; CV: Coefficient of variation. Traits: bw: body weight, bl; body length), cs: chest size, cw: chest width, htw: height at withers, sd: side depth.
3.2. Bivariate correlations
Pairewise correlations among body weight and linear body measurements of the ewes are presented in table 2. Significant (P<0.001) and positive association existed among body weight and zoometrical traits. The highest correlation was found between body weight and chest size (0.72), while the lowest and not significant correlations were found between body length and chest width and between body length and side depth. There were no multicollinearity problems among the body measurements, since preliminary analysis revealed that
the variance inflation (VIF) value was smaller than 10 (Pimentel et al., 2007) and the tolerance (T) value was greater than 0.1 (Gill, 1986) in all cases. Estimates of correlation obtained in this investigation reflect active growth of body measurements at this stage. Given that, the majority of traits are quantitative concerning with size, height, width and weights. These are influences and may depend on many genes and economically important (Dekhili et al., 2013). In this case, the majority of genes influencing the constitution of an animal are of common action, the formation of one part is found closely correlated with the formation of the other (Lener and Donald, 1996). Many authors reported high correlations between body weight and morphometric measurements (Aziz and Sharaby, 1993). The implication of these positive relationships is that body weight could be estimated from body measurements, especially, under high plateaux conditions of Algeria, where scales are easily available. This strong association existing between body weight and body measurements (bl,cs,cw,htw,sd) may be useful as selection criterion, since positive correlation of traits suggest that the traits are under the same gene action or pleiotropic action.
Table 2. Pearson's coefficient of correlation among body weight and measurements of Ouled-Djellal ewes*
Trait BW BL CS CW HTW SD BW 1 0.52* 0.72* 0.50* 0.33* 0.51* BL 1 0.20* 0.07NS 0.18* 0.11NS CS 1 0.50* 0.46* 0.44* CW 1 0.38* 0.52* HTW 1 0.30* SD 1
NS: not significant; * significant at P<0.001 for all correlation coefficients
Traits: bw: body weight, bl; body length), cs: chest size, cw: chest width, htw: height at withers, sd: side depth
3.3. Path coefficients of explanatory variables:
The direct and combined effects of body dimensions on the variation of body weight in Ouled-Djellal ewes were tested (full model). The sum of determination coefficients of any independent variable and interaction of two independent variables in this investigation was: ∑d=0.8008. The determination coefficient of error was 1-∑d=0.1992. In this model, trunk length (trl) had the highest direct contribution to the variation in body weight (R²=0.46
3.4. Deletion of less significant variables in the estimation of body weight:
The path coefficients and the indirect effects of neck length, trunk length, pelvis length, hip width, chest depth, height at sacrum and height at back were statistically non significant (P>0.05).This is an indications that these variables were less important in the estimation of body weight. These traits were removed from the regression model to obtain a more simplified equation. The optimum regression model was:
Y= -111.09 + 0.996BL+ 0.881CS + 0.798CW- 0.387HTW + 0.585SD
3.5. Coefficient of determination and establishment of preliminary regression equation:
Path coefficients of the independent variables are presented in table 3. Path analysis permits the partitioning of correlation coefficients into component parts (Topal and Esenbiuga, 2001; Woods et al., 2003). The first component is the path coefficient (beta weight) that measures the direct effect of the predictor variable on the response variable. The second component estimates the indirect effect of the predictor Correlation coefficients between chest size and body weight was of 0.72 (table 3). Its direct effect was high (path coefficient=0.5; P<0.001). This implies that one unit change in standard deviation of chest size results in 0.50 unit change in standard deviation of body weight.
Table 3: Direct and indirect effects (ID) of biometric traits on body weight of ewes
Traits Correlation Coefficient with body weight
Direct effect
BL(ID) CS(ID) CW(ID) HTW(ID) SD(ID) Total
BL 0.52 0.4401** 0.1001 -0.0181 -0.0226 0.0156 0.075 CS 0.72 0.5003** 0.088 0.1289 -0.0579 0.0619 0.2209 CW 0.50 0.2578** -0.0308 0.2502 -0.0478 0.0737 0.2453 HTW 0.33 -0.126** 0.0792 0.2301 0.0980 0.0425 0.4498 SD 0.51 0.1415** 0.0484 0.2201 0.1341 -0.0377 0.3649 **: significant at P<0.001
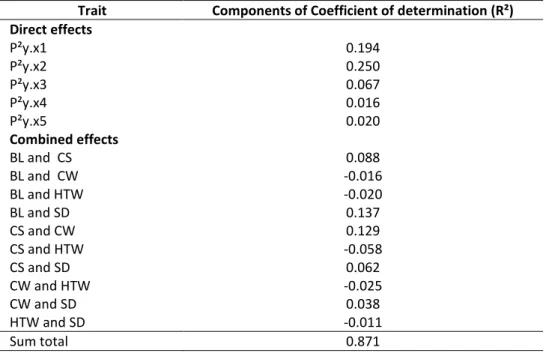
The direct effects of body length (0.44; P<0.001), chest width (0.26; P<0.001) and side depth (0.14; P<0.001) were positive and highly significant. However, the direct effect between height at withers and body weight was negative (-0.13; P<0.001) and significant, as well. All indirect effects were mostly low, not significant and not worth to mention. In this case, the direct effects were the most important in influencing on body weight, mainly through chest size and body length. The direct and combined effect of morphometric traits on the variation of body weight is presented in table 4. In ewes, the highest direct contribution to the variation of body weight was made by chest size (R²=0.25) and by body length (R²=0.19). The sum of determination coefficients and any independent variable and interaction of two independent variables in this investigation was ∑d=0.87. The determination coefficient of error was equivalent to 013.
In this investigation chest size and body length have the highest direct impact on body weight, closely followed by chest width. This result reveals the extent to which independent variables (cs, bl, cw) influenced directly the independent variable (body weight). According to this, a good decision and selection could be made through phenotypic correlation alone. The present finding in Ouled-Djellal ewes is the first one in Algeria, where chest size and body length were to be traits of a great importance in the prediction body weight from measurement of sheep. This could be a result of the fact that muscle and a little fat (due to a long march) along with bone structure contribute to the formation of a large chest size with a long body.
Table 4. Direct and combined effects of the independent variables contributing to the variation of body weight of Ouled-Djellal ewes
Trait Components of Coefficient of determination (R²)
Direct effects P²y.x1 P²y.x2 P²y.x3 P²y.x4 P²y.x5 0.194 0.250 0.067 0.016 0.020 Combined effects BL and CS BL and CW BL and HTW BL and SD CS and CW CS and HTW CS and SD CW and HTW CW and SD HTW and SD 0.088 -0.016 -0.020 0.137 0.129 -0.058 0.062 -0.025 0.038 -0.011 Sum total 0.871 4. Conclusion
Path analysis revealed that large chest size had the highest direct effect on body weight, followed by body length. All direct effects were significant. The optimum regression equation included chest size, body length, chest width, height at withers and side depth. These equations could serve as useful practical tool for livestock farmers, researchers and rural development workers for weight estimation in field and selection purposes.
Acknowledgements
The authors would like to thank the technicians and the farmers for carrying this work.
References
Akubu, A. (2010) Path coefficient and path analysis of body weight and biometric traits in Yankasa lambs. Slovac. J. Anim. Sci., 43(1): 17-25.
Aziz, M.A. and Sharby, M.A., (1993) Co linearity as a problem in predicting body weight from dimensions of Nadji sheep in Saudi Arabia. Small Rumin. Res. vol 12, p 117-124.
Chellig , R. (1992) Les races ovines Algériennes. Office des publications universitaires. 1, Place centrale de Ben Aknoun (Alger).1-80.
Dekhili, M and Aggoun, A. (2007) Performances reproductives des brebis de race Ouled-Djellal, dans deux milieux contrastés. Arch. Zootec. 56(216): 963-966.
Dekhli, M, Bounechada, M, and Mannalah, I. (2013) Multivariate analyses of morphological traits in Algerian goats , Sétif, north-eastern Algeria. Animal Genetic Resources. 52:57-57.
Keskin, A., Kor, A., karaca, S. Mirtagioglu, H. (2005) A study of relationships between milk yield and some udder traits using path analysis in makkeci goats. J. Anim. Vet. Adv, vol4: 547-550.
Lener L.M. and Donald, H.P. (1993) Modern development in animal breeding. Academic Press, 295pp.
Mendes, M., Karabayir, A. Pala, A. (2005) path analysis of the relationship between various body measures and live weight of American Bronze turkeys under three different lighting programs. Tarim Bilimleri Dergisi. 11:184-188.
Seker, H. and Serin, Y. (2004) Explanation of the relationships between seed yield and some morphological traits in smooth Bromegrass (Bromus inermis Leyss) by path analysis. Europian J. Agron. Vol. 21: 1-16.
SPSS (2001) Statistical Package for Social Sciences. SPSS Inc. 444 Michigan Avenue, Chicago, IL 60611.
Topal, M. and Esenbuga, N. (2001) A study of direct and indirect effects of some factors on weaning weight of awassi lambs. Tuk.J. Vet.Sci. 25:377-382.
Ullman, J.B. (1996) Structural equation modelling ( in using Multivariate Statistics, 3rd Edition, B.G. Tabachnick and L.S. Fidell, Eds). Harper Collins College Publishers, New York, NY. Pp 709-819.
Woods, P.S.A., Wynne, H., Ploeger, H.W. and Leonard, D.K. (2003) Path anlysis of subsistence farmer's use veterinary services in Zinbabwe. Preventive Veterinary Medecine. 61:339-358.