1 3 j u l y 2 0 1 7 | V O l 5 4 7 | N A T u R E | 1 7 3
ARTiclE
doi:10.1038/nature22969Fine-mapping inflammatory bowel
disease loci to single-variant resolution
Hailiang Huang1,2*§, Ming Fang3,4*, luke jostins5,6*, Maša umićević Mirkov7, Gabrielle Boucher8, carl A. Anderson7, Vibeke Andersen9,10, isabelle cleynen11, Adrian cortes5,12, François crins3,4, Mauro D’Amato13,14,15, Valérie Deffontaine3,4, julia Dmitrieva3,4, Elisa Docampo3,4, Mahmoud Elansary3,4, Kyle Kai-How Farh1,2,16, Andre Franke17, Ann-Stephan Gori3,4, Philippe Goyette8, jonas Halfvarson18, Talin Haritunians19, jo Knight20, ian c. lawrance21,22, charlie W. lees23, Edouard louis3,24, Rob Mariman3,4, Theo Meuwissen25, Myriam Mni3,4, yukihide Momozawa3,4,26, Miles Parkes27, Sarah l. Spain7,28,
Emilie Théâtre3,4, Gosia Trynka7, jack Satsangi23, Suzanne van Sommeren29, Severine Vermeire11,30, Ramnik j. Xavier2,31, international inflammatory Bowel Disease Genetics consortium†, Rinse K. Weersma29, Richard H. Duerr32,33,
christopher G. Mathew34,35, john D. Rioux8,36, Dermot P. B. McGovern19, judy H. cho37, Michel Georges3,4§, Mark j. Daly1,2§ & jeffrey c. Barrett7§
Inflammatory bowel diseases (IBDs) are a group of chronic, debilitating disorders of the gastrointestinal tract with peak onset in adolescence and early adulthood. More than 1.4 million people are affected in the USA alone1, with an estimated direct healthcare cost of US$6.3 billion per year. IBD affects millions worldwide, and is rising in prevalence, particularly in paediatric and non-European ancestry populations2. IBD has two subtypes, ulcerative colitis and Crohn’s disease, which have distinct presentations and treatment courses. So far, 200 genomic loci have been associated with IBD3,4, but only a handful have been conclusively ascribed to a specific causal variant with direct insight into the underlying disease biology. This scenario is common to all genetically complex
diseases, where the pace of identifying associated loci outstrips that of defining specific molecular mechanisms and extracting biological insight from each association.
The widespread correlation structure of the human genome (known as linkage disequilibrium) often results in similar evidence for asso-ciation among many neighbouring variants. However, unless linkage disequilibrium is perfect (r2 = 1), it is possible, with a sufficiently large sample size, to statistically resolve causal variants from neighbours even at high levels of correlation (Extended Data Fig. 1 and ref. 5). Novel statistical approaches applied to very large datasets that address this problem6 require that the highly correlated variants are directly Inflammatory bowel diseases are chronic gastrointestinal inflammatory disorders that affect millions of people worldwide. Genome-wide association studies have identified 200 inflammatory bowel disease-associated loci, but few have been conclusively resolved to specific functional variants. Here we report fine-mapping of 94 inflammatory bowel disease loci using high-density genotyping in 67,852 individuals. We pinpoint 18 associations to a single causal variant with greater than 95% certainty, and an additional 27 associations to a single variant with greater than 50% certainty. These 45 variants are significantly enriched for protein-coding changes (n = 13), direct disruption of transcription-factor binding sites (n = 3), and tissue-specific epigenetic marks (n = 10), with the last category showing enrichment in specific immune cells among associations stronger in Crohn’s disease and in gut mucosa among associations stronger in ulcerative colitis. The results of this study suggest that high-resolution fine-mapping in large samples can convert many discoveries from genome-wide association studies into statistically convincing causal variants, providing a powerful substrate for experimental elucidation of disease mechanisms.
1Analytic and Translational Genetics Unit, Massachusetts General Hospital, Harvard Medical School, Boston, Massachusetts 02114, USA. 2Broad Institute of MIT and Harvard, Cambridge, Massachusetts 02141, USA. 3Unit of Medical Genomics, Groupe Interdisciplinaire de Génoprotéomique Appliquée (GIGA-R) Research Center and WELBIO, University of Liège, 4000 Liège, Belgium. 4Faculty of Veterinary Medicine, University of Liège, 4000 Liège, Belgium. 5Wellcome Trust Centre for Human Genetics, University of Oxford, Headington OX3 7BN, UK. 6Christ Church, University of Oxford, St Aldates OX1 1DP, UK. 7Wellcome Trust Sanger Institute, Wellcome Genome Campus, Hinxton, Cambridgeshire CB10 1SA, UK. 8Research Center, Montreal Heart Institute, Montréal, Québec H1T 1C8, Canada. 9Focused research unit for Molecular Diagnostic and Clinical Research (MOK), IRS-Center Sonderjylland, Hospital of Southern Jutland, 6200 Åbenrå, Denmark. 10Institute of Molecular Medicine, University of Southern Denmark, 5000 Odense, Denmark. 11Department of Human Genetics, KU Leuven, 3000 Leuven, Belgium. 12Oxford Centre for Neuroinflammation, Nuffield Department of Clinical Neurosciences, Division of Clinical Neurology, John Radcliffe Hospital, University of Oxford, Oxford OX3 9DS, UK. 13Clinical Epidemiology Unit, Department of Medicine Solna, Karolinska Institutet, 17176 Stockholm, Sweden. 14Department of Gastrointestinal and Liver Diseases, BioDonostia Health Research Institute, 20014 San Sebastián, Spain. 15IKERBASQUE, Basque Foundation for Science, 48013 Bilbao, Spain. 16Illumina, San Diego, California 92122, USA. 17Institute of Clinical Molecular Biology, Christian-Albrechts-University of Kiel, 24118 Kiel, Germany. 18Department of Gastroenterology, Faculty of Medicine and Health, Örebro University, SE-70182 Örebro, Sweden. 19F. Widjaja Foundation Inflammatory Bowel and Immunobiology Research Institute, Cedars-Sinai Medical Center, Los Angeles, California 90048, USA. 20Data Science Institute and Lancaster Medical School, Lancaster University, Lancaster LA1 4YG, UK. 21Centre for Inflammatory Bowel Diseases, Saint John of God Hospital, Subiaco, Western Australia 6008, Australia. 22Harry Perkins Institute for Medical Research, School of Medicine and Pharmacology, University of Western Australia, Murdoch, Western Australia 6150, Australia. 23Gastrointestinal Unit, Western General Hospital University of Edinburgh, Edinburgh, UK. 24Division of Gastroenterology, Centre Hospitalier Universitaire (CHU) de Liège, 4000 Liège, Belgium. 25Institute of Livestock and Aquacultural Sciences, Norwegian University of Life Sciences, 1430 Ås, Norway. 26Laboratory for Genotyping Development, Center for Integrative Medical Sciences, RIKEN, Yokohama, Kanagawa 230-0045, Japan. 27Inflammatory Bowel Disease Research Group, Addenbrooke’s Hospital, Cambridge CB2 0QQ, UK. 28Open Targets, Wellcome Trust Genome Campus, Hinxton, Cambridgeshire CB10 1SD, UK. 29Department of Gastroenterology and Hepatology, University of Groningen and University Medical Center Groningen, 9700RB Groningen, The Netherlands. 30Division of Gastroenterology, University Hospital Gasthuisberg, 3000 Leuven, Belgium. 31Gastroenterology Unit, Massachusetts General Hospital, Harvard Medical School, Boston, Massachusetts 02114, USA. 32Division of Gastroenterology, Hepatology and Nutrition, Department of Medicine, University of Pittsburgh School of Medicine, Pittsburgh, Pennsylvania 15213, USA. 33Department of Human Genetics, University of Pittsburgh Graduate School of Public Health, Pittsburgh, Pennsylvania 15261, USA. 34Department of Medical and Molecular Genetics, King’s College London, London SE1 9RT, UK. 35Sydney Brenner Institute for Molecular Bioscience, University of the Witwatersrand, Johannesburg 2193, South Africa. 36Faculté de Médecine, Université de Montréal, Montréal, Québec H3C 3J7, Canada. 37Department of Genetics, Yale School of Medicine, New Haven, Connecticut 06510, USA.
* These authors contributed equally to this work. §These authors jointly supervised this work.
†Lists of participants and their affiliations appear in the Supplementary Information.
1 7 4 | N A T u R E | V O l 5 4 7 | 1 3 j u l y 2 0 1 7
genotyped or imputed with certainty. Truly high-resolution mapping data, when combined with increasingly sophisticated and comprehen-sive public databases annotating the putative regulatory function of DNA variants, are likely to reveal novel insights into disease pathogen-esis7–9 and the mechanisms of disease-associated variants.
Genetic architecture of associated loci
We genotyped 67,852 individuals of European ancestry, including 33,595 with IBD (18,967 Crohn’s disease and 14,628 ulcerative colitis) and 34,257 healthy controls using the Illumina ImmunoChip (Extended Data Table 1). This genotyping array was designed to include all known variants from European individuals in the February 2010 release of the 1000 Genomes Project10,11 in 187 high-density regions known to be associated with one or more immune-mediated diseases12. Because fine-mapping uses subtle differences in strength of associa-tion between tightly correlated variants to infer which is most likely to be causal, it is particularly sensitive to data quality. We therefore performed stringent quality control to remove genotyping errors and batch effects (Methods). We imputed into this dataset from the 1000 Genomes Project reference panel13,14 to fill in variants missing from the ImmunoChip, or filtered out by our quality control (Extended Data Fig. 2). We then evaluated the 97 high-density regions that had previous IBD associations3 and contained at least one variant showing significant association (Methods) in this dataset. The major histocompatibility complex was excluded from these analyses as fine-mapping has been reported elsewhere15.
We applied three complementary Bayesian fine-mapping methods that used different priors and model selection strategies to identify independent association signals within a region, and to assign a poste-rior probability of causality to each variant (Supplementary Methods and Extended Data Fig. 2). For each independent signal detected by each method, we sorted all variants by the posterior probability of asso-ciation, and added variants to the ‘credible set’ of associated variants until the sum of their posterior probability exceeded 95%: that is, the credible set contained the minimum list of DNA variants that were > 95% likely to contain the causal variant (Fig. 1). These sets ranged in size from 1 to > 400 variants. We merged these results and subsequently focused only on signals where an overlapping credible set of variants was identified by at least two of the three methods and all variants were either directly genotyped or imputed with INFO score > 0.4 (Methods and Fig. 1).
In 3 out of 97 regions, a consistent credible set could not be identi-fied; when multiple independent effects exist in a region of very high linkage disequilibrium, multiple distinct fine-mapping solutions may not be distinguishable (Supplementary Note). Sixty-eight of the remain-ing 94 regions contained a sremain-ingle association, while 26 harboured 2 or more independent signals, for a total of 139 independent associations defined across the 94 regions (Fig. 2a). Only IL23R and NOD2 (both
previously established to contain multiple associated protein-coding variants16) contained more than three independent signals. Consistent with previous reports3, the vast majority of signals were associated with both Crohn’s disease and ulcerative colitis, although many of these had a significantly stronger association with one subtype. For the enrich-ment analyses below, we compared 79 signals that were more strongly associated with Crohn’s disease with 23 signals that were more strongly associated with ulcerative colitis (the remaining 37 were equally asso-ciated with both subtypes, Supplementary Table 1).
Using a restricted maximum likelihood mixed-model approach17, we evaluated the proportion of total variance in disease risk attributed to these 94 regions and how much of that was explained by the 139 specific associations. We estimated that 25% of Crohn’s disease risk was explained by the specific associations described here, out of a total of 28% explained by these loci (correspondingly for ulcerative colitis: 17% out of 22%). The single strongest signals in each region contrib-uted 76% of this variance explained and the remaining associations contributed 24% (Extended Data Fig. 3), highlighting the importance of secondary and tertiary associations in results from genome-wide association studies (GWAS)15,18.
Associations mapped to a single variant
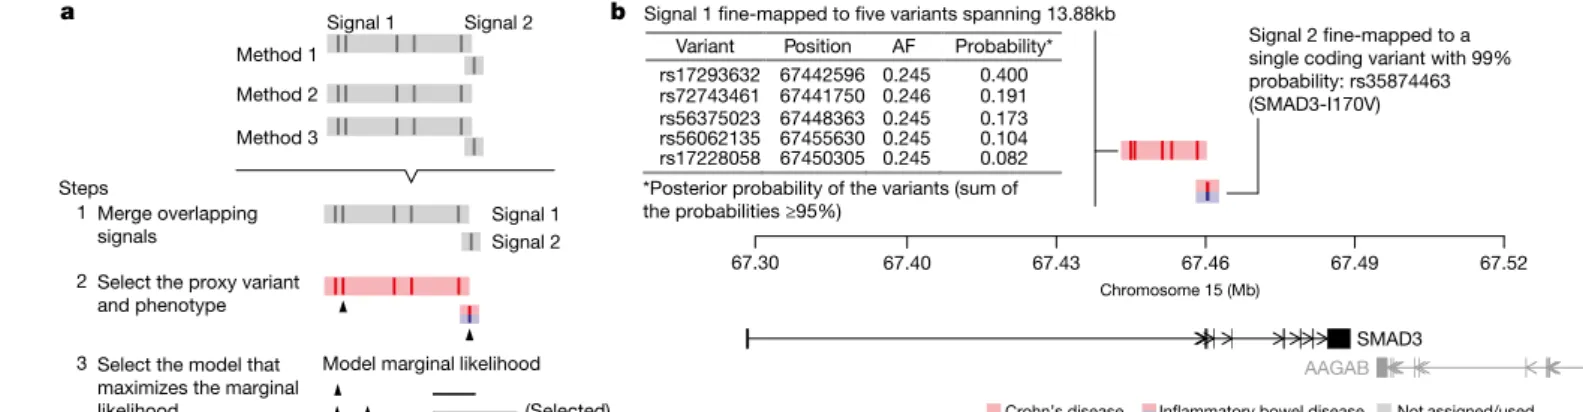
For 18 signals, the 95% credible set consisted of a single variant (‘single variant credible sets’), and for 24 others the credible set consisted of 2–5 variants (Fig. 2b). The single-variant credible sets included five previously reported coding variants: three in NOD2 (fs1007insC, R702W, G908R), a rare protective allele in IL23R (V362I), and a splice variant in CARD9 (c.IVS11+ 1G> C)16,19. The remaining single-variant credible sets comprised three missense variants (I170V in SMAD3, I923V in IFIH1, and N289S in NOD2), four intronic variants (in IL2RA, Variant Position AF Probability*
rs17293632 67442596 0.245 0.400 rs72743461 67441750 0.246 0.191 rs56375023 67448363 0.245 0.173 rs56062135 67455630 0.245 0.104 rs17228058 67450305 0.245 0.082 Chromosome 15 (Mb) 67.40 67.43 67.46 67.49 67.52
Signal 1 fine-mapped to five variants spanning 13.88kb
AAGAB SMAD3 *Posterior probability of the variants (sum of
the probabilities ≥95%) Signal 1 Signal 2
Merge overlapping signals
Select the proxy variant and phenotype Select the model that maximizes the marginal
likelihood Crohn’s disease Inflammatory bowel disease
a b
Signal 2 fine-mapped to a single coding variant with 99% probability: rs35874463 (SMAD3-I170V) Not assigned/used Method 1 Method 2 Method 3 (Selected) Model marginal likelihood 1 2 3 Steps Signal 1 Signal 2 67.30
Figure 1 | Fine-mapping procedure and output using the SMAD3 region as an example. a, (1) We merge overlapping signals across methods;
(2) we select a lead variant (black triangle) and phenotype (colour); and (3) we choose the best model. Details for each step are available in
Methods. b, Example fine-mapping output. This region has been mapped to two independent signals. For each signal, we report the phenotype it is associated with (coloured), the variants in the credible set, and their posterior probabilities. AF, allele frequency.
Not resolved
3 68 16 8 2
1
139 independent signals identified in 94 regions
97 regions
2 3 4+
139 signals
45 variants have probability >50%
≥95%
a
c Posterior probability for variant to be causal:
Number of signals/region:
18 24 27 21 26 23
1 2–5 6–10 11–20 21–50 51+
Number of variants in each signal:
b
116 signals fine-mapped to ≤50 variants
50–95% 10–50% 1–10% <1%
18 27 216 763 402
45 variants have probability >50%
Figure 2 | Summary of fine-mapped associations. a, Independent
signals. Sixty-eight loci containing one association and 26 loci containing multiple associations. b, Number of variants in credible sets. Eighteen associations were fine-mapped to a single variant, and 116 to ≤ 50 variants.
c, Distribution of the posterior probability of the variants in credible sets
having ≤ 50 variants.
1 3 j u l y 2 0 1 7 | V O l 5 4 7 | N A T u R E | 1 7 5
LRRK2, NOD2, and RTEL1/TNFRSF6B), and six intergenic variants
(located 3.7 kilobases (kb) downstream of GPR35; 3.9 kb upstream of PRDM1; within a EP300 binding site 39.9 kb upstream of IKZF1; 500 base pairs (bp) before the transcription start site of JAK2; 9.4 kb upstream of NKX2-3; and 3.5 kb downstream from HNF4A) (Table 1). Of note, while physical proximity did not guarantee functional rele-vance, the credible set of variants for 30 associated loci now implicated a specific gene either because it resided within 50 kb of only that gene or had a coding variant with > 50% probability—improved from only 3 so refined using an earlier HapMap-based definition. Using the same definitions, the total number of potential candidate genes was reduced from 669 to 233. Examples of IBD candidate genes clearly prioritized in our data are described in the Supplementary Box, and a customizable browser (http://finemapping.broadinstitute.org/) is available to review the detailed fine-mapping results.
Associated protein-coding variants
We first annotated the possible functional consequences of the IBD variants by their effect on the amino-acid sequences of proteins. Thirteen out of 45 variants (Fig. 2c) that had > 50% posterior
probability were non-synonymous (Table 1), an 18-fold enrichment (enrichment P = 2 × 10⁻¹³, Fisher’s exact test) relative to randomly drawn variants in our regions (Fig. 3a). By contrast, only one variant with > 50% probability was synonymous (enrichment P = 0.42). All common coding variants previously reported to affect IBD risk were included in a 95% credible set, including IL23R (R381Q, V362I, and G149R); CARD9 (c.IVS11+ 1G> C and S12N); NOD2 (S431L, R702W, V793M, N852S, and G908R, fs1007insC); ATG16L1 (T300A); PTPN22 (R620W); and FUT2 (W154X). While this enrichment of coding varia-tion (Fig. 3a) provided assurance about the accuracy of our approach, it did not suggest that 30% of all associations were caused by coding variants; rather, it was almost certainly the case that associated coding variants had stronger effect sizes, making them easier to fine-map.
Associated non-coding variants
We next examined conserved nucleotides in high-confidence binding- site motifs of 84 transcription factor families20 (Methods). There was a significant positive correlation between transcription-factor motif disruption and IBD association posterior probability (P = 0.006, logistic regression) (Fig. 3a), including three variants with > 50% probability
Table 1 | Variants having posterior probability >50%
Variant Chr Position Ns Phe AF Prob INFO Func Annotation
Signals mapped to a single variant
rs7307562 12 40724960 2 CD 0.398 0.999 1 LRRK2 (intronic)
rs2066844 16 50745926 10 CD 0.063 0.999 0.8 C NOD2 (R702W)
rs2066845 16 50756540 10 CD 0.022 0.999 1 C NOD2 (G908R)
rs6017342 20 43065028 2 UC 0.544 0.999 1 E HNF4A (downstream), Gut_H3K27ac
rs61839660 10 6094697 2 CD 0.094 0.999 1 E IL2RA (intronic), Immune_H3K4me1
rs5743293 16 50763781 10 CD 0.964 0.999 1 C NOD2 (fs1007insC)
rs6062496 20 62329099 1 IBD 0.587 0.996 1 T RTEL1-TNFRSF6B (ncRNA_intronic), EBF1 TFBS
rs141992399 9 139259592 3 IBD 0.005 0.995 1 C CARD9 (1434+ 1G> C)
rs35667974 2 163124637 1 UC 0.021 0.994 1 C IFIH1 (I923V)
rs74465132 7 50304782 3 IBD 0.034 0.994 1 T, E IKZF1 (upstream), EP300 TFBS, Immune_H3K4me1
rs4676408 2 241574401 1 UC 0.508 0.994 0.99 GPR35 (downstream)
rs5743271 16 50744688 10 CD 0.007 0.993 1 C NOD2 (N289S)
rs10748781 10 101283330 2 IBD 0.55 0.990 1 E NKX2-3 (upstream), Gut_H3K27ac
rs35874463 15 67457698 2 IBD 0.054 0.989 1 C, E SMAD3 (I170V), Gut_H3K27ac
rs72796367 16 50762771 10 CD 0.023 0.983 1 NOD2 (intronic)
rs1887428 9 4984530 1 IBD 0.603 0.974 0.97 JAK2 (upstream)
rs41313262 1 67705900 5 CD 0.014 0.973 1 C IL23R (V362I)
rs28701841 6 106530330 2 CD 0.116 0.971 1 PRDM1 (upstream)
Signals mapped to 2–50 variants and the lead variant has posterior probability >50%
rs76418789 1 67648596 5 CD 0.006 0.937 0.59 C IL23R (G149R) rs7711427 5 40414886 3 CD 0.633 0.919 1 rs1736137 21 16806695 2 CD 0.407 0.879 1 rs104895444 16 50746199 10 CD 0.003 0.865 1 C NOD2 (V793M) rs56167332 5 158827769 2 IBD 0.353 0.845 1 IL12B rs104895467 16 50750810 10 CD 0.002 0.833 1 C NOD2 (N852S) rs630923 11 118754353 2 CD 0.153 0.820 0.98
rs3812565 9 139272502 3 IBD 0.402 0.815 1 Q eQTL of INPP5E in CD4 and CD8; CARD9 in CD14
rs4655215 1 20137714 3 UC 0.763 0.784 1 E Gut_H3K27ac rs145530718 19 10568883 3 CD 0.023 0.762 0.97 rs6426833 1 20171860 3 UC 0.555 0.752 1 chr20:43258079 20 43258079 2 CD 0.041 0.736 0.88 rs17229679 2 199560757 2 UC 0.028 0.716 1 rs4728142 7 128573967 1 UC 0.448 0.664 1 E Immune_H3K4me1 rs2143178 22 39660829 2 IBD 0.157 0.662 1 T, E NF-kB TFBS, Gut_H3K27ac rs34536443 19 10463118 3 CD 0.038 0.649 1 C TYK2 (P1104A) rs138425259 16 50663477 10 UC 0.009 0.648 0.92 rs146029108 9 139329966 3 CD 0.036 0.643 0.92 rs12722504 10 6089777 2 CD 0.26 0.615 1 rs60542850 19 10488360 3 IBD 0.17 0.591 0.89
rs2188962 5 131770805 1 CD 0.44 0.590 1 E, Q Gut_H3K27ac, eQTL of SLC22A5 in CD14, CD15 and IL
rs2019262 1 67679990 5 IBD 0.4 0.586 1 rs3024493 1 206943968 2 IBD 0.171 0.537 1 E Immune_H3K4me1 rs7915475 10 64381668 3 CD 0.304 0.528 1 rs77981966 2 43777964 1 CD 0.077 0.521 1 rs9889296 17 32570547 1 CD 0.264 0.512 1 rs2476601 1 114377568 1 CD 0.908 0.508 1 C PTPN22 (W620R)
Chr, chromosome; Ns, number of independent signals in the locus; Phe, phenotype; AF, allele frequency; Prob, posterior probability for being a causal variant, INFO, imputation; Func, functional annotations: coding (C), disrupting transcription-factor binding sites (T), overlapping epigenetic peaks (E), and co-localization with eQTL (Q); CD, Crohn’s disease; IBD, inflammatory bowel disease; UC, ulcerative colitis.
1 7 6 | N A T u R E | V O l 5 4 7 | 1 3 j u l y 2 0 1 7
(two > 95%). In the RTEL1/TNFRSF6B region, rs6062496 is predicted to disrupt a transcription-factor binding motif site (TFBS) for EBF1, a transcription factor involved in the maintenance of B-cell identity and prevention of alternative fates in committed cells21. A low-frequency (3.6%) protective allele at rs74465132 creates a binding site for EP300 less than 40 kilobase pairs (kbp) upstream of IKZF1. The third notable example of TFBS disruption, although not in a single variant credible set, is detailed in the Supplementary Box for the association at SMAD3.
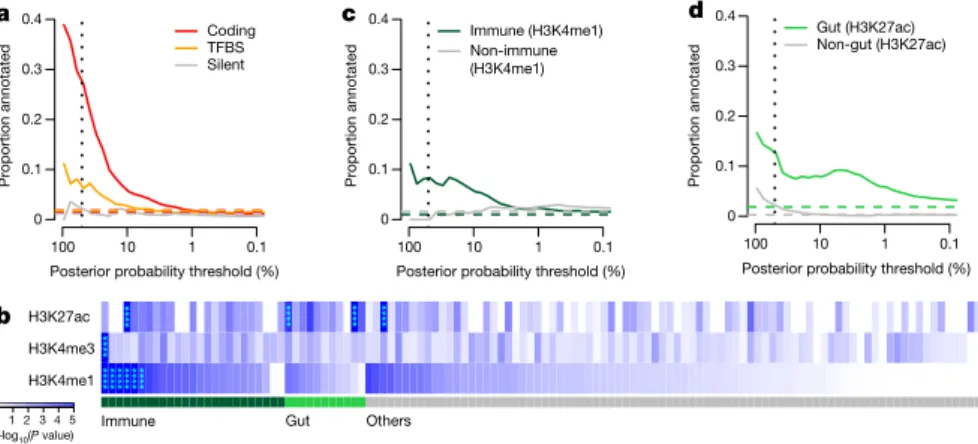
Recent studies have shown that trait-associated variants are enriched for epigenetic marks highlighting cell-type-specific reg-ulatory regions9,22,23. We compared our credible sets with ChIP-seq peaks (chromatin immunoprecipitation followed by sequencing) cor-responding to ChIP with H3K4me1, H3K4me3, and H3K27ac (shown previously22,23 to highlight enhancers, promoters, and active regula-tory elements, respectively) in 120 adult and fetal tissues, assayed by the Roadmap Epigenomics Mapping Consortium24 (Fig. 3b). Using a threshold of P = 1.3 × 10⁻⁴ (0.05 corrected for 360 tests), we observed significant enrichment of H3K4me1 in 6 immune cell types and for H3K27ac in 2 gastrointestinal (gut) samples (sigmoid colon and rectal mucosa) (Fig. 3b and Supplementary Table 2). The subset of signals that were more strongly associated with Crohn’s disease overlapped more with immune-cell chromatin peaks, whereas ulcerative colitis signals overlapped more with gut chromatin peaks (Supplementary Table 2).
These three chromatin marks were correlated both within tissues (we observed additional signal in other marks in the tissues described above) and across related tissues. We therefore defined a set of ‘core immune peaks’ for H3K4me1 and ‘core gut peaks’ for H3K27ac as the set of overlapping peaks in all enriched immune cell and gut tissue types, respectively. These two sets of peaks were independently signif-icant and captured the observed enrichment compared with ‘control peaks’ made up of the same number of ChIP-seq peaks across our 94 regions in non-immune and non-gut tissues (Fig. 3c, d). These two tracks summarized our epigenetic-GWAS overlap signal, and the com-bined excess over the baseline suggested that a substantial number of regions, particularly those not mapped to coding variants, may ulti-mately be explained by functional variation in recognizable enhancer/ promoter elements.
Overlap with expression quantitative trait loci
Variants that change enhancer or promoter activity might change gene expression, and baseline expression of many genes has been found to be regulated by genetic variation25–27. Indeed, it has been suggested that these so-called expression quantitative trait loci (eQTLs) underlie a large proportion of GWAS associations25,28. We therefore searched for variants that were both in an IBD-associated credible set with 50 or fewer variants, and the most significantly associated eQTL variant for a gene in a study29 of peripheral blood mononuclear cells (PBMCs) from 2,752 twins. Sixty-eight of the 76 regions with signals fine-mapped to ≤ 50 variants harboured at least one significant eQTL (affecting a gene within 1 megabase with P < 10−5). Despite this abundance of eQTLs in fine-mapped regions, only 3 credible sets included the most
signifi-cantly associated eQTL variants, compared with 3.7 expected by chance (Methods). Data from a more recent study30 using PBMCs from 8,086 individuals did not yield a substantively different outcome, demon-strating a modest but non-significant enrichment (8 observed overlaps, 4.2 expected by chance, P = 0.06). Using a more lenient definition of overlap, requiring the lead eQTL variant to be in linkage disequilib-rium (R2 > 0.4) with an IBD credible set variant, increased the number of potential overlaps but again these numbers were not greater than chance expectation.
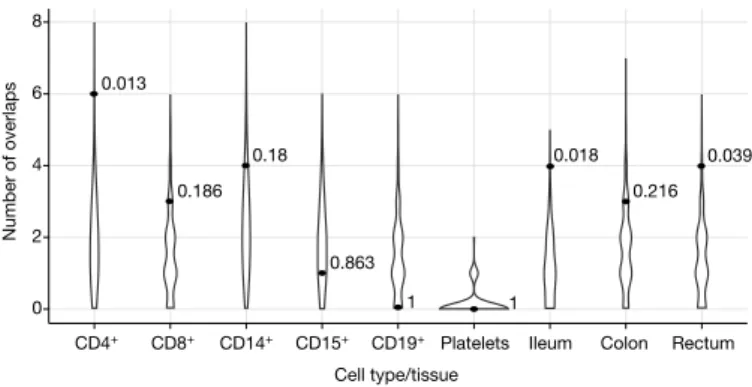
As PBMCs are a heterogeneous collection of immune cell popu-lations, cell-type-specific signals or signals corresponding to genes expressed most prominently in non-immune tissues may be missed. We therefore tested the enrichment of eQTLs that overlapped credible sets in five primary immune cell populations (CD4+, CD8+, CD19+, CD14+, and CD15+), platelets, and three distinct intestinal locations (rectum, colon, and ileum) isolated from 350 healthy individuals (Methods). We observed a significant enrichment of credible single nucleotide polymorphism (SNP)/eQTL overlaps in CD4+ cells and ileum (Extended Data Table 2): 3 and 2 credible sets overlapped eQTLs, respectively, compared with 0.4 and 0.3 expected by chance (P = 0.005 and 0.020). An enrichment was also observed for the naive CD14+ cells from another study31: 8 overlaps observed compared with 2.7 expected by chance (P = 0.001). We did not observe enrichment of overlaps in stimulated (with interferon or lipopolysaccharide) CD14+ cells from the same source (Extended Data Table 2).
We investigated eQTL overlaps more deeply by applying two co- localization approaches (one frequentist, one Bayesian, Methods) to our cell-separated dataset where primary genotype and expression data were available. We confirmed greater than expected overlap with eQTLs in CD4+ and ileum described above (Fig. 4 and Extended Data Table 2). These CD4+ co-localized eQTLs also had stronger overlap with CD4+ ChIP-seq peaks than our other credible sets, further supporting a regulatory causal mechanism. The number of co- localizations in other purified cell types and tissues was largely indis-tinguishable from what we expected under the null using either method, except for moderate enrichment in rectum (4 observed and 1.4 expected, P = 0.039, Frequentist approach) and colon (3 observed and 0.8 expected, P = 0.04, Bayesian approach). Only two of these co- localizations corresponded to an IBD variant with causal probability > 50% (Table 1 and Extended Data Fig. 4a).
Discussion
We have performed fine-mapping of 94 previously reported genetic risk loci for IBD. Rigorous quality control followed by an integration of three novel fine-mapping methods generated lists of genetic variants accounting for 139 independent associations across these loci. Our methods are concordant with an existing fine-mapping method6 (67 of 68 credible sets in single-signal regions overlap, including exact matches for all single variant credible sets), and provide extensions to support the phenotype assignment (Crohn’s disease, ulcerative colitis, or IBD) and the conditional estimation of multiple credible sets in
**** **** 0 1 2 3 4 5 –log10(P value) b Gut Others Immune
Posterior probability threshold (%)
Proportion annotated a 100 10 1 0.1 0 0.1 0.2 0.3 0.4 Coding TFBS Silent
Posterior probability threshold (%)
Proportion annotated c 100 10 1 0.1 0 0.1 0.2 0.3 0.4 Immune (H3K4me1) Non-immune (H3K4me1)
Posterior probability threshold (%)
Proportion annotate d d 100 10 1 0.1 0 0.1 0.2 0.3 0.4 Gut (H3K27ac) Non-gut (H3K27ac) H3K27ac H3K4me3 H3K4me1 **** **** **** ******** ******** **** ****
Figure 3 | Functional annotation of causal variants. a, Proportion of credible variants that
are protein-coding, disrupt/create TFBS or are synonymous, sorted by posterior probability.
b, Epigenetic peaks overlapping credible variants
in cell and tissue types from the Roadmap Epigenomics Consortium39. Significant enrichment
has been marked with asterisks. Proportion of credible variants that overlap (c) core immune peaks for H4K4me1 or (d) core gut peaks for H3K27ac (Methods). In a, c and d, the vertical dotted lines mark 50% posterior probability and the horizontal dashed lines show the background proportions of each functional category.
1 3 j u l y 2 0 1 7 | V O l 5 4 7 | N A T u R E | 1 7 7 loci with multiple independent signals. The use of multiple methods
allowed us to focus our downstream analyses on loci where the choice of fine-mapping method did not substantially alter conclusions about the biology of IBD. Our results improve on previous fine-mapping efforts using a preset linkage disequilibrium threshold32 (for example,
r2 > 0.6) (Extended Data Fig. 5) by formally modelling the posterior probability of association of every variant. Much of this resolution derives from the very large sample size we used, because the number of variants in a credible set decreases with increasing significance (P = 0.0069).
The high-density of genotyping also aids in improved resolution. For instance, the primary association at IL2RA has now been mapped to a single variant associated with Crohn’s disease, rs61839660. This variant was not present in the HapMap 3 reference panel and was therefore not reported in earlier studies3,33 (nearby tagging variants, rs12722489 and rs12722515, were reported instead). Imputation using the 1000 Genomes Project reference panel and the largest assembled GWAS dataset3 did not separate rs61839660 from its neighbours (H.H., unpub-lished observations), owing to the loss of information in imputation using the limited reference. Only direct genotyping, available in the ImmunoChip high-density regions, allowed the conclusive identifica-tion of the causal variant.
Accurate fine-mapping should, in many instances, ultimately point to the same variant across diseases in shared loci. Among our single-variant credible sets, we fine-mapped an ulcerative colitis association to a rare missense variant (I923V) in IFIH1, which is also associated with type 1 diabetes34 with an opposite direction of effect (Supplementary Box). The intronic variant noted above (rs61839660, allele frequency = 9%) in IL2RA was also similarly associated with type 1 diabetes, again with a discordant directional effect35 (Supplementary Box). Simultaneous high-resolution fine-mapping in multiple diseases should therefore better clarify both shared and distinct biology.
Resolution of fine-mapping can be further improved by leveraging linkage disequilibrium from other ethnicities36. However, the sample size from other ethnicities we have collected is small compared with European samples (9,846 across East Asian, South Asian, and Middle Eastern). Limited access to matched imputation reference panels from all cohorts and the fact that the smaller non-European sets are not from populations (for example, African-derived) with narrower linkage disequilibrium also suggest that gains in fine-mapping accuracy would be limited at this time. Ultimately this effort will be aided by more sub-stantial investment in genotyping non-European population samples and by developing and applying more robust trans-ethnic fine-mapping algorithms.
A new release of the 1000 Genomes (phase 3)37 and the UK10K38 project have introduced new variants that were not present in the reference panel in our study. Our major findings remain the same using this new reference panel: the 18 single-variant credible sets are not in
high linkage disequilibrium (r2 > 0.95) with any new variants in either new dataset, and the 1,426 variants in IBD associations mapped to ≤ 50 variants are in high linkage disequilibrium with only 47 new variants (3.3% of the total size of these credible sets, Supplementary Table 1). Given that this release represents a near-complete catalogue of variants with minor allele frequency (MAF) > 1% in European populations, we believe our current fine-mapping results are likely to be robust, especially for common variant associations. High-resolution fine-mapping demonstrates that causal variants are significantly enriched for variants that alter protein-coding variants or disrupt transcription-factor binding motifs. Enrichment was also observed in H3K4me1 marks in immune-related cell types and H3K27ac marks in sigmoid colon and rectal mucosal tissues, with Crohn’s dis-ease loci demonstrating a stronger immune signature and ulcerative colitis loci more enriched for gut tissues (P values 0.014, 0.0005, and 0.0013 respectively for H3K4me1, H3K27ac, and H3K4me3; χ2 test). By contrast, overall enrichment of eQTLs is quite modest compared with previous reports and not seen strongly in excess of chance in our well-refined credible sets (≤ 50 variants). This result emphasizes the importance of high-resolution mapping and the careful incorporation of the high background rate of eQTLs. It is worth noting that evaluat-ing the overlap between two distinct mappevaluat-ing results is fundamentally different from comparing genetic mapping results to fixed genomic features, and depends on both mappings being well resolved. Although these data challenge the hypothesis that easily surveyed baseline eQTLs explain a large proportion of non-coding GWAS signals, the modest excesses observed in smaller but cell-specific datasets suggest that much larger tissue- or cell-specific studies (and under the correct stimuli or developmental time points) will resolve the contribution of eQTLs to GWAS hits.
Resolving multiple independent associations may often help target the causal gene more precisely. For example, the SMAD3 locus hosts a non-synonymous variant and a variant disrupting the conserved tran-scription-factor binding site (also overlapping the H3K27ac marker in gut tissues), unambiguously articulating a role in disease and providing an allelic series for further experimental inquiry. Similarly, the TYK2 locus has been mapped to a non-synonymous variant and a variant disrupting a conserved transcription-factor binding site (http:// finemapping.broadinstitute.org/).
One-hundred and sixteen associations have been fine-mapped to ≤ 50 variants. Among them, 27 associations contain coding variants, 20 contain variants disrupting transcription-factor binding motifs, and 45 are within histone H3K4me1- or H3K27ac-marked DNA regions. The best-resolved associations—45 variants having > 50% posterior probabilities for being causal (Table 1)—are similarly significantly enriched for variants with known or presumed function from genome annotation. Of these, 13 variants cause non-synonymous change in amino acids, 3 disrupt a conserved transcription-factor binding motif, 10 are within histone H3K4me1- or H3K27ac-marked DNA regions in disease-relevant tissues, and 2 co-localize with a significant cis-eQTL (Extended Data Fig. 4a). Risk alleles of these variants can be found throughout the allele frequency spectrum, with protein-coding variants having somewhat larger effects and more extreme risk allele frequencies (Extended Data Fig. 6a–c).
This analysis, however, leaves 21 non-coding variants (Extended Data Fig. 4b), all of which have > 50% probabilities of being causal (five have > 95%), that are not located within known motifs, anno-tated elements, or in any experimentally determined ChIP-seq peaks or eQTL credible sets yet discovered. While we have identified a statis-tically compelling set of genuine associations (often intronic or within 10 kb of strong candidate genes), we can make little inference about function. For example, the intronic single-variant credible set of LRRK2 has no annotation, eQTL, or ChIP-seq peak of note. This emphasizes the incompleteness of our knowledge about the function of non-coding DNA and its role in disease, and calls for comprehensive studies on transcriptomes and epigenomes in a wide range of cell lines and 0.013 0.186 0.18 0.863 1 1 0.018 0.216 0.039 0 2 4 6 8
CD4+ CD8+ CD14+ CD15+ CD19+ Platelets Ileum Colon Rectum
Cell type/tissue
Number of overlap
s
Figure 4 | Number of credible sets that co-localize eQTLs. Distributions
of the number of co-localizations by chance (violins) and observed number of co-localizations with P values (dots). Both the background and the observed numbers were calculated using the ‘Frequentist co-localization using conditional P values’ approach (Methods).
1 7 8 | N A T u R E | V O l 5 4 7 | 1 3 j u l y 2 0 1 7
stimulation conditions. That most of the best-refined non-coding asso-ciations have no available annotation is perhaps sobering with respect to how well we may currently be able to interpret non-coding variation in medical sequencing efforts. It does suggest, however, that detailed fine-mapping of GWAS signals down to single variants, combined with emerging high-throughput genome-editing methodology, may be among the most effective ways of advancing to a greater understanding of the biology of the non-coding genome.
Online Content Methods, along with any additional Extended Data display items and Source Data, are available in the online version of the paper; references unique to these sections appear only in the online paper.
received 17 October 2015; accepted 7 May 2017. Published online 28 June; corrected online 12 July 2017 (see full-text HTML version for details).
1. Kappelman, M. D. et al. Direct health care costs of Crohn’s disease and ulcerative colitis in US children and adults. Gastroenterology 135, 1907–1913 (2008). 2. Molodecky, N. A. et al. Increasing incidence and prevalence of the inflammatory
bowel diseases with time, based on systematic review. Gastroenterology 142, 46–54.e42 (2012).
3. Jostins, L. et al. Host–microbe interactions have shaped the genetic architecture of inflammatory bowel disease. Nature 491, 119–124 (2012). 4. Liu, J. Z. et al. Association analyses identify 38 susceptibility loci for
inflammatory bowel disease and highlight shared genetic risk across populations. Nat. Genet. 47, 979–986 (2015).
5. van de Bunt, M., Cortes, A., Brown, M. A., Morris, A. P. & McCarthy, M. I. Evaluating the performance of fine-mapping strategies at common variant GWAS loci. PLoS Genet. 11, e1005535 (2015).
6. Maller, J. B. et al. Bayesian refinement of association signals for 14 loci in 3 common diseases. Nat. Genet. 44, 1294–1301 (2012).
7. Yang, J. et al. FTO genotype is associated with phenotypic variability of body mass index. Nature 490, 267–272 (2012).
8. Beecham, A. H. et al. Analysis of immune-related loci identifies 48 new susceptibility variants for multiple sclerosis. Nat. Genet. 45, 1353–1360 (2013). 9. Onengut-Gumuscu, S. et al. Fine mapping of type 1 diabetes susceptibility loci
and evidence for colocalization of causal variants with lymphoid gene enhancers. Nat. Genet. 47, 381–386 (2015).
10. The 1000 Genomes Project Consortium. An integrated map of genetic variation from 1,092 human genomes. Nature 491, 56–65 (2012). 11. The 1000 Genomes Project Consortium. A map of human genome variation
from population-scale sequencing. Nature 467, 1061–1073 (2010). 12. Jostins, L. Using Next-Generation Genomic Datasets in Disease Association.
PhD thesis, Univ. Cambridge (2012).
13. Howie, B. N., Donnelly, P. & Marchini, J. A flexible and accurate genotype imputation method for the next generation of genome-wide association studies. PLoS Genet. 5, e1000529 (2009).
14. Howie, B., Marchini, J. & Stephens, M. Genotype imputation with thousands of genomes. G3 1, 457–470 (2011).
15. Goyette, P. et al. High-density mapping of the MHC identifies a shared role for HLA-DRB1* 01:03 in inflammatory bowel diseases and heterozygous advantage in ulcerative colitis. Nat. Genet. 47, 172–179 (2015).
16. Rivas, M. A. et al. Deep resequencing of GWAS loci identifies independent rare variants associated with inflammatory bowel disease. Nat. Genet. 43, 1066–1073 (2011).
17. Yang, J. et al. Genome partitioning of genetic variation for complex traits using common SNPs. Nat. Genet. 43, 519–525 (2011).
18. Huang, H., Chanda, P., Alonso, A., Bader, J. S. & Arking, D. E. Gene-based tests of association. PLoS Genet. 7, e1002177 (2011).
19. Momozawa, Y. et al. Resequencing of positional candidates identifies low frequency IL23R coding variants protecting against inflammatory bowel disease. Nat. Genet. 43, 43–47 (2011).
20. Kheradpour, P. & Kellis, M. Systematic discovery and characterization of regulatory motifs in ENCODE TF binding experiments. Nucleic Acids Res. 42, 2976–2987 (2014).
21. Nechanitzky, R. et al. Transcription factor EBF1 is essential for the maintenance of B cell identity and prevention of alternative fates in committed cells.
Nat. Immunol. 14, 867–875 (2013).
22. Trynka, G. et al. Chromatin marks identify critical cell types for fine mapping complex trait variants. Nat. Genet. 45, 124–130 (2013).
23. Farh, K. K.-H. et al. Genetic and epigenetic fine mapping of causal autoimmune disease variants. Nature 518, 337–343 (2015).
24. Bernstein, B. E. et al. The NIH Roadmap Epigenomics Mapping Consortium.
Nat. Biotechnol. 28, 1045–1048 (2010).
25. Nica, A. C. et al. Candidate causal regulatory effects by integration of expression QTLs with complex trait genetic associations. PLoS Genet. 6, e1000895 (2010).
26. Lappalainen, T. et al. Transcriptome and genome sequencing uncovers functional variation in humans. Nature 501, 506–511 (2013).
27. Wallace, C. et al. Statistical colocalization of monocyte gene expression and genetic risk variants for type 1 diabetes. Hum. Mol. Genet. 21, 2815–2824 (2012).
28. Dubois, P. C. A. et al. Multiple common variants for celiac disease influencing immune gene expression. Nat. Genet. 42, 295–302 (2010).
29. Wright, F. A. et al. Heritability and genomics of gene expression in peripheral blood. Nat. Genet. 46, 430–437 (2014).
30. Westra, H.-J. et al. Systematic identification of trans eQTLs as putative drivers of known disease associations. Nat. Genet. 45, 1238–1243 (2013).
31. Fairfax, B. P. et al. Innate immune activity conditions the effect of regulatory variants upon monocyte gene expression. Science 343, 1246949 (2014). 32. Schizophrenia Working Group of the Psychiatric Genomics Consortium.
Biological insights from 108 schizophrenia-associated genetic loci. Nature 511, 421–427 (2014).
33. Franke, A. et al. Genome-wide meta-analysis increases to 71 the number of confirmed Crohn’s disease susceptibility loci. Nat. Genet. 42, 1118–1125 (2010). 34. Nejentsev, S., Walker, N., Riches, D., Egholm, M. & Todd, J. A. Rare variants of
IFIH1, a gene implicated in antiviral responses, protect against type 1 diabetes.
Science 324, 387–389 (2009).
35. Huang, J., Ellinghaus, D., Franke, A., Howie, B. & Li, Y. 1000 Genomes-based imputation identifies novel and refined associations for the Wellcome Trust Case Control Consortium phase 1 data. Eur. J. Hum. Genet. 20, 801–805 (2012). 36. Spain, S. L. & Barrett, J. C. Strategies for fine-mapping complex traits. Hum.
Mol. Genet. 24 (R1), R111–R119 (2015).
37. The 1000 Genomes Project Consortium. A global reference for human genetic variation. Nature 526, 68–74 (2015).
38. The UK10K Consortium. The UK10K project identifies rare variants in health and disease. Nature 526, 82–90 (2015).
39. Roadmap Epigenomics Consortium et al. Integrative analysis of 111 reference human epigenomes. Nature 518, 317–330 (2015).
Supplementary Information is available in the online version of the paper. Acknowledgements We thank M. Khan and B. Wong for their assistance in designing illustrations, and K. de Lange for comments on the Supplementary Methods. We received support from the following grants. M.J.D. and R.J.X.: P30DK43351, U01DK062432, R01DK64869, Helmsley grant 2015PG-IBD001 and Crohn’s & Colitis Foundation of America. G.T., C.A.A. and J.C.B: Wellcome Trust grant 098051. M.G.: Fonds de la Recherche Scientifique-FNRS for the FRFS-WELBIO under grant no. WELBIO-CR-2012A-06 (CAUSIBD), BELSPO-IUAP-P7/43-BeMGI, Fédération Wallonie-Bruxelles (ARC IBD@Ulg), and Région Wallonne (CIBLES, FEDER). H.H.: ASHG/Charles J. Epstein Trainee Award. J.L.: Wellcome Trust 098759/Z/12/Z. D.M.: Olle Engkvist Foundation and Swedish Research Council (grants 2010-2976 and 2013-3862). R.K.W.: VIDI grant (016.136.308) from the Netherlands Organization for Scientific Research. J.D.R.: Canada Research Chair, National Institute of Diabetes and Digestive and Kidney Diseases grants DK064869 and DK062432, CIHR GPG-102170 from the Canadian Institutes of Health Research, GPH-129341 from Genome Canada and Génome Québec, and Crohn’s Colitis Canada. J.H.C.: DK062429, DK062422, DK092235, DK106593, and the Sanford J. Grossman Charitable Trust. R.H.D.: Inflammatory Bowel Disease Genetic Research Chair at the University of Pittsburgh, U01DK062420 and R01CA141743. E.D.: Marie-Curie Fellowship. A.-S.G: Fonds de la Recherche Scientifique-FNRS (F.R.S.-FNRS) and Fonds Léon Fredericq fellowships. J.H.: Örebro University Hospital Research Foundation and the Swedish Research Council (grant number 521 2011 2764). C.G.M. and M.P.: National Institute for Health Research (NIHR) Biomedical Research Centre awards to Guy’s & St Thomas’ NHS Trust/King’s College London and to Addenbrooke’s Hospital/University of Cambridge School of Clinical Medicine. D.E.: German Federal Ministry of Education and Research (SysInflame grant 01ZX1306A), DFG Excellence Cluster number 306 ‘Inflammation at Interfaces’. A.F.: Professor of Foundation for Experimental Medicine (Zurich, Switzerland). D.P.B.M.: DK062413, AI067068, U54DE023789-01, 305479 from the European Union, and The Leona M. and Harry B. Helmsley Charitable Trust.
Additional acknowledgements for the original data are in the Supplementary Information.
Author Contributions Overall project supervision and management: M.J.D. J.C.B., M.G. Fine-mapping algorithms: H.H., M.F., L.J. TFBS analyses: H.H., K.F. Epigenetic analyses: M.U.M., G.T. eQTL dataset generation: E.L., E.T., J.D., E.D., M.E., R.M., M.M., Y.M., V.D., A.G. eQTL analyses: M.F., J.D., L.J., A.C. Variance component analysis: T.M., M.F. Contribution to overall statistical analyses: G.B. Primary drafting of the manuscript: M.J.D., J.C.B, M.G., H.H., L.J. Major contribution to drafting of the manuscript: M.F., M.U.M., J.H.C., D.P.B.M., J.D.R., C.G.M., R.H.D., R.K.W. The remaining authors contributed to the study conception, design, genotyping quality control, and/or writing of the manuscript. All authors saw, had the opportunity to comment on, and approved the final draft.
Author Information Reprints and permissions information is available at www.nature.com/reprints. The authors declare no competing financial interests. Readers are welcome to comment on the online version of the paper. Publisher’s note: Springer Nature remains neutral with regard to jurisdictional claims in published maps and institutional affiliations. Correspondence and requests for materials should be addressed to H.H. ([email protected]. harvard.edu), M.G. ([email protected]), M.J.D. ([email protected]. harvard.edu), or J.C.B. ([email protected]).
reviewer Information Nature thanks A. Morris, C. Polychronakos, L. Scott, and T. Vyse for their contribution to the peer review of this work.
MeTHOdS
The study protocols were approved by the institutional review board at each centre involved with recruitment. Informed consent and permission to share the data were obtained from all subjects, in compliance with the guidelines specified by the recruiting centre’s institutional review board.
No statistical methods were used to predetermine sample size. The experiments were not randomized. The investigators were not blinded to allocation during experiments and outcome assessment.
Genotyping and quality control. We genotyped 35,197 unaffected and 35,346
affected individuals (20,155 Crohn’s disease and 15,191 ulcerative colitis) using the ImmunoChip array. Genotypes were called using optiCall40 for 192,402
auto-somal variants before quality control. We removed variants with missing data rate > 2% across the whole dataset, or > 10% in any one batch, and variants that failed (false discovery rate (FDR) < 10−5 in either the whole dataset or at least
two batches) tests for the following: (1) Hardy–Weinberg equilibrium in controls; (2) differential missingness between cases and controls; (3) different allele frequency across different batches in controls, Crohn’s disease, or ulcerative colitis. We also removed non-coding variants that were present in the 1000 Genomes pilot stage but were not in the subsequent phase I integrated variant set (March 2012 release) and had not been in releases 2 or 3 of HapMap, as these mostly represented false positives from the 1000 Genomes pilot, which often genotype poorly. Where a variant failed in exactly one batch, we set all genotypes to missing for that batch (to be reimputed later) and included the site if it passed in the remainder of the batches. We removed individuals that had > 2% missing data, had significantly higher or lower (defined as FDR < 0.01) inbreeding coefficient (F), or were dupli-cated or related (PI_HAT ≥ 0.4, calculated from the linkage disequilibrium pruned dataset described below), by sequentially removing the individual with the largest number of related samples until no related samples remained. We projected all remaining samples onto principal component axes generated from HapMap 3, and classified their ancestry using a Gaussian mixture model fitted to the European (CEU + TSI), African (YRI + LWK + ASW + MKK), East Asian (CHB + JPT), and South Asian (GIH) HapMap samples (CEU, Utah residents with Northern and Western European ancestry from the CEPH collection; TSI, Toscani in Italia; YRI, Yoruba in Ibadan, Nigeria; LWK, Luhya in Webuye, Kenya; ASW, African ancestry in southwest USA; MKK, Maasai in Kinyawa, Kenya; CHB, Han Chinese in Beijing, China; JPT, Japanese in Tokyo, Japan; GIH, Gujarati Indians in Houston, Texas). We removed all samples that were classified as non-European, or that lay more than 8 standard deviations from the European cluster. After quality control, there were 67,852 European-derived samples with valid diagnoses (healthy control, Crohn’s disease, or ulcerative colitis), and 161,681 genotyped variants available for downstream analyses.
Linkage disequilibrium pruning and principal component analysis. From the
clean dataset we removed variants in long-range linkage disequilibrium41 or with
MAF < 0.05, and then pruned three times using the ‘–indep’ option in PLINK (with window size of 50, step size of 5 and VIF threshold of 1.25). Principal component axes were generated within controls using this linkage disequilibrium pruned dataset (18,123 variants). The axes were then projected to cases to generate the principal components for all samples. The analysis was performed using our in-house C code (https://github.com/hailianghuang/efficientPCA) and LAPACK package42
for efficiency.
Controlling for population structure, batch effects, and other confounders.
We used 2,853 ‘background SNPs’ present on the ImmunoChip but not known to be associated with immune disorders to calculate the genomic inflation factor
λGC. After including the first five principal components calculated above as
covar-iates, λGC = 1.29, 1.25, and 1.31 for Crohn’s disease, ulcerative colitis, and IBD
(adding additional principal components did not further reduce λGC, Extended
Data Table 3a). Because our genotype data were processed in 15 batches with variable ratios of cases to controls, we conducted two analyses to ensure pos-sible batch effects were adequately controlled. First, we split the samples into a ‘balanced’ cohort with studies having both cases and controls, and an ‘imbal-anced’ cohort with studies having exclusively cases or controls (Extended Data Table 1). As λGC under polygenic inheritance scales with the sample size43, we
randomly down-sampled the full dataset to match the sample size of the bal-anced and the imbalbal-anced cohorts, respectively. We tested for association in these subsets of our data (and included batch identifier as a covariate in the balanced cohort), and found the λGC from the balanced and imbalanced cohorts to be
within the 95% confidence interval of size-matched values from our full data, suggesting that batch effects were not systematically inflating our association statistics (Extended Data Table 3b). We also performed a heterogeneity test for the odds ratio of lead variants in each credible set using the balanced and imbalanced cohorts, and observed no significant heterogeneity after Bonferroni correction (Supplementary Table 3).
We next sought to disentangle the contributions of polygenic inheritance and uncorrected population structure in our observed λGC. Linkage disequilibrium
score regression44 is able to differentiate these two effects, but requires
genome-wide data, so was not possible in our ImmunoChip dataset. Instead, we compared
λGC and λ1000 values calculated using the same set of background SNPs from the
largest IBD meta-analysis with genome-wide data45. For both Crohn’s disease and
ulcerative colitis, the λ1000 values in our ImmunoChip study (1.012 and 1.012)
were equal to or less than those in the genome-wide study (1.016 and 1.012). Furthermore, linkage disequilibrium score regression on the genome-wide data showed that most inflation was caused by polygenic risk (linkage disequilibrium score intercept = 1.09 for both Crohn’s disease and ulcerative colitis, compared with λGC = 1.23 and 1.29). Together, these results show that our residual inflation
is consistent with polygenic signal and modest residual confounding. We tested what effect correcting for the linkage disequilibrium score intercept of 1.09 would have on posterior probabilities and credible sets, and found no major differences compared with uncorrected values. The full comparison of λ values is shown in Extended Data Table 3c.
Imputation. Imputation was performed separately in each ImmunoChip
auto-somal high-density region (185 total) from the 1000 Genomes phase I integrated haplotype reference panel. To prevent the edge effect, we extended each side of the high-density regions by 50 kbp. Two imputations were performed sequen-tially (Extended Data Fig. 2) using software and parameters as described below. The first imputation was performed immediately after the quality control, from which the major results were manually inspected (‘Manual cluster plot inspec-tion’ section in Methods). The second imputation was performed after removing variants that failed the manual cluster plot inspection. We used SHAPEIT46,47
(versions: first imputation, v2.r644; second imputation, v2.r769) to pre-phase the genotypes, followed by IMPUTE213,14 (versions: first, 2.2.2; second, 2.3.0) to
per-form the imputation. The reference panels were downloaded from the IMPUTE2 website (first, March 2012 release; second, December 2013 release). After the second imputation, there were 388,432 variants with good imputation quality (INFO > 0.4). These include 99.9% of variants with MAF ≥ 0.05, 99.3% of variants with 0.05 > MAF ≥ 0.01, and 63.0% of variants with MAF < 0.01 (Extended Data Fig. 6d–f), with similar success rates both for coding and for non-coding variants, making it unlikely that missing variants substantially affected our fine-mapping conclusions.
Manual cluster plot inspection. Variants that had posterior probability greater
than 50% or in credible sets mapped to ≤ 10 variants were manually inspected using Evoker version 2.2 (ref. 48). Each variant was inspected by three independent reviewers (ten reviewers participated) and scored as pass, fail, or maybe. Reviewers were blinded to the posterior probability of these variants. We removed variants that received one or more fails, or received fewer than two passes. Two hundred and twenty out of 276 inspected variants passed this inspection, and 53 out of 56 failed variants were restored by imputation. There was no difference in MAF between the failed and the passed variants (P = 0.66). A further cluster plot inspec-tion flagged two addiinspec-tional failed variants after removing the failed variants from the first inspection and re-doing the imputation and analysis. Dramatic clustering errors accounted for 27 out of 58 flagged variants, which were eliminated from final credible sets. The remaining 31 had only minor issues, and the imputed data for these remained in our final credible sets, with marginally smaller posteriors (mean of the difference 9.8%, P = 0.06, paired t-test).
Establishing a P value threshold. We used a multiple-testing-corrected P value
threshold for associations of 1.35 × 10⁻⁶, which was established by permutation.
We generated 200 permuted datasets by randomly shuffling phenotypes across samples and performed association analyses for each permutation across all variants in high-density regions that overlapped IBD-associated loci3. We stored
(1) all the point-wise P values (αS), as well as (2) the ‘best’ P values (αB) of each
of the 200 permuted datasets. We then computed the empirical, experiment-wide
P value (αM) (corrected for multiple testing) for each of the tests as its rank/200
with respect to the 200 αB. We then estimated the number of independent tests
performed in the studied regions, n, as the slope of the regression of log(1 − αM)
on log(1 − αS), knowing that αM = 1 − | (1 − αS)n, yielding a value of 37,056. The
P value threshold was determined as 0.05/n ≈ 1.35 × 10⁻⁶.
Detecting and fine-mapping association signals. We used three fine-mapping
methods (Supplementary Methods) to detect independent signals and create credible sets across 97 ImmunoChip autosomal high-density regions that contained at least one variant with P < 1.35 × 10⁻⁶. Our process for merging the results of the three
methods is described below and illustrated in Fig. 1a.
1. We merged signals from different methods if their credible sets overlapped. To ensure a conservative credible set, this new merged credible set included all variants from all merged signals (the union of constituent credible sets). We assigned each variant in the merged credible sets a posterior probability equal to the average of
the probabilities from the methods that reported this signal. To filter out technical artefacts, we required genotyped variants in small credible sets to pass manual cluster plot inspection (see above) and all imputed variants to have INFO > 0.4. For signals reported by only one or two methods that contained only imputed variants (that is, no directly genotyped variants), we additionally required at least one variant with INFO > 0.8 and MAF > 0.01.
2. We next assigned each signal to a provisional combination of lead variant and phenotype (Crohn’s disease, ulcerative colitis, or IBD) that maximized the marginal likelihood of equation (8) in Supplementary Methods.
3. At loci with more than one signal, we built a multivariate model with all signals reported by all three methods, and tested all possible combinations of adding signals reported by one or two methods, as long as they still had P < 1.35 × 10⁻⁶
when jointly fitted in the multi-signal model. We selected the combination with the highest joint marginal likelihood (equation (8) in Supplementary Methods).
Phenotype assignment of signals. The provisional phenotype assignment,
per-formed during the signal merging described above, was merely a point estimate and did not capture the uncertainty associated with the phenotypic assignment. We therefore recomputed the assignment of each signal as Crohn’s-disease-specific, ulcerative-colitis-Crohn’s-disease-specific, or shared using the Bayesian multinomial model from fine-mapping method 2, empirical covariance prior with Laplace approximation49, as it was designed to assess evidence of sharing in the presence
of potentially correlated effect sizes. For the lead variant for each credible set, we calculated the marginal likelihoods as in equation (13) from Supplementary Methods, restricting either βUC = 0 (for the Crohn’s-disease-only model) or βCD = 0
(for the ulcerative-colitis-only model), as well as using the unconstrained prior (for the associated-to-both model). We then calculated the log(Bayes factor) in favour of sharing; that is, the log of the ratio of marginal likelihoods between the associated-to-both model and the best of the single-phenotype associated models. These sharing log(Bayes factors) are given in Supplementary Table 1 (column ‘sharingBF’), and are a probabilistic assessment of phenotype assignment: for instance, the log(Bayes factor) of 97.4 for the primary signal at IL23R suggests a very high certainty that this signal is shared across both Crohn’s disease and ulcer-ative colitis, whereas the log(Bayes factor) of 0.4 for the primary signal at FUT2 is more ambiguous. In addition to providing the log(Bayes factor) itself, we also applied a log(Bayes factor) cut-off of 10 to select variants with strong evidence of being shared across phenotypes.
Final filters. These procedures generated some signals where all three
meth-ods largely agreed, and some where they differed. While the signals where the methods disagree are of interest for methods development, here we chose to focus on the most concordant signals, as they are most straightforward to inter-pret biologically. We therefore discarded all signals found by only one method (which completely removed one locus), and two loci where the ratio of marginal likelihoods (equation (8) in Supplementary Methods) for the best model and the second-best model was < 10 (Supplementary Notes). After these filters (Extended Data Fig. 7), we considered 139 signals from 94 regions (containing a total of 181,232 variants) to be confidently fine-mapped, and took them forward for subsequent analysis.
Estimating the variance explained by the fine-mapping. We used a mixed-model
framework to estimate the total risk variance attributable to the IBD risk loci, and to the signals identified in the fine-mapping. We used the GCTA software package50 to compute a gametic relationship matrix (G-matrix) using genotype
dosage information for the genotyped variants in the high-density regions (which we will call GHD). We then fitted a variety of variance component models by
restricted maximum likelihood analysis using an underlying liability threshold model implemented with the DMU package51. The first model was a standard
heritability mixed-model that included fixed effects for five principal components (to correct for stratification) and a random effect summarizing the contribution of all variants in the fine-mapping regions, such that the liabilities across all indi-viduals were distributed according to
β β λ λ
≈ + … + + −
L N PC( 1 1 5PC5 1 HD, G (1 1) ),I
where λ1 is thus the variance explained by all variants in fine-mapping regions,
which we estimated. We then fitted a model that included an additional random effect for the contribution of the lead variants that had been specifically identified (with G-matrix GSignals), such that the liability was distributed as
′ ′
β β λ λ λ λ
≈ + … + + + − .
L N PC( 1 1 5PC5, 1 HDG 2 SignalsG (1 1– ) )2I
The variance explained by the signals under consideration was then given by the reduction in the variance explained by all variants in the fine-mapping regions between the two models (λ1 − λ′1). We used this approach to estimate what fraction
of this variance was accounted for by (1) the single strongest signals in each region
(as would be typically done before fine-mapping), or (2) all signals identified in fine-mapping. We used Cox and Snell’s method52 to estimate the variance
explained across individual signals (Extended Data Fig. 3b) for computational efficiency.
Overlap between transcription-factor binding motifs and causal variants. For
each motif in the ENCODE transcription factor ChIP-seq data (http://compbio. mit.edu/encode-motifs/, accessed November 2014)20, we calculated the overall
information content as the sum of information content for each position53, and
only considered motifs with overall information content ≥ 14 bits (equivalent to seven perfectly conserved positions). For every variant in a high-density region, we determined whether it created or disrupted a motif at a high-information site (information content ≥ 1.8).
Overlap between epigenetic signatures and causal variants. For each
combi-nation of 120 tissues and 3 histone marks (H3K4me1, H3K4me3, and H3K27ac) from the Roadmap Epigenome Project, we calculated an overlap score, equal to the sum of fine-mapping posterior probabilities for all variants in peaks of that histone mark in that tissue. We generated a null distribution of this score for each tissue/ mark by shifting chromatin marks randomly (between 0 bp and 44.53 megabase pairs, the length of all high-density regions) and circularly (peaks at the end of the region shifted to the beginning of the region) over the high-density regions while keeping the same inter-peak distances. To summarize these correlated results across many cell and tissue types, we defined a set of ‘core’ H3K4me1 immune and H3K27ac gut peaks as sets of overlapping peaks in cells that showed the strongest enrichment. Intersects were made using bedtools version 2.24.0 default settings54. We selected six immune cell types for H3K4me1 and three gut cell types
for H3K27ac (Supplementary Table 2). We also chose controls (Supplementary Table 2) from non-immune and non-gut cell types with similar density of peaks in the fine-mapped regions compared with immune/gut cell types to confirm the tissue-specificity of the overlap. We used the phenotype assignments (described above) in dissecting the enrichment for the Crohn’s disease and ulcerative colitis signals. Sixty-five Crohn’s disease and 21 ulcerative colitis signals that were mapped to ≤ 50 variants were used in this analysis.
Published eQTL summary statistics. We used eQTL summary statistics from
three published studies. (1) Peripheral blood eQTLs from ref. 29 of 2,752 twins, reporting loci with MAF > 0.5%. Imputation was performed using the 1000 Genomes reference panel11. (2) Peripheral blood eQTLs from ref. 30 of 8,086
individuals, including variants with MAF > 5%. Imputation was performed using the HapMap 2 CEU population reference panel55. (3) CD14+ monocyte eQTLs
from Supplementary Table 2 in ref. 31, comprising 432 European individuals, measured in a naive state and after stimulation with interferon-γ or lipopolysac-charide (for 2 or 24 h), reporting loci with MAF > 4% and FDR < 0.05. Imputation was performed using the 1000 Genomes reference panel10.
Processing and quality control of new eQTL ULg dataset. A detailed
descrip-tion of the ULg dataset is in preparadescrip-tion (Y.M. et al., in preparadescrip-tion). Briefly, we collected venous blood and intestinal biopsies at three locations (ileum, transverse colon, and rectum) from 350 healthy individuals of European descent, average age 54 (range 17–87), 56% female. SNPs were genotyped on Illumina Human OmniExpress version 1.0 arrays interrogating 730,525 variants, and SNPs and individuals were subjected to standard quality control procedures using call rate, Hardy–Weinberg equilibrium, MAF ≥ 0.05, and consistency between declared and genotype-based sex as criteria. We further imputed genotypes at ∼ 7 million variants on the entire cohort using the Impute2 software package13 and the 1,000
Genomes Project as reference population (phase 3 integrated variant set, released 12 October 2014)11,14. From the blood, we purified CD4+, CD8+, CD19+, CD14+,
and CD15+ cells by positive selection, and platelets (CD45−) by negative selection.
RNA from all leucocyte samples and intestinal biopsies was hybridized on Illumina Human HT-12 arrays version 4. After standard quality control, raw fluorescent intensities were variance stabilized56 and quantile normalized57 using the lumi
R package58, and were corrected for sex, age, smoking status, number of probes
with expression level significantly above background as fixed effects and array number (sentrix id) as the random effect. For each probe with measurable expres-sion (detection P value < 0.05 in > 25% of samples), we tested for cis-eQTLs at all variants within a 500 kbp window. The nominal P value of the best SNP within a
cis-window was Sidak-corrected for the window-specific number of independent
tests. The number of independent tests in each window was estimated exactly in the same manner as for the number of independent tests for fine-mapping methods (‘Establishing a P value threshold’ section in Methods). We estimated false discovery rates (q values) from the resulting P values across all probes using the qvalue R package59. Four hundred and eighty cis-eQTL with FDR ≤ 0.10 for
which the lead SNPs (that is, the SNP yielding the best P value for the cis-eQTL) mapped within the 97 high-density regions (94 fine-mapped plus 3 unresolved) were retained for further analyses.