HAL Id: hal-02989604
https://hal.archives-ouvertes.fr/hal-02989604
Submitted on 24 Nov 2020HAL is a multi-disciplinary open access
archive for the deposit and dissemination of sci-entific research documents, whether they are pub-lished or not. The documents may come from teaching and research institutions in France or abroad, or from public or private research centers.
L’archive ouverte pluridisciplinaire HAL, est destinée au dépôt et à la diffusion de documents scientifiques de niveau recherche, publiés ou non, émanant des établissements d’enseignement et de recherche français ou étrangers, des laboratoires publics ou privés.
Silicate Glasses
Charles Le Losq, Maria Rita Cicconi, G. Neville Greaves, Daniel Neuville
To cite this version:
Charles Le Losq, Maria Rita Cicconi, G. Neville Greaves, Daniel Neuville. Silicate Glasses. Springer Handbook of Glass„ pp.441-503, 2019, �10.1007/978-3-319-93728-1_13�. �hal-02989604�
Springer Hanbook of Glass
1. Silicate glasses
Authors:
Dr. C. Le Losq1,*, Dr. M. R. Cicconi2, Prof. G. N. Greaves3,4, Dr. D. R. Neuville5
1 Research School of Earth Sciences, The Australian National University, Building 142, Mills Road, Acton ACT 2601,
Australia. *Corresponding author, [email protected]
2
Department Werkstoffwissenschaften, Lehrstuhl für Glas und Keramik, Universität Erlangen-Nürnberg, Martensstrasse 5, D-91058 Erlangen, Germany
3 Department of Mathematics and Physics, Aberystwyth University, Physical Sciences Building, Aberystwyth, Ceredigion,
SY23 3BZ, United Kingdom.
4 University of Cambridge, Department of Materials Science & Metallurgy, Cambridge CB3 0FS, United Kingdom. 5 Laboratoire Géomatériaux, CNRS-IPGP UMR 7154, PRES Paris-Sorbonne Cité, 1 rue Jussieu, 75005 Paris, France.
Summary:
Silicate glasses are important cultural, societal and geological materials. Geologic glasses testify for the igneous activity of the Earth and, for instance, represented important source of tools and ornamental objects during the Paleolithic. Nowadays, silicate glasses are used to build technical materials, such as smartphone screens or glass matrix for stabilizing hazardous radioactive wastes. Therefore, silicate glasses are central to the history of the Earth and of the humanity. The compositional landscape of natural and industrial silicate glasses is vast, with various elements that all influence differently the glass properties and structure. The SiO4 tetrahedral framework, backbone of silicate glasses, is variously
influenced by the introduction of network modifier metal cations or network former aluminium cations. Industrial and geologic silicate glasses further contain multivalent elements (e.g., Fe2+/3+), rare-earth elements, and volatile elements (H, C, S, Cl, F, I) that play different roles on the glass structure and properties. This chapter proposes to review the link between the structure, the properties and the chemical composition of silicate glasses.
1.1 Silicate glasses: Historical and industrial importance
The origin of the first silicate glass is a vast question. The first glass tools actually were manufactured by breakage and date approximately of 10000 BCE, as shown by obsidian arrow heads of this age found in Turkey for example. Manufacture of silicate glasses dates back to the earliest antiquity; it follows the control of fire, and is synchronous with the Bronze Age which itself varies geographically. The first objects made by melting date of ~6000 BCE. Hazard was probably the first factor in this melting manufacturing. Henrivaux [1] proposed that the appearance of glass should be contemporary with the manufacture of bricks cooked by fire and of certain ceramics. Indeed, a plausible hypothesis is that brick and ceramic manufacturers were the first glass manufacturers because various materials subjected to the action of an intense fire may present the first symptoms of vitrification in the form of a veneer or surface glaze. This hypothesis may explain the Mesopotamian glazes observed on several ceramics and located at Suse between 7000 and 5000 BCE. However, this hypothesis contradicts with the story reported by Pline the Elder (23-79 BC). Indeed, in his Natural History [2], Pline reported that it would be Phoenician merchants who, cooking their food on the banks of the river Belus in pots supported by blocks of Natron, would have seen an unknown substance flow:
“The story is, that a ship, laden with nitre, being moored upon this spot, the merchants, while preparing their repast upon the sea-shore, finding no stones at hand for supporting their cauldrons, employed for the purpose some lumps of nitre which they had taken from the vessel. Upon its being subjected to the action of the fire, in combination with the sand of the sea-shore, they beheld transparent streams flowing forth of a liquid hitherto unknown: this, it is said, was the origin of glass”
This observation is unlikely when one knows that temperatures close to ~ 1000°C are necessary to observe the flow of silicate melts, conditions difficult to achieve using campfires. Pliny’s account thus probably is a legend, and current historical knowledges suggest that the formation of glass as a byproduct of mettalurgic and ceramic activities is more plausible [e.g., see the review of 3]].
Regardless of the origin of its discovery, glass was considered as precious during the antiquity. This is shown, for instance, by the Hebrew term that designates glass, “תיִכוִֹכֹ” (pronounced “zkhourhit”), which comes from the Hebrew word “ךְכז” that means pure. Glass thus remained an expensive material during antiquity. As such, it was reserved for noble objects as jewelry and amulets (Fig. 1), competing with precious metals such as gold or silver for such uses.
Figure 1: Ring and earring reproduction. Image reproduced from Henrivaux, 1897, “Le Verre et le cristal” Vicq-Dunaud Editors, Paris [1].
From 5000 to 3000 BC, objects partly made of glass are characterized by a faience coating placed on the surface of a ceramic material. Then, as the furnaces of the age of bronze and copper appeared, the work of the glass became easier, allowing the manufacture of colored glass bead for instance. Core-molding and cast glass methods, using molds for shaping glass objects, were subsequently developed in the ~ 1500-500 BCE period in Mesopotamia and Egypt. Some sources attribute the invention of glass-blowing to Syrian glassmakers around 300 BCE [e.g., 4], but this disagrees with the representation of glass-blowing in Egyptian tombs [5], as for instance in a tomb from the fifth dynasty at Sakkarah or the painting at Beni-Hassan (Fig. 2) that dates from the reign of Usertessen I. (2758-2714 BCE).
Figure 2: Representation of Egyptian glassworkers blowing glasses on brazier at Beni-Hassan. Reproduced from Henrivaux (1897) “Le Verre et le cristal” Vicq-Dunaud Editors, Paris [1].
Historical glass compositions are based on the use of silica, lime and soda. The compositions of historical glasses remain in a tight chemical domain. They are still close to those of present glasses (Fig. 3), illustrating that the optimization of glassmaking processes was achieved early in the history of human glass manufacture. An interesting fact is that early glass makers already aimed at controlling the color of translucent or slightly opaque glasses through the addition of metals such as copper (red and blue-red), iron (black, brown and green), antimony (yellow), cobalt (blue) or tin (white). Such coloring substances were already identified and known before the age of glass manufacturing, as several of them were used as pigments [6]. Early glass manufacturers probably had access to raw materials presenting variable quality. Production was therefore subject to many hazards, against which they could only contrast empirical knowledge.
Figure 3: Examples of chemical composition of various geologic (lunar glass, dunite, peridotite, tephrite, basalt, phonolite, andesite, trachyte, rhyolite, tektite, obsidian), industrial (Optical fiber, Window glass, Glass E, Nuclear Glass, Refiom, Pyrex 1912, Actual window glass) and historic (Roman glass Embiez 200y, Flint, Egyptian, Babylonians, Tour, Chartres, Rouen, Germanique, Boheme) glasses [7–10].
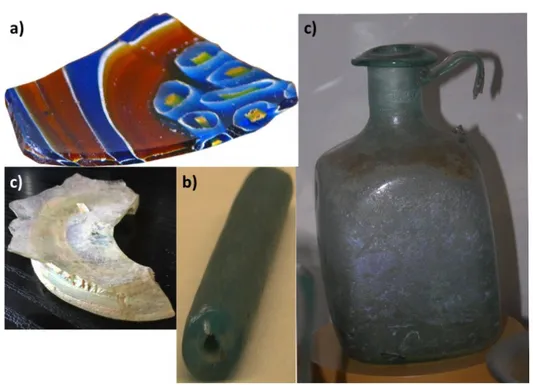
Around the 15th century BCE, improvements of the furnaces allowed higher working temperatures. As a result, fusion quality improved, leading to a technological transformation as the first translucent glasses were produced. Glass objects presenting a large variety of shape appeared, such as bottles and containers used to preserve ointments, perfumes, food or beverages, for instance. For instance, to form small containers, core-molding technics were used: a rather viscous silicate melt was spread on a core, made for example of a mixture of clay and manure; the core was then removed from the inside of the new piece. Other shaping methods were developed, and, from that time, glasses were decorated. In addition, technological glasses appeared, as for instance millefiori glasses (Fig. 4a) composed of many glass
0 20 40 60 80 100 Refiom Nuclear Glass Flint 1660y Rouen 1500y Tour 1400y Boheme 1600y Glass "E" 1930y Chartres 1200y Germanique 1500y Egyptian 1600y BC Babylonianss 140y BC Actual window glass Window Glass
Roman glass Embiez 200y Pyrex 1912y Optical fiber Dunite Lunar glass Peridotite Tephrite Basalte Phonolite Andesite Trachyte Obsidian glass Tektite glass Rhyolite SiO2 Al2O3 FeO MgO CaO Na2O K2O B2O3 Fe2O3 PbO others TiO2
objects were also formed using silicate melts rich in lead oxide and, hence, presenting low viscosity at working temperature. Towards the 4th century BCE, this new process improved greatly potteries, making them waterproof. From its Mesopotamian-Egyptian origin, the art of glass spread to neighboring countries. Pearls made at the end of the second millennium were found from Italy to Central Asia and China (Fig. 4b). Glass containers were found in Greece, Italy and China, respectively dating from the 13th, 8th and 5th centuries BCE. The availability and quality of the raw materials may have determined the abundance and interest in producing glass at such time. Indeed, glass transparency requires using raw materials with high purity during the glass-forming process. In particular, the starting materials should be very poor in iron oxide, one of the main glass colorant that is abundant on Earth surface. As such pure raw materials were easily found in Palestina and Egypt, for instance, this may explain the abundance of glasses made in these areas.
Figure 4: a) millefiori glasses, b) pearls, c) fragment of Roman glass and d) bottle from the Roman empire. Pictures Daniel R. Neuville.
The use of glass blowing during the Roman empire (Fig. 2) gave birth to a veritable industrial revolution. This process allowed fast, easy and thus cheap shaping of the glass. The size and shape of the pieces were also less limited than with previous methods. Whether intended for utilitarian or decorative
purposes, glass was able to find its place in all homes under the Roman empire. Even the deceased benefited of such technological evolution as their ashes were preserved in glass urns. Glasses dating from the Roman empire cover a small chemical composition domain. This suggests a form of globalization of the glass market at that time, with the production of glass concentrated in various factories located along the syro-palestinian costline [11]. This concentration probably resulted from the abundance of local deposits of pure sand and natron, giving this region a great competitive advantage. From there, glass was exported in the form either of finished products or of glass ingots, which could be re-melted in small furnaces at their destination to shape the final objects. For instance, the Ouest-Embiez ship wreck found in the Mediterranean Sea testifies for the occurrence of this trade [11].
The decline of the Roman Empire followed by the Arab conquests probably led glass trading routes to be cut off [12]. As a result, starting at the beginning of the Middle Ages (5th-15th century BCE), glasses had to be produced locally in Western Europe, with the available resources on the spot. The local cullet was used together with ashes to help melting local sands in order to produce glass. Using ashes helped compensating the absence of natron. Figure 5 represents the composition of ashes obtained from different plant and tree species. In Europe, ash from beech, oak and fern were mostly used in glass making processes. Such ashes are rich in potassium (Fig. 5), such that potash-lime glasses were produced in northern Europe. Unfortunately, potassium is not an element ensuring the stability of the glass in regards of alteration, explaining why potash-lime glasses from the early Middle Ages are not well preserved. Soda-lime glasses were also produced in regions were the local availability of saltwort was good (Fig. 5). This induced a typical geographic repartition of soda-lime and potash-lime compositions in Western and North-Eastern Europe at this time. This changed during the 11th century, as saltwort becomes to be imported from Spain for producing glass.
In parallel to the events in Europe, the development of glass in the East took a totally different path after the fall of the Roman empire. In the Byzantine empire, glassmaking processes used during the Roman period survived, such that the glass production that characterized the Roman glasses was conserved. The rise of the Muslim Arabs see the development of new glasses. The Islamic glassmakers used their knowledge of the Roman and Byzantine glassmaking technics and their own experience to produce high quality glasses. In particular, this lead to the introduction of the Islamic soda-lime glass, introduced between the 8th and 10th century CE. After the first crusades in the 11th century, glassmaking centers progressively shifted from the Islamic glassmakers to the Venice (Italy) center.
Figure 5: Chemical composition of ashes generated by burning different plant and trees. Data from Vernioles [13].
Indeed, the glassmaking knowledges acquired during the prosperous periods of the Roman empire never really died, and new contacts with the Byzantine empire following the first crusades allowed the transmission of new knowledges from the Islamic to the Venetian glassmakers. In addition, starting from the 11th century, Venice was becoming one of the most important center of trade, commerce and arts in the Europe and Mediterranean regions. As a result of the combination of those factors, the Italian glassmaking industry started to flourish again from around 1200 CE. In 1291, the glassmaking factories moved to the Island of Murano, to keep the Venice city safe from fires. This further helped keeping the secrets of the Venetian glassmaking processes safe. By the 15th century, Murano became one of the most important glassmaker in Europe. Venetian glassmakers continued to improve the quality of the glasses they produced, this leading to the production of the cristallo for instance, a transparent, shiny glass prepared from soda ash and quartz pebbles from Ticino (Italy). Using this glass composition that is characterized by a long working time, the Murano glassmakers manufactured thin and relatively light glass windows and mirrors that were exported all other Europe.
While the Venetian glasses were of high quality, they also were expansive. This actually pushed the birth of a French glassmaking company that is nowadays one of the largest glass and material producer in the world. Indeed, when the French king Louis XIV decided to build the Versailles castle, the price asked by the Murano glassmakers for the required large quantities of glasses was particularly depressing. This pushed Louis XIV to grant a royal privilege in 1665 to a new glass factory, which finally settled in 1693 in the village of Saint-Gobain. In 1695, it became the French Royal Glass Factory, famous for the production of flat glass through cooling and flattening the melt directly on a wood table of several meters. This process was notably depicted in the painting “The visit of the duchess of Berry at Saint-Gobain in 1822”.
Figure 6: Formation of flat glass using the cylindrical sleeve technique: a) b) and c) a cylinder of glass is formed by blowing, d) each end is removed and one of the cylinder side is cut, e) the cylinder is then softened under fire to obtain a flat window, and f) final product can be colored or uncolored. Pictures Daniel R. Neuville, from the Saint-Just Factory – Saint-Gobain Compagny.
The process cited thereabove was a late evolution of two technics used to produce flat glass, in high demand for the construction of windows and mirrors for religious and royal edifices in Western Europe since the Middle Ages. Indeed, the first productions of flat glass were performed using either the crown or the cylindrical sleeve processes. The crown process consisted in obtaining a cylinder of flat glass from a vase, initially formed by blowing. This cylinder of flat glass can then be cut in any wanted shapes. The
Glasses formed through those processes were expansive, such that their use was reserved to religious or important edifices until the end of the 17th century.
Figure 7: Representation of the three different furnaces needed to made glass and proposed by Agricola.
This representation is extracted from “Dans l’art de la verrerie” from Neri, Merret and Kunckel (1752) [6].
While the brazier represented in Figure 2 is one of the first representations of a glass furnace, the one developed since the Middle Aged were highly sophisticated. An example of a furnace used at this time is given by Agricola in De Re Metallica in 1556 and later reported by Neri et al. [6]. Figure 7 shows the representation displayed in Neri et al. [6], in which we distinguish three different furnaces: -i) the first called calcaria was used to prepare oxide and carbonate powders from raw materials (shells, chalk, marls,
wood, sea salt, vegetable or animal ash…); - ii) the second furnace was typically a pot furnace used to melt the materials generated with the first furnace, in order to obtain from 100 to 300 kg of glass (a bath furnace could also be used for generating large glass volume of several cubic meters); -iii) a third furnace was used for annealing the glass pieces generated by blowing the silicate melt from the second furnace.
At the end of the Middle Ages and the beginning of the Renaissance, academic societies and the renaissance savants started to make further important progress in knowledge. Such time saw the development of new glasses, and glassmaking technics. For example, the Prince Rupert started to look at some spectacular and curious properties of glass, presented to the Royal Society of London in 1661. Indeed, dropping melts at high temperature in water, Prince Rupert noticed the formation of glass drops very resistant to violent shocks, up to a point after which they exploded suddenly and turned into fine powder. Spectacularly, these first tempered glasses, well known as the Prince Rupert’s drops, illustrated the role of internal stresses that accumulate in the absence of annealing (Fig. 8). George Ravenscroft (1632-1683) invented the crystal glass through the addition of an important quantity of lead oxide in the composition. From this invention, patented in 1673 by Ravenscroft, lead-based glass spread among Europe, representing an important turnover as it allowed improving the appearance of glass as well as lowering the melting and working temperatures. In parallel, the naturalist and physicist René-Antoine Ferchault de Réaumur (1683-1757) observed the partial crystallization of a glass and created the first glass-ceramic in 1727. While such aspect was considered to be a defect at this time, it is a particular focus in glass and materials sciences nowadays because glass-ceramic materials open new doors to the manufactures of new strategic materials [e.g., see 14].
Figure 8: Picture of two glass drops observed under polarized and analyzed light. The sample at the left is unrelaxed, while that at the right was annealed, removing any intern stress. Picture courtesy of Prof. D. de Ligny.
The 19th and 20th century saw a rapid evolution of the glass market, as glass was needed as a technological
material for various applications. For instance, in 1893, the Duran boro-silicate glass, was developed by Otto Schott, a German glass maker. This glass presented a low thermal expansion, such that the Corning Glass Works company used it to form the first light bulb for Thomas Edison. At the turn of the 20th century, other technical problems appeared with the development of railroad, automobiles and other mechanical transportation means. For instance, the glass globes of signal lanterns on United States of America railroads were sensible to extreme temperature changes (e.g., heavy rain on hot glass), leading them to shatter. This problem was solved by the development of the Nonex and the famous Pyrex® glasses, respectively in 1908 and 1915 by the Corning Glass Works company. Those boro-silicate glasses present a very low thermal expansion, making them particularly suitable for uses in environments with extreme temperature changes. The E glass, a calcium boro-silicate, was subsequently developed for electrical insulators has thus been found to have excellent mechanical properties. From the middle of the 20th century, it was this glass that was produced in the form of fibres to reinforce composite materials. In parallel of the discovery of such new glass compositions, the fast spreading of mechanical glassmaking processes allowed lowering the price of glass, making it suitable for its use in many different areas such as food storage, building or glass lenses for instance. Following World War II, many new glass families were made and developed, and the invention of the float glass process by Sir Alastair Pilkington and Kenneth Bickerstaff between 1953 and 1957 further revolutionized the glass production processes. Nowadays, silicate glasses still represent the largest quantity of human-made glasses. They are used in many aspects of everyday life, e.g. fiber optics, cellphone and computer screens, car windshields. However, the importance of silicate glasses is becoming smaller, thanks to the development of new and exciting glasses, such as, for example, chalcogenide, metallic or fluoride glasses. Such new glasses have a high technological importance, with critical applications as for instance for infrared cameras, photonics or data storage.
From the previous discussion, silicate glasses used in many technical and technological applications through historical times as well as natural geologic glasses present a wide range of chemical composition (Fig. 3). Such large variations in chemical composition are associated with large differences in term of glass properties, e.g., glass transition temperature Tg, density, hardness, chemical durability. For example, the Tg and relative density of simple binary silicate glasses Mn+2/nO-SiO2 are reported as a function of the
molar percentage of Mn+2/nO in them in Fig. 9 (M=Na, K, Mg, Ca); along the Mn+2/nO-SiO2 binary
systems, Tg vary non-linearly of hundreds of degrees. In addition, glasses composed of a given amount of SiO2 but different metal cations M present different Tg (Fig. 9a). Density changes are closer to a linear
trend that vary quite strongly with composition (Fig. 9b). Such changes in glass properties translate changes in the glass disordered molecular structure upon variations of the glass chemical composition. Indeed, while glasses do not present long-range order arrangement as crystals do, they still present specific molecular arrangements at short and intermediate range order. For instance, the environment at short range order of Si4+ cations is well defined as being a SiO4 tetrahedral units in silicate glasses. At a
scale of a few SiO4 tetrahedral units, arrangements of such tetrahedral species in rings and cages is also
reported, as it will be presented in the following sections. However, one should remember that even such molecular arrangements are disordered in glasses: for instance, they can present a broad range of bond angle and bond lengths, as shown by the board distribution of the Si-O-Si bond angle in the silica SiO2
Figure 9: A) Glass transition temperature Tg and B) relative density of binary silicate glasses along the
Mn+2/nO-SiO2 join. Tg of Na2O-SiO2 and K2O-SiO2 glasses compiled by [20]; Tg of Li2O-SiO2 glasses:
[21]; Tg of MgO-SiO2 and of CaO-SiO2 glasses: [22, 23]. Density data are from [21, 23–25].
In the present chapter, the structure and properties of silicate glasses will be reviewed. We define silicate glasses as glasses containing dominantly SiO2 as the glass network former oxide component that allows
their vitrification. Glasses built upon the presence of other network formers in their structure will be discuss in the following chapters (see chapters XXXXX). Silicate glasses usually contain various elements such as, for example, aluminum, iron, alkali and alkaline-earth metal cations. In a first time, the structure and properties of the silica glass will be briefly reviewed in section 1.2. Then, we will add new levels of complexity by looking at the structure and properties of Al-free and Al-bearing silicate glasses in sections 1.3 and 1.4. Section 1.5 will review multivalent and rare-earth elements in silicate glasses, and redox effects will be discussed, while sec. 1.6 gives a brief overview of volatiles elements dissolved glasses.
1.2 Silica glass
1.2.1 Structural concepts
Silicate glasses inherit their names from the basic oxide component that allow their formation: silica oxide or SiO2. Interestingly, the possibility to quench the simple SiO2 melt into glass indicates that Si4+
is a network former cation, similar to other cations such as Ge3+ or B3+ for instance (see chapters XXX for further information). Network former elements in oxide glasses participate in building an interconnected molecular network, forming the backbone of glassy materials. Regarding the pure silica glass, it is composed of Si4+ cations and O2- anions arranged in SiO4 tetrahedral units with Si4+ at the
center and O2- at the summit. Those SiO4 units are interconnected by their apical bridging oxygen atoms,
forming a tridimensional tetrahedral network.
Because of its simple chemistry, one may think that the structure of the silica glass is simple. However, it actually exhibits such a level of complexity that there is no definitive consensus about the three-dimensional arrangements of SiO4 tetrahedral units at medium-range order. An early description of the
silica glass structure was provided by Zachariasen [26], who proposed the Random Network (RN) model to describe the structure of oxide AX2 glasses (with A the network former cations and X the anions).
Following this model, Si and O structural sites are energetically equivalent, and the Si and O atoms randomly distribute between those sites following 4 rules that govern the formation of AX2 glasses:
1) the system contains enough X anions to ensure the formation of triangle or tetrahedra of X anions around the central network former A cations;
2) those triangle/tetrahedra share the apical X anions at their summit; 3) a given X anion only link 2 A cations;
4) the triangle/tetrahedra only share their summit, and not their faces or edges.
In the silica glass, this model predicts the formation of a three-dimensional disordered network composed of rings and cages of SiO4 interconnected tetrahedral (Fig. 10). First X-ray diffraction data of the silica
glass in 1934 corroborated such description [27], and the latest observations of thin 2-dimensional films of silica deposited on graphene further support such view [28] (Fig. 10).
Figure 10: Image linking the transition between the theoretical 2D view the structure of the silica glass as drawn by Zachariasen [26] in 1932 (on the left) and the experimental observation by Huang et al. [28] in 2012 of a thin 2D film of amorphous silica deposited on graphene (on the right), made with using annular dark-field scanning transmission electron microscopy (ADF-STEM). Reprinted with permission from Huang, P.Y., Kurasch, S., Srivastava, A., Skakalova, V., Kotakoski, J., Krasheninnikov, A.V., Hovden, R., Mao, Q., Meyer, J.C., Smet, J., Muller, D.A., Kaiser, U., 2012. Direct Imaging of a Two-Dimensional Silica Glass on Graphene. Nano Letters 12, pages 1081–1086, doi:10.1021/nl204423x. Copyright 2012 American Chemical Society.
Pre-1990 analysis of X-Ray diffraction data [e.g., 29] and Raman spectra [e.g., 30] of the SiO2 glass as
well as early structural calculations [e.g., 31] supported the idea that the structure of the SiO2 glass at
medium range order was composed of tetrahedral rings, but no consensus existed about the number of tetrahedral units in the rings. In the Raman spectrum of SiO2, the asymmetric R band centred near ~460
cm-1, which extends from ~ 200 to ~ 650 cm-1, is actually assigned to Si-O-Si and O-Si-O bending vibrations in such SiO4 rings (Fig. 11).
Figure 11: Raman spectrum of the Lybian glass, a glass found in the Lybian desert that probably results from a meteoritic impact. This glass present a composition of 99% silica and 1% impurities (Al2O3,
alkalis…). The Raman spectrum of this glass is very similar to that of the pure SiO2 glass. It displays:
the Boson peak at ~65 cm-1, that can be assignment to collective transverse acoustic vibrational modes [32] promoted in silicate glasses by cooperative inter-tetrahedral librations [33–35]; the R band, an asymmetric band with an intensity maxima near 440 cm-1 that may be assigned to O movements along
the Si-O-Si intertetrahedral bonds of tetrahedral rings with 5, 6 or more tetrahedral [36–48]; the D1
and D2 sharp peaks, assigned to breathing vibrations of four and three membered rings, respectively [39, 41–43, 46, 48–51]; an asymmetric band near 800 cm-1, assigned to asymmetric vibrations of SiO4 units
with both O and Si movements [43, 52–54]; a peak near 1065 cm-1, assigned to Si-O asymmetric stretching vibrations in SiO4 units [25, 55–57]; and a broad band between 1100 and 1250 cm-1 that is
assigned to Si-O symmetric stretching vibrations in SiO4 units [36–38, 43]. Boson peak Si-O stretching vibrations in SiO4 tetrahedra symetric stretching in Q4,II and Q4,I
asymetric stretching
At higher frequency, peaks at ~1060 cm-1 and ~1195 cm-1 are observed, and are assigned to Si-BO asymmetric and symmetric stretching modes of SiO4 units, respectively [30, 55, 56, 58, 59]. Peak-fitting
the ~1180 cm-1 band with Gaussian components, Seifert et al. [30] noticed that two peaks were necessary because this ~1180 cm-1 band is asymmetric (Insert in Fig. 11). They interpreted this splitting of the Si-O symmetric stretching in Q4 units in two components as indicating an asymmetry of the Q4 environments in the silica glass. This could be related to a slight asymmetry of the T-O-T inter-tetrahedral angle in SiO2 glass (Fig. 12), as suggested by results from molecular dynamic simulations [18, 60–62], 29Si NMR
spectroscopy [19] and X-Ray absorption spectroscopy [15, 29, 63]. Seifert et al. [30] assigned this asymmetry to different puckering extents of 6-membered rings in the structure of the silica glass that yield T-O-T angle differences of ~5-10°. In line with such idea, Henderson et al. [29] discussed the X-Ray Diffraction (XRD) data for SiO2 as suggesting the coexistence of cristobalite-like and trydimite-like
6-membered rings in silica. Such structural models fall in the category of the crystallite network model of the SiO2 glass, discussed by Wright [64].
Figure 12: Distribution of the mean Si-O-Si bond angle in silica derived from 29Si NMR spectroscopy, using either a linear relationship between the 29Si chemical shifts and Si-O-Si bond angles measured in SiO2 polymorphs and zeolites (plain curve), or a correlation determined by density functional theory by
Mauri et al [65] (dotted curve). Reprinted from Malfait [19], Copyright (2008), with permission from Elsevier.
The idea of different 6-membered rings coexisting in the structure of the silica glass is still presently plausible, as no consensus has been reached on the structure of the silica glass. For instance, Huang et al. [66] recently followed such idea, showing with the help of Molecular Dynamic simulations that the mixing in different quantities of two types of 6-membered rings, presenting shapes close to those found in a-cristobalite and b-cristobalite, may account for variations of the SiO2 bulk modulus and density with
pressure. However, most Monte Carlo and Molecular Dynamic simulations [e.g., 18, 47, 51, 60, 67] indicate that, at medium range order, the structure of the silica glass is composed of a distribution of rings with different numbers of SiO4 units, with 5-, 6- and 7-membered rings tending to be dominant (Table
1). Therefore, as rings with different number of tetrahedral units present different T-O-T angles [42, 60],
Si-O stretching frequency in SiO4 units should vary as a function of the ring statistic in the SiO2 glass.
For instance, signals assigned to Si-O stretching in SiO4 units in the main 6- and 7-membered rings will
give signals at different frequency because they present different Si-O-Si bond angles and Si-O bond lengths [53, 54, 60]. Therefore, a repartition of SiO4 units in mostly 5-, 6- and 7-membered rings, as
suggested by results from simulations, may actually explain the asymmetry observed in the Raman data. In all cases, the asymmetry of the R band further agrees with considering the structure of the SiO2 glass
as containing a distribution of rings with 3 to more than 8 tetrahedral units. In particular, two sharp peaks at ~590 and ~606 cm-1 in Raman spectra of SiO2 glasses (Fig. 11) can be assigned to minor fractions of
4- and 3-membered rings in the glass structure, respectively [39, 41, 42, 45–49, 51, 52, 68]. Such observation thus support results from simulations that tends to predict low concentrations of such rings in the glass structure [e.g., 46–48, 51]. The vibrational decoupling of such rings from the remaining part of the glass network allow them to contribute significantly to the glass Raman spectra [49]. Overall, the picture of the structure of the silica glass still is incomplete, but advances in simulations and spectroscopic technics may bring further determining pieces of information in a near future.
Value References
Si-O bond distance 1.59 – 1.61 Å [18, 67]
Si-O-Si bond 146° – 151° [17–19] % of 3-membered rings 0.0 – 0.7 % [18, 47, 51, 60] % of 4-membered rings 0.0 – 7.7 % % of 5-membered rings 17.0 – 23.0 % % of 6-membered rings 35.0 – 42.0 % % of 7-membered rings 17.0 – 31.5 % ≥ 8-membered rings 11.0 – 17.0
Table 1: Examples of structural characteristics of the silica glass, obtained either experimentally or from molecular dynamic simulations. Rather than proposing single values, a range of values is reported in the table.
1.2.2 Properties of Silica
The precedent section depicted the structure of the silica glass as consisting of a tri-dimensional arrangement of SiO4 tetrahedral units connected by their summit and forming ring structures in the glass.
Such interconnected, polymerized structure yields the highest known glass Tg, equal to 1480 K according to the calorimetric measurements of Richet and Bottinga [69] (Fig. 13).
Figure 13: Glass transition temperature Tg of the silica glass as a function of the molar concentrations
in Na2O (blue circles), OH (red diamonds), Al2O3 (pink hexagons) or Ga2O3 impurities (purple inverted
triangles), predicted from the viscosity data of Leko et al. [70] assuming that log(h) = 12 Pa s at T = Tg. For comparison, the calorimetric Tg of Richet and Bottinga [69] is also reported as a black empty square. Silica actually is the strongest know liquid, in the strong-fragile denomination of liquids that was introduced by Angell [71, 72]. A strong liquid is characterized by a linear or nearly-linear relationship between the logarithm of its viscosity and the Tg/T ratio, while fragile liquids present strong departure
from this linearity. The fragility m of liquids, equal to the slope of the log(h) vs Tg/T curve at Tg, allows one to quantify such deviations. m tends toward ~20 for strong liquids such as SiO2, and to much higher
values for fragile liquids, such as B2O3 for instance. The unique interconnexion of the silica tetrahedral
network makes the silica glass properties very sensitive to the presence of impurities. For instance, the addition of OH or Na2O in the silica glass produces a dramatic reduction of hundreds of degrees of the
silica glass transition temperature Tg (Fig. 13). Another example is the thermal diffusivity of the silica glass, which varies between 0.795 and 0.870 mm2 s-1 at 298K depending on the impurities present in the
glass [73; see Table 2]. Because of such sensitivity, four different types of silica glasses are usually distinguished depending on the level of impurities they contain [74]:
- Type I: glasses produced from natural quartz by electrical fusion under vacuum or under an inert gas atmosphere; they contain about 5 ppm or less of OH groups, but relatively high contents of melta impurities such as Al (30-100 ppm) and Na (~ 4ppm). Commercial names are Infrasil, IR-Vitreosil, G. E. 105, 201,204;
- Type II: glasses produced from quartz crystal powder by flame fusion (Verneuille-process), using an oxygen-hydrogen flame. They present OH contents ranging between 150 and 400 ppm, but much less metal impurities that type I glasses. Commercial names are Herasil, Homosil, Optosil, O.G. Vitreosil, G.E. 104;
- Type III: synthetic silica glasses produced by hydrolyzation of SiCl4. They are free from metallic
impurities, but high contents of OH (~ 1000 ppm) and Cl (~ 100 ppm). Commercial names are Suprasil, Spectrosil, Corning 7940;
- Type IV: synthetic silica glasses produced from SiCl4 in a water vapour-free plasma flame. These
glasses, similar to type III glasses, contain ~ 0.4 ppm OH and ~ 200 ppm Cl. Commercial names are Suprasil W, Spectrosil W, Corning 7943.
Another parameter needs to be taken into account when looking at the link between the structure and the properties of the silica glass: the fictive temperature Tf. Indeed, Tg is usually defined as the temperature corresponding to the glass transition upon cooling the melt at a given laboratory cooling rate of ~ 10°/sec. However, cooling the glass much faster or slower that the latter value yields different temperatures for the glass transition. Those different values are referred as the fictive temperature, Tf. As silica is extremely viscous even at high temperatures, changes of hundreds of degrees of Tf can be obtained easily by varying the cooling rate from hundreds of degrees per seconds to ~ 1° per second. This leads to small variations in the glass density or refractive index, for instance (Table 2). Such variations in the glass density are linked to changes in the silica glass structure: glasses presenting higher Tf also present high concentrations of three- and four-membered rings, as shown by the increasing signals of those rings in the Raman spectra of fast-quenched glasses [75]. However, such causal relationships between Tf, glass structure and properties is complex and depend on the glass composition. For instance, the analysis of a glass with a 75%-25% mixture of SiO2-GeO2 revealed an opposite correlation between the glass Tf,
Value Remarks References Density 2.2002-2.2060 g cm-3 depends on Tf [74]
Molar Volume 27.24-27.31 cm3 mol-1 depends on Tf Density conversion Thermal diffusivity D 0.795 – 0.870 mm2 s-1 at 298 K [73]
Refractive Index n 1.4583-1.4589 depends on Tf [74]
Calorimetric Tg 1480 °C - [69]
Configurational entropy 5.1 ±2 J mol-1 K-1 from calorimetric data [69]
Table 2: Examples of properties of the silica glass.
In addition to Tf, the densification of the silica glass also modifies the ring statistics, and, hence, its elastic properties. Indeed, upon densification, the frequency of the R band significantly increases, pointing to a puckering of the rings in the network without significant changes in the Si coordination or Si-O bond distance, at least up to pressure of ~ 8GPa [76, 77]. Such changes are reversible up to 8 GPa. After this pressure, irreversible changes are observed and reflect a change in ring statistics [76]. Compared to the ambient pressure SiO2 glass, permanently densified glasses typically exhibit higher concentrations of
four and particularly three membered rings [78]. The inter-tetrahedral angles in those rings is unaffected by the densification, contrary to the Si-O-Si angles of large rings that significantly decreases of ~ 6° with a 20% densitification [79]. Molecular dynamic simulations from Huang et al. [66] further suggest that an increase of dense, a-cristobalite-like 6-membered rings in SiO2 upon densification may explain the
densification mechanism of amourphous SiO2. The authors of this study indicate that the anomalous
elastic property of amorphous SiO2, i.e. its decreasing elastic modulus upon compression, actually is
explained by the conversion of b-cristobalite-like 6-membered rings in a-cristobalite-like 6-membered rings upon compression. Their simulation further shows that the introductions of elements such as rare gas or alkali oxides in the SiO2 3D tetrahedral structure further prevent this convertion process, and help
reducing the elastic anomaly of the SiO2 glass. 1.3 Aluminium-free Silicate Glasses
In silicate glasses, other elements are frequently present and play a role different to that of Si4+. Amongst the major cations present in industrial and geologic silicate glasses, we can cite Al3+, Fe3+, Ti4+, Li+, Na+,
K+, Fe2+, Ca2+ and Mg2+ (Fig. 1). At the present time, we will focus on a brief description of the Al-free
silicate glasses.
As visible in Fig. 13, the properties of the silica glass, such as, for instance, its Tg, can be greatly affected by addition of small fractions of impurities, such as for instance of Na+ metal cations. The latter actually are considered as network modifier cations, which break Si-O-Si bonds, and form ionic bonds with the newly transformed non-bridging apical oxygens. Such process leads to the dramatic depletion in the glass
Tg observed in Fig. 13. The following section will describe in more detail such processes at the molecular scale, and their effect on the glass properties.
1.3.1 Network modifier elements and Qn units
Alkali (Li, Na, K) and alkaline-earth (Ca, Mg) metal cations can be present together with SiO2 in glasses,
forming sensu stricto silicate glasses (aluminum free). However, such cations present ionic field strengths (IFS = Z/r2, with Z the cation electronic charge and r its ionic radius) too low to be able to enter the glass structure in tetrahedral units as Si4+ does. Indeed, according to Dietzel [80], cations presenting large IFS tend to enter in tetrahedral coordination and act as network former cations. For instance, the IFS of Si4+ is equal to 59.1 Å-2. Other network former elements can present lower ionic field strength, e.g. Ge4+ in CN 4 presents an IFS of 26.3 Å-2, but such values still are high enough such that they play network former
roles. On the other hand, cation with IFS lower than ~ 8 Å-2 do not act as network formers in glasses.
Instead, they play either a network modifier role, breaking Si-O-Si bonds, or a charge compensator role, ensuring electrical neutrality in the vicinity of trivalent network former cations such as Al3+ (see sec. 1.4; Al3+ IFS = 26.3 Å-2 in CN 4). In Al-free silicate glasses, introduction of network modifiers thus results in glass depolymerisation: network modifiers break Si-O-Si bonds, and form weak bonds with the non-bridging oxygen (NBO) anions at the summit of the SiO4 tetrahedral units.
As a result of the process previously described, SiO4 tetrahedral units in alkali and alkaline-earth silicate
glasses carry different numbers of NBOs and BOs, and, hence, the local environment of Si4+ atoms vary. For instance, the Si-BO distances are shorter than the Si-NBO distances, as revealed by molecular dynamic simulations from Ispas et al. [81]]. This study provides values of 1.63-1.64 Å for Si-BO distances and 1.58-1.60 Å for Si-NBO distances in the Li2Si4O9 glasses, depending on the potential used
as of the 29Si NMR frequency [83, 84]. Those variations can be detected with using Raman and 29Si NMR
spectroscopy, respectively. The study of the Raman and 29Si NMR spectra thus allows observing how the glass polymerization changes with its composition [43, 58, 82, 84–88].
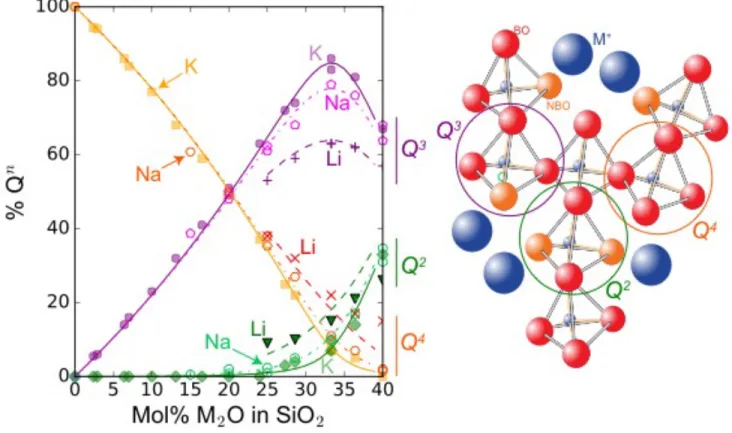
Figure 14: Changes in the fractions of Qn units measured by 29Si NMR spectroscopy as a function of the alkali metal content of binary M2O-SiO2 glasses (M= Li, Na, K). Alkali content is restricted to the 0-40
mol% range, but can reach higher values for Na2O-SiO2 glasses, such that Q1 and Q0 units also has been
detected in Na2O-rich silicate glasses. On the right is shown a schematic view of the structure of an alkali
silicate glasses, in which the Q2, Q3 and Q4 units are distinguished; NBO and BO refer to non-bridging
and bridging oxygen atoms, respectively, and M+ refers to alkali network modifier cations. Si4+ network
former cations are in purple at the center of the tetrahedra. Curves are calculated from the equilibrium constant of the 2Q3 = Q2+Q4 relationship, with values of 0.008, 0.02 and 0.08 for the K, Na and Li silicate compositions. Data are from [84, 88–90].
Figure 14 illustrates, for instance, how the fractions of tetrahedral units carrying different numbers of BO and NBOs at their summit vary along the Li2O-SiO2, Na2O-SiO2 and K2O-SiO2 binary joins, from 0
containing different numbers of BO and NBO is the Qn notation [85], where n refers to the number of BO carried by the SiO4 tetrahedron Q. For example, the silica glass can be considered as composed of
(ideally) only Q4 units. Contrary to that, a sodium trisilicate NaSi3O7 glass (75 mol% SiO2) presents a
distribution of Qn units with 48% Q4, 50% Q3 and 2% Q2 [84]. Increasing the concentration in network modifier cations promotes the existence of Qn-1 units at the expense of Qn units in the glasses (Fig. 14), this effect being proportional to the fraction of added network modifiers. In addition, this effect is not ideal and depends on the ionic field strength of the network modifier cation that is present in the glass (Fig. 14). For instance, lithium silicate glasses are richer in Q2 and Q4 units than sodium silicate glasses. This translates a tendency of Li+ network modifier cations to cluster in the vicinity of Q2 units in the network, leading to local enrichment in Q4 units by compensation. This clustering may be related to the presence of network modifier percolation channels in the glass structure, as discussed in section 1.3.3. In all cases, increasing the metal cation ionic field strength in silicate glasses shifts the equilibrium:
Qnó Qn-1 + Qn+1 , (1)
to the right-end side. One should note that, for a given composition, the equilibrium described by eq. (1) may also depend on the glass fictive temperature, which varies with the glass cooling rate. Indeed, higher temperature promote the shift of the reaction described by eq. (1) to the right, as shown by data from Raman spectroscopy and 29Si NMR spectroscopy of alkali silicate melts [e.g., 91–94].
The knowledge of the Qn distribution in glasses allows evaluating their ratio of NBO to tetrahedral units, NBO/T, which is a bulk measure of the glass polymerization. The NBO/T can be calculated from knowledge of the Qn units distribution as:
NBO/T = 4 xQ0 + 3 x(Q1) + 2 x(Q2) + 1 x(Q3) , (2)
or from the knowledge of the molar proportions of the different network formers T, network modifier Mi+ and oxygen O ions, as [95, 96]:
!"# $ = &#'($ $ = *+,-. $ / /01 . (3)
The glass chemical composition thus defines its NBO/T as well as the distribution of its Qn species. Different models have been proposed to calculate the latter. The binary distribution model, suggested by Dupree et al.[97], predicts that only two species are present in the glass at given SiO2 content, such that
the Qn units in the glass are distributed as binary combinations of Q4-Q3, Q3-Q2, Q2-Q1 and Q1-Q0 as observed in silicate minerals. Contrary to that, the random bonding model predicts that the concentration of a Qn unit can be calculated from a random distribution of the NBO and BO between the units. Figure
15 shows a representation of the two models.
Figure 15: the binary (A) and random bonding (B) models predicting the fractions of the different Qn
units as a function of the mol% of Mn+
2/nO in SiO2 (M a network modifier element, such as Li, Na, K, Ca
or Mg).
It is clear from the comparison of Figs. 14 and 15 that the reality lies between those two extreme visions. Neither the random bonding model nor the binary distribution model describe the measured distribution of Qn units observed in silicate glasses. Furthermore, those models do not account for the temperature dependence of the Qn unit speciation. Indeed, in glasses the Qn unit distribution is frozen-in, but as highlighted previously, it changes with T in the molten state, such that glasses with different Tgs will present slight variations in their Qn unit distribution [91–93]. Using the thermodynamic theory of affinity, the model of associated solutions was proposed to solve such issues [98–100]. This model is based on
the idea that melts are media in which chemical reactions, characterized by their standard Gibbs free energies, proceed in the direction of the equilibrium state. The latter is reached when the total Gibbs free energy of the system reaches a minimum. More recently, Gaddam et al. [101] proposed a new model based on statistical mechanics. This model assumes grand canonical ensemble of silicate units, i.e. the
Qn are considered as a statistical ensemble in thermodynamic equilibrium with a reservoir from which they exchange energy and network modifiers. The first test performed with this model, which takes into account the composition and temperature in the calculation of the Qn unit fractions, are promising and may offer a new way to calculate the distribution of Qn units in silicate melts. In particular, this model allows calculating the proportions of Qnijkl units, where the ijkl subscripts represent the n number of the
adjacent tetrahedral units to the central Q unit. For instance, a Q4 units bonded to 2 other Q4 units and 2
Q2 units will be described as Q42244. A Q3 unit bonded to two other Q3 unit and one Q4 unit will be written
Q3334, the fourth subscript being omitted because of the NBO carried by the Q3 unit. Such level of refinement has been reach by using 29Si double quantum NMR spectroscopy, which allows discriminating the different Qn units bonded to the central Qn unit (Fig. 16).
Figure 16: Top: Enlarged 29Si double quantum (DQ) NMR spectrum of a Na2Si3O7 glass. The marked
peaks with chemical shifts of 89, 92 and 94 ppm on the horizontal axis belong to Q3333, Q3334, Q3344 units.
These values can be used to fit the 1D 29Si NMR spectrum of the glass with Gaussian peaks, as shown at the bottom. Hatched lines are used for the Q3jkl lines whereas long hatched lines with dots are used for
the corresponding Q4
jklm resonances in the linedeconvolution. Reprinted from Olivier et al. [102],
Copyright (2001), with permission from Elsevier.
In addition to the statistical mechanic model of Gaddam et al. [101], the random connectivity model of Machacek et al. [103] also allows predicting the different fractions of Qnijkl units in the glass network. It assumes that the tetrahedra are linked fully on a random base. The distribution of Qnijkl units are calculated using a multinomial distribution. This model can be seen as an extension of the random bonding model presented previously. It thus faces the same limitations, particularly in regards of the effect of temperature as well as the random character of tetrahedral bonding.
1.3.2 Qn unit distribution: links with glass properties
In the introduction, we showed that the density of an alkali silicate glass increases upon addition of alkali oxide while its Tg dramatically decreases. Such changes actually can be correlated with the changes in the glass structure. In order to calculate the density of silicate glass, Doweidar [24, 104, 105] assigned different partial molar volumes to the different Qn units. His calculations allow to calculate the density of silicate glass, but, maybe more importantly, give some insights about the volume properties of Qn units. Indeed, he reported that, while the volume of Q4 units seem to be constant and equal to that in pure SiO2, the volumes of Q3, Q2 and Q1 units depend on the network modifier present in the glass network
(Fig. 17).
First, for a given network modifier, the partial molar volume Vm of the Qn units increases in the order
Vm(Q4) < Vm(Q3) < Vm(Q2) < Vm(Q1) < Vm(Q0). This trend is explained by the fact that M-O distances are longer than Si-O distances (Table 3), such that Qn species surrounded by more network modifiers have higher partial Vm. Turning to the linear correlation between the ionic radius of the network modifiers and the volume of the Qn units, such volume effect is explained by the difference in the M-O bond length as the ionic radius of the M cation increases. Indeed, results from experiments and molecular dynamic simulations show that the ionic radius and M-O bond length are positively correlated (Table 3).
Figure 17: Partial molar volume of Qn units Vu estimated by Doweidar [105, 106] as a function of the
ionic radius of metal network modifier cations (Li, Na, K, Rb, Cs, Ca, Sr, Ba, Cd) in silicate glasses. Ionic radius is reported for a constant CN of 6, using values from Shannon [107]. Variations in the true CN of the modifiers may explain some of the scattering in this relationship [e.g., 108–111].
Table 3 show a comparison of Si-O and M-O distances obtained for alkali tetrasilicate glasses by experimental methods (X-ray and neutron diffraction experiments) and Car-Parrinello molecular dynamic simulations. We note that values from simulation and experiments are in good agreement. Both indicate that Si-NBO distances are shorter than Si-BO distances. Furthermore, in addition to being affected by the ionic radius of the M element, the O distance changes as a function of the O atom: M-NBO distances appear to be significantly shorter than M-BO distances.
In addition to affecting the glass density and partial molar volume, the large changes in the polymerization of the glass structure that accompanies the changes in the glass chemistry strongly affect the glass thermodynamic and rheological properties. However, those changes are different. For instance, the glass heat capacity is an additive function of the glass composition, such that it can be calculated using a set of partial molar volumes of the glass oxide components, as provided by Richet [112]. In general, the heat capacity of silicate glasses tends to the Dulong and Petit limit (=3R, with R the perfect
gas constant) as T tends to Tg, such that the glass heat capacity at Tg can be calculated using this limit. However, this relationship should not be extended to other type of glasses, because, for instance, the glass heat capacity of B2O3 at Tg only reach values ~0.6 3R [see 112 and references therein].
Glass Si-O Si-NBO Si-BO M-O M-NBO M-BO Method References
Li2Si4O9 1.60(-) - - 1.96(-) - - Exp. [113]
Li2Si4O9 1.63(-) 1.58(-) 1.64(-) 1.92(-) 1.87(-) - MD. [81]
Na2Si4O9 1.625(11) 1.589(8) 1.65(8) 2.45(40) 2.29(24) 2.52(25) Exp. [114]
Na2Si4O9 1.63(-) 1.58(-) 1.65(-) 2.28(-) - - MD. [115]
K2Si4O9 - - - 2.77 - - MD. [116]
Table 3: Examples M-O bond distances in tetrasilicate glasses reported from molecular dynamic simulations (MD.) and experimental (Exp.) studies.
Figure 18: Glass configurational entropy, equal to the melt configurational entropy at Tg, as a function
of the mol% of Na2O added in SiO2. Those values were estimated from the fit of the melt viscosity data
for SiO2 that was estimated by [69] using the complete thermodynamic cycle. Errors bars on the points
are not reported for clarity; they vary between 0.5 to 2 J mol-1. The red plain line (LL2017 in legend) and its associated errors represented by dashed lines (95% confidence interval) represent the values calculated from the model of Le Losq and Neuville [20]. Other data come from individual fits of the viscosity data by [117; R1984 in legend], [[118; T2001 in legend] and N2006: [[23; N2006 in legend].
While the glass heat capacity is an additive function of the glass composition, the glass configurational entropy at Tg is not. It presents complex and non-linear variations as a function of the glass composition (Fig. 18). Values reported in Fig. 18 were calculated using viscosity data, through the Adam and Gibbs theory that relates the viscous flow of silicate melts to their thermodynamic properties (see chapter XXX). Values calculated by different authors scatter significantly, showing the sensitivity of the calculation of the glass configurational entropy Sconf using melt viscosity data to 1) the quality of the viscosity data and 2) the fitting protocols performed by the different authors. Le Losq and Neuville[[20] recently proposed a simple model to calculate Sconf from the distribution of the Qn species in sodium and potassium silicate melts. This model deviates from an idea originally proposed by Mysen [119], which proposed that the configurational heat capacity of silicate melts 𝐶34567 (equal to the difference between the melt Cp at T and the Cp glass at Tg) can be calculated from partial molar heat capacity values 𝐶389 assigned to different
Qn units:
𝐶34567 = (60;𝑥89 𝐶38 9
, (4)
with 𝑥89 the fractions of the Qn units. Figure 19 shows that such model allows reproducing fairly well
Figure 19: Comparison of the 𝐶34567 values calculated by Mysen [94] using the model resumed in eq. (2) at 1400°C and values derived from measurements. Reprinted from Mysen [94], Copyright (1999), with permission from Elsevier.
Following the idea of Mysen [119], Le Losq and Neuville [20] assigned Sconf partial molar values to the different Q2, Q3 and Q4 units in the melt, allowing one to calculate the topological contribution to the configurational entropy of the glass, i.e. the entropy arising from the disorder in the tetrahedral network in term of Si-O bond distances and Si-O-Si bond length. Indeed, the configurational entropy of glasses can be divided in topological Stopo and chemical Smix contributions as:
𝑆4567 = 𝑆=535+ 𝑆?*@ . (5)
Stopo originates from the disorder in the glass network, in term of Si-O bond distances and Si-O-Si bond length for instance. Smix represents the excess of entropy generated by the mixing of different elements in similar structural positions. Le Losq and Neuville [[20] thus calculated Stopo as:
and Smix as: 𝑆E*?*@ = −𝑥
E* 𝑥#∗ 2𝑅 ∗ (60&𝑥89𝑙𝑛 𝑥89 , (7)
with R the perfect gaz constant, and xSi and xO the atomic fractions of Si4+ and O2-. In eq. (6), different 𝑆845679 values are used for potassium and sodium silicate melts as the coupling between the M alkali
modifier and the Qn tetrahedral species varies with the ionic radius of M. The factor 2 in eq. (7) arises when working using an O2 base to express the thermodynamic values (i.e. the structural formula is
expressed using an O2 base). This simple model allows one to calculate the configurational entropy of
alkali silicate glasses with a good accuracy, falling in between the individual values reported by previous studies (Fig. 18). Adopting a thermodynamic and structural point of view, this model further provides pieces of information regarding the origin of the evolution of the silicate glass Tg along the binary M2
O-SiO2 join (Fig. 20).
Figure 20: Variation of the topological and mixing contributions to the entropy of potassium and sodium silicate melts as predicted by equation 3 and 4, respectively, as a function of the concentration in alkali oxide in the melt. Values from [20].
Indeed, the model predicts that the apparition of Q3 species upon addition of a few mol% alkali oxide in SiO2 leads to a large, dramatic increase in the chemical contribution to the glass configurational entropy
because Si can mix between the existing Q4 and the newly formed Q3 units. In other term, this illustrates
Stopo KS Stopo NS Smix NS Si Smix KS Si
that the introduction of NBO in the glass network allows new configurational environments for Si, and lowers the melt viscosity and glass Tg. The model further predicts that the glass topological entropy varies nearly linearly (Fig. 20), being driven by the changes in the Qn unit distribution. This model remains to be further tested by new research, but together with the works of Mysen [[94, 119] and Doweidar [24, 104, 105], it illustrates that the Qn unit distribution can be a useful tool for modelling the properties of silicate glasses.
1.3.3 Structure at medium range order and the Mixed Alkali Effect
While at short range order, the structure of silicate glasses can be described as a mixture of interconnected
Qn units with interstitial network modifier elements forming ionic bonds with NBOs as discussed in the previous section, such vision is difficult to extrapolate at the medium range order. Indeed, the network modifier cations have high coordination numbers, and are surrounded by both BO and NBOs from several Qn units [e.g., 120, 121]. For instance, in aluminum-free silicate glasses, Ca2+ and Mg2+ coordinence numbers are of ~4-5 [109, 122–124], whereas that of Na+ is ~6[110, 111, 125]. The network modifier cations thus have defined local environment, such that the RN model (see section 1.1) cannot account for their distribution in silicate glasses because it assumes their random repartition in the free volume in the silicate network [126]. An alternative model is thus needed to describe the arrangement of the different network former and modifiers cations in the glass structure.
Two models were proposed to account for the environment of network modifiers in silicate glasses. From the interpretation of X-ray absorption results [126–129], Greaves and co. proposed the Modified Random Network (MRN) model. It depicts the glass structure as a tri-dimensional arrangement of dynamic channels of network modifier metal cations percolating through a disrupted silicate tetrahedral network. Such channels are dynamic features in the molten state, and become frozen-in in the glasses below Tg. However, the interpretations of 23Na and 17O NMR data on sodium silicate and alumino-silicate glasses lead Lee and co. [130–132] to propose an alternative model: the Perturbed Cation Distribution (PCD) model. The PCD model assumes a relatively homogeneous distribution of metal cations in the glass network, neither random nor forming clusters. It describes network modifiers as surrounded by both NBO and BO anions, as indicated by NMR data [e.g., 132]. Whether one adopts the MRN or the PCD model to describe the glass structure, the adopted model needs to explain an effect that greatly affect the glass properties: the Mixed Modifier Effect. This effect is also called the Mixed Alkali Effect (MAE) or
the Mixed Alkaline-earth Effect (MME) in the literature. To avoid confusion, we chose to use the MME denomination in the present handbook.
Figure 21: Glass transition temperature Tg and logarithm of the electrical resistivity at 373K of K2Si2O5
-Na2Si2O5 mixed glasses, as a function of the fraction of K in the glasses. The Mixed Modifier Effect
(MME) refers to the non-linear and large deviations of many glasses properties when mixing two network modifier elements in the glasses. Data from [133–135].
The MME refers to the strong and non-linear changes in silicate glass properties that can occur upon mixing two metal cations [e.g., see 136, 137 and references cited therein]. Figure 21 illustrates this effect on the Tg and the electric resistivity of glasses that are mixtures of K2Si2O5 and Na2Si2O5. Upon mixing
Na+ and K+ in the glasses, a large depression in the glass Tg is observed while the electric resistivity increases of several orders of magnitude. The MME usually results in maxima or minima of the glass properties when the ratio A/(A+B) between the mixed A and B cations reach 0.5. This effect has been extensively documented for Na and K in silicate glasses [e.g., see 136, 137 and references therein], but it also occurs in silicate glasses when mixing different alkaline-earth cations such as, for instance, Ca
deviations to linearity than mixing alkaline-earth modifier cations [139]. The MME also occurs in Al-bearing silicate glasses [140–143], but recent data suggest that it may be more complex that the MME in Al-free silicate glasses [57], such that it will be treated separately in the case of Al-bearing glasses in sec. 1.4.5. In all cases, the MME affects various glass properties, such as, for instance, the glass Tg, Vickers hardness, compressibility, electrical resistivity or ionic conductivity (e.g., Fig. 21).
The source of the MME has been an extensive subject of study, and no real consensus about its origin has yet been reached because of the complexity of ionic diffusion in glasses. The MRN model of the glass structure was initially accounting for this effect by assuming that the diffusions of two different modifier cations were affected by the presence of each other in the channels [128]. Greaves and Ngai [121] further refined the MRN model to explain the MAE. They proposed that the alkali modifiers diffuse in the channels through a mechanism of cooperative intrachannel hopping. According to them, the increase in electrical resistivity observed upon mixing modifier cations (Fig. 21) reflects radical changes and differences in the diffusion coefficients of the modifier cations. Such cation diffusivity can be calculated as a function of the RM-M inter-cationic distances, the hopping attempt frequency no, the diffusion frequency factor Do, the activation enthalpy W, the Boltzmann constant k and the temperature
T as [129]:
𝐷; = 𝑅+'+& 𝜈
5/6 , (eqDoGN)
𝐷 = 𝐷;𝑒'Q/R$ . (eqDGN)
Figure 22 shows the results of such calculation: the diffusivity of Na and K are calculated at 25, 200 and 350°C in mixed Na-K trisilicate glasses; this allows the calculation of the electrical conductivity. The agreement between the model and experimental data is also shown, and the model reproduces fairly well the predicted deviations. However, looking in details, it predicts too strong depletion of the electrical conductivity at K/(K+Na) ~ 0.5.
Figure 22: A) Isothermal diffusion coefficients and B) electrical conductivities for the mixed alkali glasses 0.25 [KgKNa1-gK]2O – 0.75 SiO2. Points are experimental data, dashed lines are interpolations
of those data, and the plain lines are the prediction by the model proposed by Greaves and Ngai [129]. Reprinted figure with permission from G.N. Greaves and K.L. Ngai, Physical Review B. 52, 6358–6380, 1995, doi:10.1103/PhysRevB.52.6358. Copyright (1995) by the American Physical Society
In all cases, the existence of ionic diffusive pathway for modifier cations, as depicted by the MRN model, has been supported by results from atomic force microscopy [e.g., 144], molecular dynamic simulation
![Figure 1: Ring and earring reproduction. Image reproduced from Henrivaux, 1897, “Le Verre et le cristal” Vicq-Dunaud Editors, Paris [1]](https://thumb-eu.123doks.com/thumbv2/123doknet/14659213.553810/4.918.248.673.115.541/figure-earring-reproduction-reproduced-henrivaux-cristal-dunaud-editors.webp)


![Figure 10: Image linking the transition between the theoretical 2D view the structure of the silica glass as drawn by Zachariasen [26] in 1932 (on the left) and the experimental observation by Huang et al](https://thumb-eu.123doks.com/thumbv2/123doknet/14659213.553810/16.918.267.652.518.815/figure-linking-transition-theoretical-structure-zachariasen-experimental-observation.webp)


![Figure 17: Partial molar volume of Q n units V u estimated by Doweidar [105, 106] as a function of the ionic radius of metal network modifier cations (Li, Na, K, Rb, Cs, Ca, Sr, Ba, Cd) in silicate glasses](https://thumb-eu.123doks.com/thumbv2/123doknet/14659213.553810/30.918.271.647.97.476/figure-partial-estimated-doweidar-function-network-modifier-silicate.webp)
