The importance of characterizing residual household waste at the local level: a case study
1
of Saguenay, Quebec (Canada)
2
Julie Élize Guérin1*, Maxime Charles Paré2, Sylvain Lavoie1, Nancy Bourgeois1 3
1 Sustainable Development and Environmental Services, City of Saguenay, Saguenay, QC, 4
Canada, G7H 1R9
5
2 Département des sciences fondamentales, Université du Québec à Chicoutimi, Saguenay, 6
QC, Canada, G7H 2B1
7
* Corresponding author.
8
email address: julie.guerin@ville.saguenay.qc.ca. Postal address: 214 rue Racine Est,
9
Saguenay (QC) Canada G7H 1R9. Tel.: +1 (418) 3000, ext. 3374; Fax +1 (418)
698-10 3852. 11 12 Accepted 15 April 2018 13 14 Keywords 15
Residual household waste, characterization, waste management plan
16 17
Highlights
18
An approach for understanding the composition of garbage.
19
A dataset contributing to the creation of a regional database for waste
20
management.
21
An inspiration for municipalities faced with similar realities.
22
A simple method for characterizing the composition of residual household
23
waste
Abstract
25
Knowledge of the quantity and the type of residual household waste (RHW) generated by
26
a population within a given territory is essential for developing affordable, effective, and
27
sustainable management strategies for waste. This study aims to accurately describe the
28
composition of residential residual materials collected directly from households over the
29
course of a year. Household waste was collected from urban and rural sectors that were
30
representative of the study territory. Samples were collected during the winter, summer,
31
and fall of 2014. A total of 3,039 kg of RHW was collected and sorted into 9 categories
32
and 39 subcategories. Statistical analysis showed, except for organic matter, that the weight
33
percentage of each category of material did not significantly differ among sampling periods
34
or locations. Therefore, the results for a category were compiled to generate a single value
35
to calculate the relative abundance of each type of residual material. Organic matter made
36
up the majority fraction of the RHW (53% to 66%). This was followed by plastics (9%),
37
bulky items and renovation/demolition debris (6%), textiles (5%), metals (4%), paper and
38
cardboard fiber (4%), glass (2%), and household hazardous waste (2%). This approach has
39
allowed us to improve the accuracy of the data used in MRM, contribute to the creation of
40
a regional dataset for waste, and develop a methodology more applicable to local realities.
41
Specific to the immediate needs of municipal MRM, we updated knowledge regarding the
42
generation, recovery, and disposal of the contents of the residential sector, and tracked the
43
evolution and the variation of contents over a given period. We believe our methodology
44
is applicable to other regions having similar characteristics in terms of climate,
socio-45
economic status, and other parameters that affect the composition of RHW.
46 47
1. Introduction
48
Waste management in regional municipalities remains challenging and continues to evolve
49
due to the new and continually increasing amounts of consumer products. Efforts have
50
been directed toward the principles of the 4R-E (first prioritize a reduction (R) at the source,
51
then (R) reuse, recycling (R), and recovery (R) before elimination (E)) and toward
52
information, awareness, and education of citizens to reduce the amounts of waste directed
53
to landfills. However, municipalities often do not have good datasets regarding consumer
54
behaviour nor patterns of consumption. Establishing affordable, effective, and sustainable
55
practices for the management of residual material (MRM) is the foundation of sustainable
56
development, yet it remains a challenge due to the increased generation of residual material
57
of all kinds and the associated pollution.
58
Understanding the generation and composition of residual household waste (RHW)
59
produced within a given territory is key to success for the MRM of a regional municipality
60
(Sakai et al., 1996; Gidarakos et al., 2006; Ojeda-Benίtez et al., 2008; Aguilar-Virgen et
61
al., 2013). Thus, characterizing RHW can provide an estimate of the potential mass of
62
materials available for 4R-E, identify the sources of the generated materials, and establish
63
the physical, thermal, and chemical properties of RHW to facilitate the design of equipment
64
for the treatment of waste (Zeng et al., 2005; Chang and Davila, 2008). These data can help
65
establish an effective management approach to reach goals and to comply with national,
66
provincial, and local regulations or benchmarks for waste management.
67
Despite the importance of knowing the types and amounts of RHW across a
68
territory, there are no international standard methods for characterizing household waste
69
(Dahlén and Lagerkvist, 2008; Lebersorger and Schneider, 2011). MRM planners are often
left on their own to undertake the required studies. Segregation of RHW is, however, well
71
documented in the scientific literature and numerous approaches have been developed
72
(Parfitt and Flowerdew, 1997; Petersen et al., 2005; Dahlén and Lagerkvist, 2008;
73
Lebersorger and Schneider, 2011; Edjabou et al., 2015). The methods used to characterize
74
RHW vary widely due the different means of obtaining samples of waste: garbage has been
75
collected from households (Abu Qdais et al., 1997; Bernache-Pérez et al., 2001; Qu et al.,
76
2009), vehicle loads (Petersen et al., 2005; Gidarakos et al., 2006; Aguilar-Virgen et al.,
77
2013), and landfills (Bernache-Pérez et al., 2001; Zeng et al., 2005; Sharholy et al., 2007;
78
Chan and Davila, 2008; Pattnaik and Vikram Reddy, 2010). Furthermore, there is also
79
variability in determining the number of categories into which material is segregated, the
80
level of specificity of these categories, and the number of samples required (Zeng et al,
81
2005; Dahlén and Lagerkvist, 2008). This diversity of approaches in sampling and sorting
82
make comparisons between studies very difficult.
83
The most accurate method for determining the composition of RHW is to collect
84
the refuse at the location where it was generated and immediately sort the waste into
85
different categories (Brunner and Ernst, 1986; Abu Qdais et al., 1997). Collection of the
86
refuse directly at the residence facilitates the identification of the material, eliminates the
87
uncertainty as to its origin (residential vs industrial, commercial, institutional), and allows
88
a simpler calculation of waste generation rates (Abu Qdais et al., 1997; Bernache-Pérez et
89
al., 2001; Qu et al., 2009).
90
This sampling strategy may be more accurate than vehicle load or landfill methods
91
in regard to the integrity of the contents as the processes of decomposition, compaction,
92
and mixing of contents in the collection truck can alter the physical condition and initial
chemistry of the materials. Cross-contamination between individual fractions also occurs,
94
leading to inaccuracies that can neither be measured nor corrected afterwards (Edjabou et
95
al., 2015). However, to determine the chemical and physical parameters of each fraction
96
contained in municipal garbage, evaluate the influence of a given factor on the abundance
97
of a material, estimate changes in the composition of materials over time, and evaluate the
98
impacts of different material collection systems, the vehicle load strategy is the most
99
reliable (Brunner and Ernst, 1986, Peterson et al., 2005).
100
To reach zero waste, achieve the objectives of both the Quebec action plan on
101
climate change and the provincial energy strategy, and to empower all actors involved in
102
the MRM, the Government of Quebec developed the Quebec Residual Materials
103
Management Policy (QRMMP) (Environment Quality Act, 2017). The main goal of the
104
policy is to make end-waste the only residual material sent for disposal in Québec.
End-105
waste is the remaining waste after residual materials have been sorted, processed, and
106
reclaimed; “end-waste cannot be processed any further under existing technical and
107
economic conditions to extract reclaimable content or reduce its polluting or hazardous
108
character” (Environment Quality Act, 2017). However, waste management planners in
109
Quebec (and Canada) have not yet developed a standard method for the sampling of
110
residual material for a municipality to provide critical information for achieving this
111
objective.
112
Over the last decade, Recyc-Québec and Eco Entreprises Quebec (henceforth
113
referred to as RQEEQ) have developed an applicable methodology for characterizing the
114
generation of residential waste for the province of Quebec. Across the 11 administrative
115
regions of Quebec, they selected 30 communities and within each, 20 clusters were chosen
at random, each cluster comprised of at least five housing units (RQEEQ, 2007). Nearly
117
68,000 kg of residual material was sampled and sorted into 9 major categories and 85
118
subcategories of waste.
119
However, according to Chang and Davila (2008), national/provincial averages are
120
not very specific and do not reflect the local conditions of communities. The methods of
121
large-scale inventories provide a portrait of the quantity of each type of material found in
122
municipal waste, but do not consider the particular characteristics of local waste that may
123
vary considerably from those at the national/provincial level. In addition, the composition
124
of residential waste may vary according to the seasons, the geographical situation (Zeng et
125
al., 2005), the socio-economic status of citizens (Maystre and Viret, 1995), the
126
demography, the climatic zone, as well as the local regulations and services offered in
127
terms of the collection, transportation, and disposal of residential materials (Dahlén and
128
Lagerkvist, 2010). Without knowledge of these factors, assessing the composition of waste
129
becomes difficult (Gidarakos et al., 2006; Ojeda-Benίtez, 2008; Thitame et al., 2010-cited
130
in Aguilar-Virgen et al., 2013). In Quebec, as each regional municipality is responsible for
131
the planning and the management of waste on its territory, characterization of RHW should
132
therefore be conducted at the municipal level. As well, municipalities often contribute to
133
the creation of regional datasets and to the development of an approach for estimating
134
waste inventories that is more adapted to local realities.
135
The main objective of this study is to accurately describe the composition of
136
residential residual materials collected directly from households over the course of a year.
137
Further objectives include demonstrating that characterization of RHW at the local level is
138
more accurate than at the national/provincial level. Furthermore, we aim to calculate the
economic impact of materials that may be 4R but that are still landfilled. The developed
140
approach will also respond to the provincial-level requirements established by the QRMMP
141
and its action plan for 2011–2015.
142 143
2. Materials and methods
144
2.1 Description of the study area
145
The study area is located in central Québec, Canada, slightly north of the 49th parallel, in 146
the administrative region of Saguenay-Lac-Saint-Jean (SLSJ). It has a humid continental
147
climate where the average temperature is 2.8 °C marked by very cold winters (-15.7 °C)
148
and cool summers (18.4 °C).Mean annual precipitation is 931 mm in the form of either
149
rain or snow (Bagotville A meteorological station, Environment and Climate Change
150
Canada, 2015). The territory covered by the study includes the 13 municipalities of the
151
regional county of Fjord-du-Saguenay (FDS) and the City of Saguenay made up of three
152
administrative units, called boroughs; units whose function is to ensure the supply of local
153
services. This territory covers an area of approximately 45,000 km2. However, almost 90% 154
of the territory is occupied by unorganized territories (Mont-Valin, Lac-Ministuk, and
155
Lalemant) with inhabited areas covering only 7,000 km2. The FDS and the City of 156
Saguenay represent 60% of the population of the SLSJ region with the City of Saguenay
157
representing more than 50% of the population of the region alone. Both are part of the
158
eastern portion of the SLSJ commonly referred to as Saguenay. As of 2014, the population
159
of the City of Saguenay was 145 990 with a population density of 128.5 inhabitants/km2. 160
The FDS has a population of 21,718 with a density of 0.5 inhabitants/km2 (Quebec Institute 161
of Statistics, 2017).
162
The regional economy is based on forestry, aluminium production, wood and paper
163
industries, agriculture, and tourism. The City of Saguenay has a great influence on the
164
surrounding municipalities of the FDS especially in terms of employment and services with
165
the socio-economic characteristics being similar for both the FDS and the city. It can then
166
be assumed that the level of stratification of this study is appropriate as factors such as
167
culture, socio-economic contexts, climate, collecting systems, residential organization, and
168
the availability of alternative sites of waste discharge are similar among the urban and rural
169
sectors.
170
2.2. Municipal solid waste collection
171
The collection of household garbage (RHW) and recyclable materials is available across
172
the entire territory of the Saguenay (rural and urban sectors). RHW is defined as the solid
173
residues produced during purely domestic activity, for which the municipalities are obliged
174
to collect. Garbage bins are collected at the curb side and transported to a landfill site
175
located on the territory of the City of Saguenay. The RHW in containers and bags are
176
accepted by this municipal collection. However, containers available for multi-family units
177
(having six or more units) have volumes of 2 to 8 cubic yards. For RHW collection in the
178
City of Saguenay, there are 39 collections during the year; one collection every two weeks
179
between the end of October and the beginning of May and then for each week over the
180
summer period (early May to the end of October). During the winter, RHW collection is
181
every two weeks for a household. In 2014, the quantities of produced RHW were 42,696
182
tonnes (t) for the City of Saguenay and 7,327 t for the FDS (a total of 50,023 t) (Ville de
Saguenay et MRC du Fjord-du-Saguenay, 2016). Waste from the industrial, business, and
184
institutional sectors were not considered in this study.
185
In the study area, recyclable materials are collected directly from households every
186
two weeks and are transported to the regional sorting centre in the City of Saguenay. Here,
187
materials are sorted and sent to different collectors according to the available markets.
188
Accepted materials are containers, printed matter, and packaging. Permitted containers for
189
municipal collection of recycling material are 360 L plastic blue bins. About 16,000 tonnes
190
of recyclables are processed per year.
191
These two municipal collection systems take place from Monday to Friday,
192
following specific routes to provide service in municipalities and boroughs through the five
193
days of the week. Fixed collection days for an area remain the same for the entire year and
194
a collection schedule is provided for each residence.
195
There is no dedicated collection of organic matter for the territory. The City of
196
Saguenay has provided its citizens four “eco-centres” located in the different districts and
197
five others are located across the territory of the FDS in the municipalities of
Saint-David-198
de-Falardeau, Saint-Félix-d'Otis, l'Anse-Saint-Jean, Saint-Honoré, and Saint-Ambroise.
199
These centres are accessible free of charge for citizens, and they are used to recover
200
materials not accepted as curbside residential waste or recycling. These materials include
201
tires, concrete and asphalt, construction materials, renovation and demolition (RDD)
202
debris, household hazardous waste (HHW), appliances, electronic devices, tree branches
203
and green waste, metals, and other waste voluntarily brought in by the citizens. In 2014,
204
37,850 t of material were recovered at the eco-centres for the City of Saguenay and 177 t
of material at eco-centres across the FDS (Ville de Saguenay et MRC du Fjord-du-206 Saguenay, 2016). 207 2.3. Sample collection 208
To properly represent the urban (City of Saguenay) and rural (FDS) areas of the territory,
209
we collected samples of RHW from six strategic sectors (three rural and three urban
210
sectors), grouping together in the same sector municipalities located close to each other
211
(Table 1). In each sector, we selected six randomly distributed addresses, giving a total of
212
36 addresses to represent the 78,381 housing units on the territory (Table 1).
213
The RAND function in Excel was used to produce random sampling. A list of all
214
the addresses of each municipality was compiled using the existing municipal database.
215
The addresses were then separated into six strategic sectors (see Table 1); the addresses for
216
each sector were on separate Excel sheets. Each address was numbered and placed in a
217
column. A second column consisted of the issued number of the RAND function that
218
generated a number between 0 and 1. The generated RAND numbers were sorted in
219
ascending order and the first six addresses in the list represented the selected samples. This
220
methodology allows residual material managers from other municipalities, having access
221
to occupational unit lists, to apply this simple random sampling protocol.
222
For each selected residence, we sent a letter to the owner to inform them of the
223
study and asked if they wished to participate in the study. In the case of a refusal, we chose
224
another address at random. However, to avoid influencing the consumption habits and
225
altering waste disposal, no collection period was specified in the letter. The owner was
226
advised that sampling would occur at the residence six times during the year (2014).
To decrease the heterogeneity related to seasonal variations, we staggered sampling
228
over a one-month period during three seasons (winter, summer, and fall). Each selected
229
month was representative of the season. As the frequency of municipal collection of RHW
230
is every two weeks for the greater part of the year, each sampling event covered a period
231
of two weeks repeated twice during the month.
232
Following the recommendations of Abu Qdais et al. (1997) and Dahlén and
233
Lagerkvist (2008), we collected RHW samples directly from the residences. We recovered
234
the complete contents of the garbage bin placed at the edge of the street as scheduled for
235
municipal collection. In the case where the selected address was a multi-family dwelling,
236
we collected three plastic garbage bags at random from the container as the representative
237
sample.
238
2.3.1. Separation of the constituents
239
The collection of each sample was carried out early in the morning by a sorting team,
240
composed of four volunteers, prior to the passage of the collection truck picking up RHW
241
at the curb side. Bins were then transported to a triage yard where the contents of each
242
garbage bin were transferred to a container identified to the corresponding sample, then
243
each sample was weighed using a balance. This was then the initial weight of the sample.
244
Sample material was brought inside to a closed building. The materials were
245
therefore not subjected to the weather during the period between collection and separation
246
of the materials. Material was not sieved but was sorted by hand or with small tools. The
247
tools used for manual sorting consisted of: 1) a sorting table with an outline of a height of
248
about 10 cm, with an open end and funnel-shaped to slide the materials into the containers;
249
2) containers of different capacities to collect and weigh the various separated materials—
materials were weighed using electronic scales having a precision of ± 0.01 kg; 3) safety
251
equipment (e.g. a "Biohazard" box for the recovery of needles and syringes, a first aid kit,
252
disinfectants); and 4) personal protective equipment. Health and safety precautions were
253
adopted for all persons responsible for separating waste. This included vaccinations, the
254
wearing of personal protective equipment (disposable Tyvek coveralls, anti-needle/anti-cut
255
waterproof gloves, slip-resistant boots, breathing masks, safety glasses). The volunteers,
256
who always repeated the same task for all samples, separated the waste material into
257
distinct categories and transferred the respective fractions into identified containers of
258
known weight. They recorded the total weight of each sample and the weight of each
259
(sub)category. This separation of the constituents was undertaken the same day as the
260
collection to avoid physical and chemical changes due to degradation and decomposition.
261
Although the garbage was sorted and weighed on the same day as the collection of the
262
samples, for some samples, the garbage had already been stored for up to two weeks in the
263
collection container prior to collection. Given our harsh winters, this garbage was frozen
264
at the time of sorting. Thus, for several samples the segregation of materials occurred
265
before they were fully thawed.
266
We chose to separate the contents at two levels (a category and a subcategory level).
267
The idea behind this approach was to have a classification system that was easy to use and
268
that minimized any subjective interpretation. As such, we sorted samples into nine
269
categories for the first level of sorting and 39 subcategories at a secondary level (Table 2).
270
The nine selected categories are those commonly found in the reports of the Quebec
271
authorities (i.e. RQEEQ). The category ‘other’ represented the fraction of the materials that
272
could not be classified into other named categories. For example, this included samples
containing communication and information technology (CIT) waste, electrical wires,
274
rubber, lightbulbs, and liquids. The categories of bulky items and renovation/demolition
275
debris, household hazardous waste, and ‘other’ also contained a subcategory named
276
‘other’, to classify contents that did not fit into any of the subcategories.
277
2.4. Statistical analyses
278
The weight percentage of each category was calculated using equation 1.
279 280
𝑊𝑒𝑖𝑔ℎ𝑡 𝑝𝑒𝑟𝑐𝑒𝑛𝑡𝑎𝑔𝑒 (%) = ( )
( ) × 100 (1) 281
Normality and homogeneity were verified before any statistical analyses. The homogeneity
282
of the variance was tested using Levene’s test, whereas the normality was verified
283
graphically (before and after transformation) with the Explore procedure in SPSS (SPSS
284
version 23; IBM Corp., 2015). Three types of transformations were used to improve data
285
normality (square, square root, and log) (Quinn & Keough 2001) to:
286
Ensure the data and the model errors had a more normal distribution
287
Reduce any relationship between the mean and the variance
288
Reduce the influence of outliers
289
Improve linearity in regression analysis
290
The applied transformations were square root for plastic and fiber, square for organic
291
matter, and log for glass, metals, bulky items, RDD, textiles, HHW, and ‘other’.
292
We performed an analysis of variance with the transformed variables using a
293
general mixed linear model (SPSS version 23; IBM Corp., 2015) where the fixed factors
294
were sampling period (winter, summer, and fall) and location (City of Saguenay (urban)
and the MRC of Fjord-du-Saguenay (FDS – rural)) (Gbur et al. 2012). The random factor
296
was the sectors (three rural and three urban sectors).
297
3. Results and discussion
298
3.1. Number of samples
299
The number of samples collected by period and by location varied greatly. A total of 138
300
samples of a possible 216 samples was collected (36 households sampled twice during each
301
of three seasons). The missing samples were primarily due to there being no garbage bins
302
placed at the side of the road at the time of sampling from the selected address. Our 64%
303
sample capture was much less than the 86% obtained for the 2010 RQEEQ survey
304
(RQEEQ, 2014). Several reasons may explain these missing samples: i) there was not
305
enough waste generated during the period of collection; ii) the residents were absent; (iii)
306
RHW was placed along the street after we had passed by; and (iv) for other unknown
307
reasons. Directly informing the citizens of sample collection dates would certainly have
308
helped reduced the number of missing samples. However, this may have had a potential
309
effect on the resident’s behaviour, and therefore, would introduce a bias toward the
310
measured variables.
311
We recovered a total of 3,039 kg of RHW and sorted this residual material into
312
different categories. Seasonally, 936 kg, 865 kg, and 1,238 kg were collected in the winter,
313
summer, and fall, respectively. Of the total amount of RHW, 1,732 kg was collected from
314
the Saguenay and 1,307 kg from the FDS (Table 1).
315
To reduce experimental error, the number of samples could be increased. However,
316
the number of samples required to ensure a statistical meaning varies for each category of
317
material. Categories representing a small proportion of the waste require many samples to
obtain a satisfactory level of statistical significance (Zeng et al., 2005; Dahlén and
319
Lagerkvist, 2008). Zeng et al. (2005) suggested that if the size of the sample is greater than
320
100 kg, a minimum of 10 samples is required. However, this estimate of a 100 kg sample
321
refers to samples taken from garbage trucks or directly from landfill sites. In our study, it
322
was virtually impossible to obtain 90 kg samples as they were taken directly from
323
households; the average weight of a sample was 21 kg. (The average weight of the samples
324
collected at the residence was approximately 15 kg elsewhere in Quebec (RQEEQ, 2015)).
325
Furthermore, it is often financial resources and manpower that dictate the number of
326
collected samples (Abu Qdais et al., 1997).
327
Based on previous work, such as Sharma and McBean (2007), we determined that
328
six replicates were sufficient to calculate analysis of variance. As we used sectors (La Baie,
329
Chicoutimi, Jonquière, etc.) as the random factors in our model, we ended up with 36
330
replicates.
331
3.2. Composition of residual household waste
332
Analysis of variance showed that the weight percentage of each category of material was
333
not significantly different among sampling periods nor location except for organic matter
334
(α < 0.05) (Table 3). Therefore, except for organic matter, the results for a category were
335
compiled to generate a single value for calculating the relative abundance of each type of
336
residual material.
337
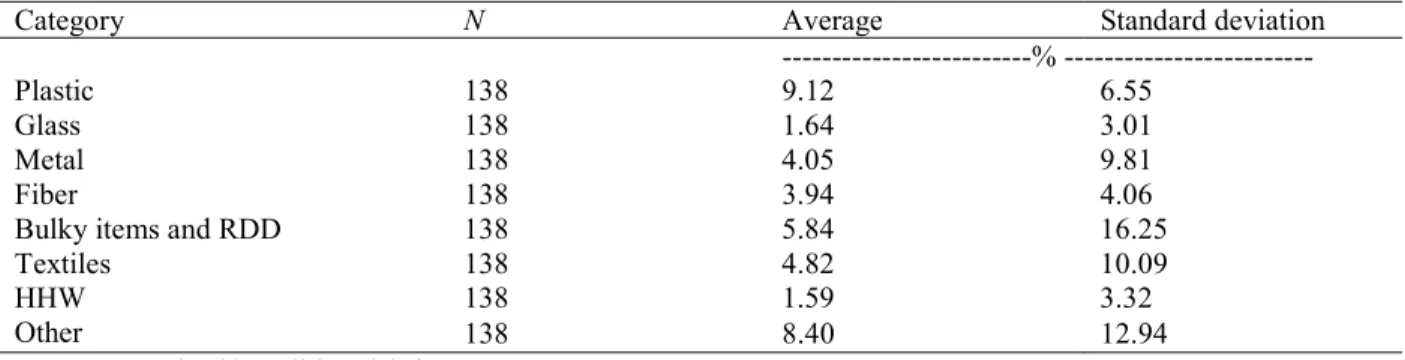
Table 4 presents the weight percentage of each type of material found in the RHW
338
of the Saguenay region (City of Saguenay vs FDS) over the combined sampling seasons.
339
Overall, in terms of total RHW, plastic represented 9%, other 8%, bulky items and RDD
340
6%, textiles 5%, metals 4%, paper and cardboard (fiber) 4%, glass 2%, and HHW 3%.
Our results for the categories mirror those of the RQEEQ (2015) study for the
342
province of Quebec. Our results had a lower percentage of fiber, glass, and metal than
343
studies conducted elsewhere (Table 5; Aguilar-Virgen et al., 2013; RQEEQ, 2015; 2014;
344
2007; Gidarakos et al. 2006; Bernache-Pérez et al., 2001, Otten, 2001, Abu Qdais et al.,
345
1997), likely because Quebec has a good system for the collection and processing of
346
recyclable materials.
347
The common use of wood stoves in the region could explain why only 4% of fiber
348
material was found in the garbage compared to 19% in the provincial survey; the fibers
349
being used to start the fire of wood stoves.
350
Each year in Quebec, more than a million tonnes of residual material are recovered
351
by the different sorting centres. For our study area, a little more than 16,000 tonnes of
352
materials are recycled each year (Ville de Saguenay et MRC du Fjord-du-Saguenay, 2016).
353
Although the system of recovery and recycling of residual materials is well established
354
across the Saguenay territory, a greater weight percentage of plastic remains in the RHW.
355
Indeed, as we did not separate food remaining in the packaging (plastic, glass, or metal),
356
this may have biased the weight of categories including those of plastic, glass, metal,
357
organic matter, and other. However, there is very little published information estimating
358
the proportion of food found in packaging. Lebersorger and Schneider (2011) concluded
359
that packaged food waste should not be separated from its packaging and should be
360
included in the food waste category.
361
Furthermore, even if the collection of recyclable materials in the municipalities has
362
relatively good yields, a considerable recyclable fraction remains in RHW (Velis et al.,
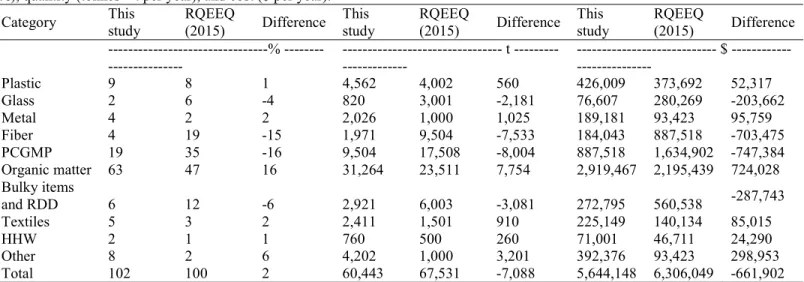
363
2010). We estimated that 19% of the RHW consisted of paper, cardboard, glass, metal, and
plastic (PCGMP) (Table 6). This represents 9,500 t of recyclable materials (19% × 50,023
365
t) that are still directed to a landfill. In financial terms, this represents a cost of more than
366
$887,500 CDN ($93.38 per tonne for landfill costs, Services Matrec Inc., personal
367
communication) to the city and FDS. Our results underestimate the province-wide results
368
of the RQEEQ (2015) studythat estimated more than 35% (17,500 t) of PCGMP was
369
destined for the landfill in the Saguenay at a cost of $1,634,000 CDN. This difference also
370
confirms the benefit of characterizing RHW at a local level given the provincial and local
371
level difference of 16% for PCGMP (Table 6).
372
The ‘other’ category also represents a significant percentage of RHW (8%). This
373
category includes residual material that could not be classified into another category.
374
Although there are many places for recycling CIT, we found these devices in our samples,
375
as well as electrical wires and electronic, rubber, and bulbs. In addition, a subcategory was
376
added during the process of segregation as more than 65 of the 216 study addresses
377
contained disposable coffee pods (e.g. Keurig coffee®). In fact, a marked quantity of coffee 378
pods was recorded in the ‘other’ category. Of the total 3,039 kg of RHW collected, coffee
379
pods accounted for 20 kg, representing 0.7%. These pods therefore represent new waste
380
heading to landfills avoiding the recycling and composting streams of recovery. Compared
381
to RQEEQ (2015), our study has a higher percentage of ‘other’, which represents a
382
difference of 3,201 t heading to the landfill at a cost of ca. $299,000 CDN (Table 6).
383
There is great variability among studies characterizing waste (Aguilar-Virgen et al.,
384
2013; RQEEQ 2015, 2014, 2007; Gidarakos et al., 2006; Zeng et al., 2005; Bernache-Pérez
385
et al., 2001; Abu Qdais et al., 1997) as municipalities do not offer identical waste
386
management services. Some municipalities offer the collection of recyclable material
and/or organic materials, others favour the use of voluntary drop off sites for recycling and
388
compost material, while the actual accepted materials for recycling differs from one place
389
to the other. Some regions have specific recovery programs for certain materials (as is the
390
case in Quebec), whereas in some developing countries, bin looters are authorized in
391
landfills, and as such, the local municipality does not offer specific collection. Hence, the
392
characterization of RHW at the local level becomes a priority (Zeng et al., 2005).
393 394
3.2.1 Organic matter
395
Significant differences were found between the seasons (α = 0.046) and sampled MRCs (α
396
= 0.012) for organic matter (Table 3). The a posteriori least significant difference (LSD)
397
test of the significant differences between sampling periods showed that the percentage of
398
organic matter was significantly higher during autumn (average of 65.5%) than summer
399
(average of 52.9%) (Table 7). However, the percentage of organic matter collected in the
400
RHW during the winter (average of 61.1%) was not significantly different from the other
401
two periods. As with this study, previous work has shown that the organic fraction
402
comprises the majority fraction of residential waste (Aguilar-Virgen et al., 2013; RQEEQ,
403
2015; 2014; 2007; Gidarakos et al., 2006; Bernache-Pérez et al., 2001, Otten, 2001, Abu
404
Qdais et al., 1997).
405
Organic matter was significantly (α = 0.05) higher in RHW from the sectors of the
406
City of Saguenay (average of 63.6%) compared to the sectors of the FDS (average of
407
56.0%) (Tables 3 and 8). The overall percentage average organic matter of the two MRCs
408
was calculated with equation 2:
409
𝑥̅ = (% ) (% ) (2)
411
where 𝑥̅ is the overall average, %𝑂𝑀 is the organic matter content (in %) for RHW
412
recovered in the City of Saguenay, 𝑇𝑤𝑎𝑠𝑡𝑒 is the quantity (tonnes) of waste collected
413
in 2014 for the City of Saguenay, %𝑂𝑀 is the organic matter content (in %) for RHW
414
of the Fjord-du-Saguenay, 𝑇𝑤𝑎𝑠𝑡𝑒 is the quantity of total waste collected in 2014 for
415
the MRC Fjord-du-Saguenay and 𝑇𝑤𝑎𝑠𝑡𝑒 is the total quantity (City and FDS) of waste
416 collected in 2014. 417 𝑥̅ = (63.62% 𝑥 42,696 𝑡) + (56.02% 𝑥 7,327 𝑡) 50,023 𝑡 418 419
The overall combined average (𝑥̅) was 62.5% organic matter.
420
Significant differences in the amounts of organic matter across seasons and
421
locations can be explained in part by more leaves and green residues being sent to the
422
RHW during the fall. Indeed, the quantity of these materials in the RHW during the fall is
423
greater for urban dwellers compared to that of the FDS, with leaves and green residues
424
accounting for 185 kg (of 469 kg total organic matter) for the city and 56 kg (of 345 kg
425
total organic matter) for the FDS (data not shown). As residential lots in the FDS are larger,
426
the composting of leaves and green residues is likely one of the reasons that could explain
427
the lower organic matter values for FDS. Given this data, city waste management planners
428
could target a door-to-door collection of leaves and green residues in the fall to divert these
429
items away from the landfill.
430
The provincial waste management policy aims to ban residential organic matter
431
from landfills by 2020. Many municipalities in Quebec already offer the collection,
transport, and disposal of organic material. The City of Saguenay and FDS are undertaking
433
studies to select the technology for the treatment of organic matter that is best suited to the
434
local situation. Characterizing the nature of the organic material to be processed is essential
435
for selecting the appropriate technology. In the case of the Saguenay, the city is relying on
436
the provincial data of RQEEQ (2015). However, there is a 16% difference between the
437
provincial and local data (Table 6). At the provincial level, organic matter makes up 47%
438
of residential waste compared to 63% for the Saguenay. This represents an annual
439
difference of 8,000 t of organic matter (23,510 t for the provincial estimate versus 31,500
440
t from this study). Based on the operational costs of several organic matter treatment
441
facilities, Provost and Laplante (2013) estimated a cost of $76.00 per tonne of organic
442
materials for composting. As such, use of the provincial survey would underestimate
443
composting costs in the Saguenay by more than $600,000 per year.
444
Some data, such as the quantities of RHW collected and household participation
445
rates, are available from the waste management plans of municipalities already collecting
446
household organic matter (Table 9). For comparison purposes, we selected the City of
447
Sherbrooke, a city in southern Quebec having a similar population as the City of Saguenay.
448
If we consider that 63% of residential waste brought to the landfill in Sherbrooke (30,259
449
t) is organic matter and that 61% of this amount is diverted by the collection of organic
450
matter, this leads to 11,629 t of organic matter being composted (Ville de Sherbrooke,
451
2016). This estimate differs by only 859 t using this study as opposed to a difference of
452
8,675 t using the provincial data from 2012–2013 (RQEEQ, 2015). Our estimates of the
453
quantities of organic matter are also more representative than the data from RQEEQ
454
(2015).
456
5. Conclusion
457
This study is a first of its kind for Quebec and represents an essential first step in the
458
development of waste management and reduction strategies for the Saguenay region.
459
Sampling directly from residences allowed us to determine that organic matter constitutes
460
much of the RHW (66% and 53%) for residents of the rural FDS municipality and the
461
urban City of Saguenay, respectively. This was followed by plastic (9%), bulky items and
462
RDD (6%), textiles (5%), metal (4%), paper and cardboard fiber (4%), glass (2%), and
463
HHW (3%). These results are representative across the entire territory as this
464
characterization was carried out locally on a territory where all municipal waste collection
465
systems are the same and where the contents arrive at the same landfill sites.
466
As each regional municipality is responsible for the planning and the management
467
of waste on its territory, the proposed approach showed that it is possible for residual
468
material managers to identify the composition of their deposits using easily accessible,
469
relatively simple tools. The characterization of RHW at the local level permits: 1)
470
establishing a database of the characteristics of residential waste over the course of the
471
year; 2) building a basis for assessing the performance of waste management systems; 3)
472
noting the emergence of new forms of waste; 4) observing the impact of seasonal
473
variability on the physical characteristics of waste; 5) offering adapted and appropriate
474
services for specific waste forms and the different territories; 6) estimating of the mass of
475
organic material needing collection and treatment, selecting the appropriate technologies
476
for organic matter treatment, and determining the seasonality of inputs that enter the
477
organic material processing system; 8) being aware of the economic impact of 4-R
materials that are still landfilled; 8) provide information, awareness, and education adapted
479
to specific identified residual materials; and 9) addressing provincial-level (and other levels
480
of government) requirements and action plan objectives in terms of waste management and
481
waste reduction.
482
Acknowledgements
483
This study was funded by the City of Saguenay. The authors wish to acknowledge the
484
support of the elected representatives and members of the municipal administrations of
485
City of Saguenay and the MRC of Fjord-du-Saguenay, members of the Commission for
486
the environment and sustainable development of the City of Saguenay, Eurêko! who
487
carried out the characterization of RHW in the field, our managers at Sustainable
488
Development and Environmental Services, and the citizens who permitted collection of
489
their RHW as part of this study.
References
491
Abu Qdais, M.F. Hamoda, J. Newham. 1997. Analysis of residential solid waste at
492
generation sites. Waste Management and Research, 15: 395–406.
493 494
Aguilar-Virgen, Q., P. Taboada-González, S. Ojada-Benítez. 2013. Seasonal analysis of
495
the generation and composition of solid waste: potential use – a case study.
496
Environmental Monitoring and Assessment, 185: 4633–4645.
497 498
Bernache-Pérez, G., S. Sànchez-Colòn, A.M. Garmendia, A. Dàvila-Villarreal, M.E.
499
Sànchez-Salazar. 2001. Solid waste characterisation study in the Guadalajara
500
Metropolitan Zone, Mexico. Waste Management and Research, 19: 413–424.
501 502
Brunner, P.H., W.R. Ernst. 1986. Alternative methods for the analysis of municipal solid
503
waste. Waste Management and Research, 9: 495–509.
504 505
Chang, N.-B., E. Davila. 2008. Municipal solid waste characterization and management
506
strategies for the Lower Rio Grande Valley, Texas. Waste Management, 28: 776–794.
507 508
Dahlén, L., A. Langerkvist. 2010. Evaluation of recycling programmes in household
509
waste collection systems. Waste Management and Research, 28: 577–586.
510 511
Dahlén, L., A. Lagerkvist. 2008. Methods for household waste composition studies.
512
Waste Management, 28: 110–1112.
514
Dahlén, L., H. Berg, A. Lagerkvist, P.E.O. Berg. 2009. Inconsistent pathways of
515
household waste. Waste Management, 29: 1798–1806.
516 517
Edjabou, M.E., M.B. Jensen, R. Götze, K. Pivnenko, C. Petersen, C. Scheutz, T.F.
518
Astrup. 2015. Municipal solid waste composition: sampling methodology, statistical
519
analyses, and case study evaluation. Waste Management, 36: 12–23.
520 521
Éco Entreprises Québec et Recyc-Québec. 2014. Caractérisation des matières résiduelles
522
du secteur résidentiel 2010, Rapport synthèse. 46 p.
523 524
Environment and Climate Change Canada. 2015. Canadian Climate Normals 1981-2010
525
Station Data - Climate: Station Data for Bagotville A.
526
http://climat.meteo.gc.ca/climate_normals/index_e.html. [Last accessed Sept 11, 2017].
527 528
Environment Quality Act. 2017. Quebec residual materials management policy. Chapter
529
Q-2, r. 35.1.
530 531
Gidarakos, E., G. Havas, P. Ntzamilis. 2006. Municipal solid waste composition
532
determination supporting the integrated solid waste management system in the island of
533
Crete. Waste Management, 26: 668–679.
534 535
Gbur, E.E., W.W. Stroup, K.S. McCarter, S. Durham, L.J. Young, M. Christman, M.
536
West, M. Kramer. 2012. Analysis of generalized linear mixed models in the agriculture
537
and natural resources sciences. American Society of Agronomy, Soil Science Society of
538
America, Crop Science Society of America, Madison, Wisconsin. 283 p.
539 540
IBM Corp. 2015. IBM SPSS Statistics for Windows, Version 22.0. Released 2015.
541
Armonk, NY, IBM Corp.
542 543
Lebersorger, S., F. Schneider. 2011. Discussion on the methodology for determining food
544
waste in household waste composition studies. Waste Management, 31: 1924–1933.
545 546
Maystre, L.Y., F. Viret. 1995. A goal-oriented characterization of urban waste. Waste
547
Management and Reseach, 13:207–2018.
548 549
Ojeda-Benίtez, S., C. Armijo-de Vega, M.Y. Marquez-Montenegro. 2008. Household
550
solid waste characterization by family socioeconomic profile as unit of analysis.
551
Resources, Conservation and Recycling, 52: 992–999.
552 553
Otten, L. 2001. Wet-dry composting of organic municipal solid waste: current status in
554
Canada. Canadian Journal of Civil Engineering, 28(S1): 124–131.
555 556
Parfitt, J., R. Flowerdew. 1997. Methodological problems in the generation of household
557
waste statistics. Applied Geography, 17: 231–244.
559
Pattnaik S., M. Vikram Reddy. 2010. Assessment of municipal solid waste management
560
in Puducherry (Pondicherrt), India. Resources, Conservation and Recycling, 54: 512–520.
561 562
Petersen, C.M., P.E.O. Berg, L. Rönnegard. 2005. Quality control of waste to
563
incineration – waste composition analysis in Lidköping, Sweden. Waste Management &
564
Research, 23: 527–533.
565 566
Provost, C., R. Laplante. 2013. Du flou dans les calculs, de l’eau dans le gaz. Note de
567
recherche. L’institut de recherche en économie contemporain. 33 p.
568 569
Qu, X.Y., L. Zhen-shan, X. Xin-yuan, S. Yu-mei, L. Yang, C. You. 2009. Survey of
570
composition and generation rate of household wastes in Beijing, China. Waste
571
Management, 29: 2618–2624.
572
Quebec Institute of Statistics. 2017. Statistical profiles by region and geographical RCM:
573
02 - Saguenay-Lac-Saint-Jean and its regional county municipalities (RCMs).
574 http://www.stat.gouv.qc.ca/statistiques/profils/region_02/region_02_00_an.htm. [Last 575 accessed Sept 11, 2017]. 576 577
Quinn, G.P., M.J. Keough. 2001. Experimental design and data analysis for biologists.
578
Cambridge University Press, Cambridge, United Kingdom.
579 580
Recyc-Québec et Éco Entreprises Québec. 2015. Caractérisation des matières résiduelles
581
du secteur résidentiel 2012-2013, rapport synthèse. 43 p.
582 583
Recyc-Québec et Éco Entreprises Québec. 2007. Caractérisation des matières résiduelles
584
du secteur résidentiel 2006-2007, rapport synthèse. 28 p.
585 586
Sakai, S., S.E. Sawell, A.J. Chandler, T.T. Eighmy, D.S. Kosson, J. Vehlow, H.A. van
587
der Sloot, J. Hartlén, O. Hjelmar. 1996. World trends in municipal solid waste
588
management. Waste Management, 16: 341–350.
589 590
Sharholy, M., K. Ahmad, R.C. Vaishya, R.D. Gupta. 2007. Municipal solid waste
591
characteristics and management in Allahabad, India. Waste Management, 27: 490–496.
592 593
Sharma, M., E. McBean. 2007. A methodology for solid waste characterization based on
594
diminishing marginal returns. Waste Management, 27: 337–344.
595 596
Thitame, S.N., G.M. Pondhe, D.C. Meshram. 2010. Characterisation and composition of
597
Municipal Solid Waste (MSW) generated in Sangamner City, District Ahmednagar,
598
Maharashtra, India. Environmental Monitoring and Assessment, 170: 1–5.
599 600
Velis, C.A., P.J. Longhurst, G.H. Drew, R. Smith, S.J.T. Pollard. 2010. Production and
601
quality assurance of solid recovered fuels using mechanical—biological treatment (MBT)
of waste: a comprehensive assessment. Critical Reviews in Environmental Science and
603
Technology, 40 (12): 979–1105.
604 605
Ville de Saguenay et MRC du Fjord-du-Saguenay. 2016. Plan de gestion des matières
606
résiduelles, Révisé 2016-2020.194 p. https://www.recyc-607
quebec.gouv.qc.ca/sites/default/files/documents/mrcdufjord-du-saguenay-pgmr-2016.pdf 608
609
Ville de Sherbrooke. 2016. Plan de gestion des matières résiduelles 2016-2020, 111 p.
610 https://www.ville.sherbrooke.qc.ca/sous-site/environnement/collectes-et-ecocentres/plan-611 de-gestion-des-matieres-residuelles-2016-2020/pgmr-2016-2020/ 612 613
Zeng, Y., K.M. Trauth, R.L. Peyton, S.K. Banerji. 2005. Characterization of solid waste
614
disposed at Columbia Sanitary Landfill in Missouri. Waste Management Resources, 23:
615
62–71.
Table 1. Description of sampling locations. MRCs Sectors Number of households Number of households selected for sampling Sampling periods Total mass of waste sampled (kg) City of Saguenay (urban) 1 Jonquière Shipshaw Lac-Kénogami 30,351 6 Winter 244 Summer 224 Fall 375 2 Chicoutimi Canton-Tremblay Laterrière 30,246 6 Winter 191 Summer 203 Fall 100 3 La Baie 10,002 6 Winter 59 Summer 175 Fall 164 MRC-Fjord-du-Saguenay (rural) 4 Bégin Larouche Saint-Ambroise St-Charles de Bourget 2,378 6 Winter 191 Summer 109 Fall 216 5 St-Fulgence St-Honoré St-David-de-Falardeau Sainte-Rose 3,826 6 Winter 114 Summer 88 Fall 171 6 L’Anse-St-Jean Petit-Saguenay Ferland-et-Boileau Rivière-Éternité St-Félix-d’Otis 1,578 6 Winter 138 Summer 66 Fall 212
Table 2. Categories and subcategories of materials separated from the collected waste.
Categories Subcategories
Paper and cardboard fiber White paper
Brown paper
Cardboard (broken down) Cardboard (not broken down) Waxed paper
Tetra Pak
Glass Non-refundable glass
Refundable glass
Metal Non-refundable metal
Refundable metal Industrial metal
Plastic Non-refundable plastic
Refundable plastic
Non-recyclable plastic (e.g. bags, packaging) Plastic No. 6
Plastic packaging - cellophane type Plastic packaging - other than cellophane Plastic ties
Organic matter Table scraps
Leaves and/or green residues
Cleaning fibers (paper towels, paper handkerchiefs) Diapers and sanitary fibers
Bulky items and renovation/demolition debris (RDD) Raw wood
Painted/varnished wood
Treated wood (creosote, metal salts) Contaminated wood (nails, gypsum, etc.) Agglomerated/pressed wood
Other CRD waste
Textiles Textiles (reusable clothing)
Textiles (rags)
Household hazardous waste (HHW) Batteries
Other
Other Communication and information technology (CIT)
Electrical wires and electronics Rubber
Light bulbs Coffee pods Liquids Other waste
Table 3. Results of the analysis of the variance for each waste category. Significant F-values are in bold and the related probabilities are in parentheses.
Factors Degree of freedom Plastic Glass Metal Fiber Organic matter Bulky items and RDD Textiles HHW Other
---F-value ---
Period1 2 0.9 (0.405) 0.2 (0.854) 0.1 (0.935) 1.0 (0.359) 3.2 (0.046) 0.9 (0.393) 0.6 (0.528) 0.2 (0.805) 0.6 (0.581)
MRC2 1 3.8 (0.054) 1.5 (0.223) 0.0 (0.887) 0.3 (0.613) 6.5 (0.012) 0.8 (0.373) 0.1 (0.721) 2.7 (0.102) 2.8 (0.099)
Period ×
MRC 2 1.3 (0.285) 0.8 (0.450) 0.2 (0.808) 0.2 (0.827) 0.1 (0.933) 1.8 (0.168) 0.1 (0.902) 1.0 (0.369) 0.1 (0.895)
1Three sampling periods were: winter, summer, and fall;
2MRCs: City of Saguenay and MRC of Fjord-du-Saguenay (FDS);
RDD: Renovation/demolition debris; HHW: Household hazardous waste.
Table 4. Descriptive statistics for the categories of materials found in residential waste in the Saguenay region (organic matter being excluded).
Category N Average Standard deviation
---% ---
Plastic 138 9.12 6.55
Glass 138 1.64 3.01
Metal 138 4.05 9.81
Fiber 138 3.94 4.06
Bulky items and RDD 138 5.84 16.25
Textiles 138 4.82 10.09
HHW 138 1.59 3.32
Other 138 8.40 12.94
RDD: Renovation/demolition debris; HHW: Household hazardous waste.
Table 5. Composition of residual household waste (%) and waste generation rates according to different studies. This study Aguilar-Virgen et
al. (2013)
RQEEQ
(2015) RQEEQ (2014) RQEEQ (2007) Qu et al. (2009)
Gidarakos et al. (2006) Zeng et al. (2005) Bernache-Pérez et al. (2001) Abu Qdais et al. (1997)
Location Saguenay (Canada) City of Ensenada
(Mexico) Province of Quebec (Canada) Province of Quebec (Canada) Province of Quebec (Canada) Beijing (China) Island of Crete (Greece) Cities of Centralia, (Columbia ) and Mexico City (Mexico) Metropolitan Area Guadalajara, (Mexico) City of Abu Dhabi (United Arab Emirates) Population 167,775 311,554 8,084,754 7,870,000 7,631,873 15,810,000 431,755 Sampling method RHW collected from the residents RHW collected from collection trucks Subsample of RHW collected directly from a collection of five housing units Subsample of RHW collected directly from a collection of five housing units Subsample of RHW collected directly from a collection of five housing units RHW collected from the residents RHW collected from collection trucks RHW collected at the landfill RHW collected from the residents and at four landfills RHW collected from the residents Number of samples 138 29 113 536 840 Amount of RHW separated (kg sample-1) 21 90 16 40 91 to 136 140 14 Composition of RHW (%) Plastic 9 12 8 7 8 17 16 9 12 Glass 2 4 6 3 4 5 3 4 9 Metal 4 3 2 2 3 5 6 2 8 Paper and Fibers 4 22 19 9 13 20 41 11 6 Organic matter 53 - 66 40 47 59 59 39 21 53 49 Bulky items and RDD 6 2 12 12 8 3 Textiles 5 6 3 3 3 5 HHW 2 1 Other 8 7 2 3 2 6 13 22 16
To ensure the uniformity of the categories and thus obtain a comparison, some categories have been grouped among the studies; RQEEQ: Recyc-Québec and Eco Entreprises Québec;
RHW: Residual household waste; RDD: Renovation/demolition debris;
Table 6. Comparison of the categories of collected materials between this study and the RQEEQ (2015) study in terms of percentage (%), quantity (tonnes – t per year), and cost ($ per year).
Category This study RQEEQ (2015) Difference This study RQEEQ (2015) Difference This study RQEEQ (2015) Difference
% --- --- t --- --- $ --- Plastic 9 8 1 4,562 4,002 560 426,009 373,692 52,317 Glass 2 6 -4 820 3,001 -2,181 76,607 280,269 -203,662 Metal 4 2 2 2,026 1,000 1,025 189,181 93,423 95,759 Fiber 4 19 -15 1,971 9,504 -7,533 184,043 887,518 -703,475 PCGMP 19 35 -16 9,504 17,508 -8,004 887,518 1,634,902 -747,384 Organic matter 63 47 16 31,264 23,511 7,754 2,919,467 2,195,439 724,028 Bulky items and RDD 6 12 -6 2,921 6,003 -3,081 272,795 560,538 -287,743 Textiles 5 3 2 2,411 1,501 910 225,149 140,134 85,015 HHW 2 1 1 760 500 260 71,001 46,711 24,290 Other 8 2 6 4,202 1,000 3,201 392,376 93,423 298,953 Total 102 100 2 60,443 67,531 -7,088 5,644,148 6,306,049 -661,902
Total quantity of ultimate residues landfilled in 2014: 42,696 t (City of Saguenay), 7,327 t (MRC Fjord-du-Saguenay (FDS)) and 50,023 t (City and FDS);
In 2014, the estimated cost of burial was $93.38 t-1 of residual material (Services Matrec Inc., personal communication); All amounts
are in $CDN;
RQEEQ: Recyc-Québec and Eco Entreprises Québec; PCGMP: Paper, cardboard, glass, metal, and plastic; RDD: Renovation/demolition debris;
Table 7. Proportion of organic matter as a function of the sampling period.
Season N Average1 Standard deviation
---% --- Organic matter
Winter 42 61.06 ab 2.27
Summer 48 52.86 a 3.15
Fall 48 65.54 b 3.05
1Averages not sharing the same letters are statistically different from each other according to a posteriori LSD tests
Table 8. Proportion of organic matter measured as a function of the location (MRC).
MRC N Average1 Standard deviation
---% ---
Organic matter City of Saguenay
(urban) 77 63.62 a 2.43
MRC
Fjord-du-Saguenay (rural) 61 56.02 b 2.72
1Averages not sharing the same letters are statistically different from each other according to a posteriori LSD tests
Table 9. Comparison of the quantities of organic matter (OM) recovered by different Quebec municipalities having a collection specifically for organic material (2014 data), this study, and data from RQEEQ (2015).
Population Households served
Quantity of landfilled residual material Quantity of OM retrieved
Capture rate for the collection of
OM (%) This study Difference
RQEEQ (2015) Difference --- t --- --- t --- City of Gatineau 273,905 92,336 60,624 21,619 56 21,388 231 15,956 5,663 City of Sherbrooke 159,448 44,391 30,259 10,770 61 11,629 -859 8,675 2,095 Intermunicipalities of Acton and Maskoutains 99,814 33,327 23,951 10,038 65 9,808 230 7,317 2,721 MRC Montcalm 51,163 15,516 16,857 2,840 39 4,142 -1,302 3,090 -250
OM: Organic matter;