Science Arts & Métiers (SAM)
is an open access repository that collects the work of Arts et Métiers Institute of Technology researchers and makes it freely available over the web where possible.
This is an author-deposited version published in: https://sam.ensam.eu Handle ID: .http://hdl.handle.net/10985/19983
This document is available under CC BY license
To cite this version :
Marine SCIUS-BERTRAND, Laurent VIDEAU, Alexandre RONDEPIERRE, Emilien LESCOUTE, Yann ROUCHAUSSE, Jan KAUFMAN, Danijela ROSTOHAR, Jan BRAJER, Laurent BERTHE -Laser induced plasma characterization in direct and water confined regimes: new advances in experimental studies and numerical modelling - Journal of Physics D: Applied Physics - Vol. 54, n°5, p.1-14 - 2021
Any correspondence concerning this service should be sent to the repository Administrator : [email protected]
Laser induced plasma characterization
in direct and water confined regimes:
new advances in experimental studies
and numerical modelling
Marine Scius-Bertrand1,2, Laurent Videau1,3, Alexandre Rondepierre2,4,
Emilien Lescoute1,3, Yann Rouchausse2, Jan Kaufman5, Danijela Rostohar5, Jan Brajer5 and Laurent Berthe2
1CEA, DAM, DIF, 91297 Arpajon, France
2Arts et M´etiers Institute of Technology, CNRS, CNAM, PIMM, HESAM Universit´e, Paris 75013, France 3CEA, Laboratoire Mati`ere sous Conditions Extrˆemes, Universit´e Paris-Saclay, Bruy`eres-le-Chˆatel 91680, France
4THALES LAS France, 78990 Elancourt, France
5HiLASE Centre, Institute of Physics of the Czech Academy of Sciences, Za Radnici 828 252 41 Dolni Brezanye, Czech Republic
E-mail:[email protected]@ensam.eu
Abstract
Optimization of the laser shock peening (LSP) and LASer Adhesion Test (LASAT) processes requires control of the laser-induced target’s loading. Improvements to optical and laser
technologies allow plasma characterization to be performed with greater precision than 20 years ago. Consequently, the processes involved during laser–matter interactions can be better understood. For the purposes of this paper, a self-consistent model of plasma pressure versus time is required. The current approach is called the inverse method, since it is adjusted until the simulated free surface velocity (FSV) corresponds to the experimental velocity. Thus, it is not possible to predict the behavior of the target under shock without having done the experiments. For the first time, experimental data collected in different labs with the most up-to-date laser parameters are used to validate a self-consistent model for temporal pressure-profile calculation. In addition, the parameters characterizing the plasma (temperature, thickness and duration) are obtained from the ESTHER numerical code, together with the amount of ablated matter. Finally, analytic fits are presented that can reproduce any pressure–temporal profiles in the following domains of validity: intensities, I, ranging from 10 to 500 GW cm−2and pulse durations, Tpul,
between 5 and 40 ns for the direct-illumination regime at 1053 nm, I ranging from 1 to 6 GW cm−2and Tpulbetween 10 to 40 ns in the water-confined regime at 1053 nm, and I from
1 to 10 GW cm−2and Tpulbetween 7 and 20 ns in the water-confined regime at 532 nm. These
temporal pressure profiles can then be used to predict the aluminum target’s behavior under laser shock using mechanical simulation software.
Keywords: laser shock, LSP, LASAT, laser-matter interaction, WCR, VISAR, plasma
Abbreviations:
CCD charge-coupled device DOE diffractive optical elements FWHM full width at half-maximum FSV free surface velocity
GCLT transportable laser shock generator LASAT LASer Adhesion Test
LSP laser shock peening SCG Steinberg-Cochran-Guinan
VISAR velocity interferometer system for any reflector WCR water-confined regime
1. Introduction
Laser shock is used in several processes such as the laser shock peening (LSP) and the LASer Adhesion Test (LASAT). The propagation of shock and release waves through materi-als induces compression and traction zones [1,2]. While the residual stresses arising from the compression of matter are relevant for the LSP treatment [3], the LASAT process exploits the traction peak stress that arises at the meeting point of two release waves [4,5]. The LSP treatment, when applied to a metallic target, has already proven its capability to improve mechanical properties and fatigue performance [6–10]: crack initiation is inhibited and crack growth is delayed. The LASAT capability was first demonstrated by Vossen [11]; its state of the art was published in 2011 [12]. Several studies since have shown that it can be used as an extended non-destructive test for aeronautical bonding [13–15].
The application of a high-powered laser to a metallic sur-face causes vaporization of a layer a few micrometers thick, leading to the formation of an expanding plasma [16,17]. In reaction to the plasma expansion, a mechanical loading, equi-valent to an ablation pressure (Pabl), is applied to the target,
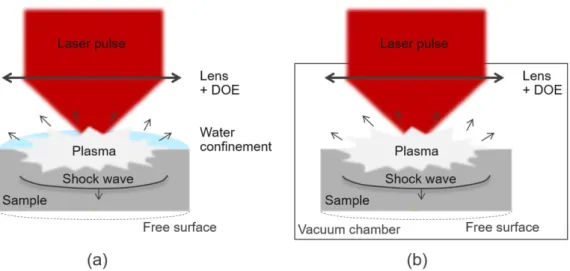
resulting in a shock wave that propagates through the mater-ial (figure1). The illumination of the surface can be direct (figure1(b)) or in a confined regime (figure1(a)). The confine-ment can be any medium transparent to the laser wavelength that will slow the expansion of the plasma. The use of con-finement therefore increases the equivalent pressure by up to one order of magnitude and makes the shock wave last two to three times longer than the pulse duration [18–21]. How-ever, in a dielectric medium such as water or air, a break-down phenomenon can occur at certain laser intensities, lead-ing to a pressure saturation and a shorter shock wave duration [22–25]. The determination of the intensity threshold above which breakdown appears is essential to identify the usable range of pressures as a function of incident power density.
LSP and LASAT technologies use similar lasers, neodymium-doped yttrium aluminum garnet (Nd:YAG) or neodymium-doped glass (Nd:glass), with wavelengths ran-ging from 532 to 1064 nm and energies from a few joules
to several tens of joules focused on millimeter-sized focal spots. It is essential to master the laser-induced plasma in order to control the process. In addition, this investigation offers the opportunity to examine material properties under shock. Currently, some models already exist that can charac-terize the physical processes of a confined laser shock [21] or calculate the maximal induced pressure from the exper-imental velocities [26]. However, their validation has been done using one set of laser parameters, with different means of pressure characterization but with a lack of laser metro-logy and no reliable beam-quality [21–23,27]. In addition, there is no self-consistent model for the prediction of plasma temporal pressure profiles. The improvement of experimental and numerical tools over the past few years has enabled new advances in plasma characterization aiming at verifying recent experimental reliability as well as extracting a self-consistent numerical model. Therefore, for the first time, this work con-sists of a collection of an extensive range of experiments to validate a model able to predict the loading profile necessary to simulate the laser shock process. Based on the ESTHER numerical code, it permits a characterization of the plasma (temperature, duration and thickness). This paper presents an experimental and numerical study of laser–matter inter-action in the water-confined regime and direct illumination at three laser facilities allowing different focal spots (round and square) and variable pulse shapes and durations. For every experiment, an effort has been made to characterize the laser in terms of its beam profile, energy and temporal pulse shape. First, we present velocity interferometer system for any reflector (VISAR) measurements of free surface velocity (FSV) versus time for pure aluminum. These are then com-pared to the numerical simulation obtained from the ESTHER code. Thanks to its laser–matter interaction prediction mod-ule, the plasma temperature is obtained from the code as well as the equivalent ablation pressure and the amount of ablated materials. Finally, practical scaling laws are extracted from these results. The latter provide a plasma temporal pressure profile for any of the above configurations, which can be used to simulate the behaviour of aluminum under laser shock using mechanical simulation software.
2. Experimental study
Three laser facilities with several setups were used: H´ephaïstos in the Process and Engineering in Mechanics and Mater-ials laboratory (PIMM lab) (Paris), the HiLASE research center (Prague) and the Transportable Laser Shock Gener-ator (GCLT) of the French Alternative Energies and Atomic Energy Commission (CEA/DAM/DIF) (Paris). Each source is described more precisely thereafter. A 2–3 mm water-confined regime was used consistently at all experimental facilities (figure1(a)), achieved by depositing water on the
Figure 1. A schematic view of the experimental setups (a) in water-confined regime performed at H´ephaïstos, HiLASE and GCLT, (b) in direct-interaction regime performed at GCLT.
Figure 2. (a) Temporal pulse of 7 ns at Hephaïstos. (b) Typical CCD image of a ϕ = 4 mm round top-hat focal spot.
sample’s surface. In addition, the vacuum chamber of the GCLT (figure1(b)) was used for direct irradiation regime. A particular effort was made to ensure precise knowledge of the experimental parameters. The target laser energies are meas-ured and saved for each shot using calibrated calorimeters. Diffractive optical elements (DOE) were added to every beam path at H´ephaïstos and GCLT to homogenize their spatial dis-tributions [14]. Before starting the experiments, the on-target focal spot diameters (ϕ) are measured using a charge-coupled device (CCD) camera and the temporal profiles are measured using photodiodes. The GCLT can change these profiles on demand, therefore they are measured and saved for each shot. The rear FSVs were measured using VISAR [26,28–30]. A 100 µm-diameter laser probe is focused on the back face of the sample and aligned to scan the middle of the working laser’s focal spot. The photomultiplier’s response time offers time-resolved velocity measurements with a precision on the nano-second scale. The global uncertainty of the velocity measure-ment and the corresponding laser intensity is estimated to be
±15% rms.
2.1. Laser facilities
The H´ephaïstos platform uses a Thales Gaïa High Power laser composed of two Nd:YAG lasers at 532 nm. Together, they can deliver up to 14 J with a pulse duration of 7 ns full width
Figure 3. (a) Top-hat temporal profile of a 10 ns pulse at HiLASE. (b) Spatial shape profile for a ϕ = 3.5 mm square top-hat laser spot.
Figure 4. (a) Top-hat temporal profile obtained for 10, 20 and 40 ns requests at GCLT. (b) Typical CCD image of a ϕ = 5.1 mm round top-hat focal spot.
at half maximum (FWHM) of a Gaussian pulse (figure2(a)). The focal spot diameters are 3 and 4 mm, leading to intens-ities ranging from 0.7 to 13 GW cm−2. The spatial shape of a 4 mm focal spot taken by a CCD camera is displayed in figure2(b).
The main laser system of the HiLASE research center is called BIVOJ. It is a diode-pumped solid-state laser working at 1029 nm and delivering 10 ns pulses with energy levels of up to 105 J [31]. Both the spatial and temporal shapes of the pulses are square (figure3). The use of a 3.5 mm focal spot led to intensities ranging from 0.6 to 11.8 GW cm−2.
The GCLT is based on an Nd:glass laser (Lumibird) with a wavelength of 1053 nm that delivers pulses from 4 to 100 ns
Table 1. Parameters used for the Steinberg–Cochran–Guinan (SCG) material model [34] with an aluminum target (99.999%, laminated).
Material Y0(MPa) Ymax(MPa) β n εi G0(GPa) Gp′ GT′(GPa/K)
Aluminum 120 160 4000 0.27 0 27.1 1.8 −1.7 × 10⁻²
with energies of up to 40 J. The laser pulse temporal profile can be chosen to be, for example, Gaussian-like, triangular or top hat. Figure4(a) displays the top-hat pulse duration obtained for a requested pulse of 10–40 ns. A vacuum chamber enables the study of the direct-illumination regime. For the water-confined regime, a 5.1 mm focal spot was used (figure4(b)), leading to intensities ranging from 0.2 to 11.5 GW cm−2. In order to reach the same induced pressure in the direct-irradiation regime, the intensities have to be much higher (from 8 to 200 GW cm−2). With the same laser energies available, the laser focal spots were 2.5 and 1 mm.
2.2. Materials
The thicknesses of the samples were chosen in accordance with the focal spots to avoid edge effects by making the ratio of sample thickness to focal spot diameter smaller than 0.25 [32, 33]. This study was thus conducted using two thick-nesses (100 µm and 500 µm, respectively, for direct illumin-ation and the water-confined regime) of pure aluminum. The Steinberg–Cochran–Guinan (SCG) model was used to obtain their elastoplatic behaviors (cf section3) [34]. The mechanical properties used in this study are displayed in table1[35]. The initial and maximal yield strengths are Y0and Ymax,
respect-ively (in the von Mises sense), β and n are work-hardening parameters, εiis the initial equivalent plastic strain, G0is the
shear modulus at the reference state (temperature T = 300 K, pressure P = 0 and ε = 0), and Gp′ and GT′ are the shear mod-ulus derivatives with respect to the pressure and temperature, respectively.
2.3. Experimental Results
This section presents VISAR measurements performed under two illumination regimes at three laser facilities (Hephaïstos, HiLASE and GCLT). For each configuration, the dependences of the rear FSV measurements on the laser pulse duration ∆T (ns) and/or the intensity I (GW cm−2) are presented (figures5
and7) together with the simulations, which will be discussed in section3. Plotting the maximal FSV versus the laser intens-ity (figures6and8) enables us to observe the global beha-vior of the target under direct and water-confined irradiation, to identify the breakdown phenomenon threshold, and to com-pare the results from one installation to another.
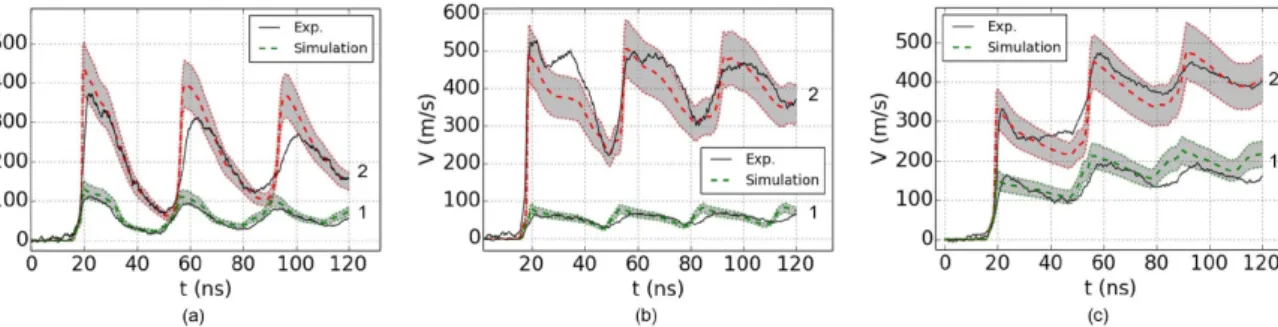
2.3.1. Direct illumination regime. This study is based on a large set of data gathered from numerous experiments car-ried out with several focal spots, laser intensities, and pulse durations, ensuring a wide range of results. Some representat-ive signals of the FSV as a function of time are displayed in figure5for ∆T = 10, 20 and 40 ns at different power densit-ies. A comparison with the simulation (colored dashed lines)
and the±15% uncertainty of the incident power density (grey area) will be discussed in section3. The first peak is of partic-ular interest, since it corresponds to the first emergence of the shock wave and has a direct relationship to the plasma pres-sure [23,26]. The other peaks correspond to wave reflections within the target. By comparing the first maxima for two pulse durations (10 and 20 ns, figure5(a) 1 and5(b) 1) it is possible to conclude that pulse duration does not affect the respective velocity maxima (115 m s−1for I = 16.7 GW cm−2and 60 m s−1for I = 8.1 GW cm−2): the maximum velocity is only influ-enced by applied peak intensities. The peak width is related to the pulse duration: a longer pulse duration (from 10 to 20 ns) induces broader peaks (from 16 to 28 ns at half maximum). In the case of a 40 ns pulse striking a 100 µm sample, the shock duration is longer than the time needed by the wave to go back and forth in the target (37 ns), hence the release wave arriving at the end of the laser pulse reloads the reflected release wave and the peak increases again before decreasing to its minimum (figure5(c)).
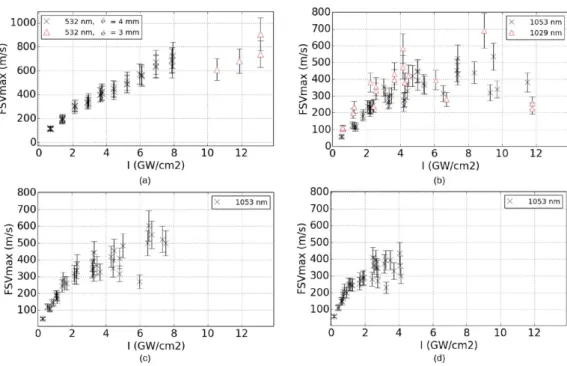
The first peak maximum of the rear FSV was determ-ined for three pulse durations (10, 20 and 40 ns) and two focal spot sizes (1.1 and 2.5 mm). In the case of a clear peak (figures5(a) and (c)), its highest value was extracted, otherwise the maximum was set to the mean value of the plateau (figure5(b)). Figure6collates the maximum velocit-ies of the first peaks extracted from the measurements for all pulse durations and spot diameters included in the direct illumination regime. From this graph, it is clear that neither the focal spot nor the laser pulse duration has an influence on the maximal FSV in the direct irradiation regime when applied to a 100 µm pure-aluminum target. The maximal FSV increases with the intensity in the entire range studied (from 8 to 195 GW cm−2corresponding, respectively, to velocities of 50 and 630 m s−1).
2.3.2. Water confined regime (WCR). Water confined
regime experiments were carried out at three wavelengths (532, 1029 and 1053 nm) with four pulse durations (7, 10, 20 and 40 ns) and four focal spots (3, 3.5, 4 and 5 mm). Typical velocity profiles are displayed in figure7. First of all, the effect of confinement on the pressure should be noted; less intensity is needed to reach the same velocities in the water-confined regime (WCR) than with the direct-irradiation regime. For example, in the direct illumination regime, a top-hat pulse of 10 ns from the GCLT platform with 112 GW cm−2induces a rear FSV of almost 400 m s−1, whereas only 5 GW cm−2at the same pulse duration is required in the WCR for almost the same FSV. This is in good agreement with a previous study showing that the use of confinement increases the ablation pressure [21]. Figure7displays the FSV versus time for (a) 7 ns Gaussian pulses at 532 nm and (b) 10 ns top-hat pulses at
Figure 5. A comparison of the simulated (colored dashed lines) and experimental (black lines) results for 99.999% pure aluminum, thickness = 100 µm, GCLT, 1053 nm, direct illumination, ϕ = 1.1 mm: (a) ∆T = 10 ns, (1) I = 16.7 GW cm−2, (2) I = 112.0 GW cm−2, (b) ∆T = 20 ns, (1) I = 8.1 GW cm−2, (2) I = 133.6 GW cm−2, (c) ∆T = 40 ns, (1) I = 24.7 GW cm−2, (2) I = 71.1 GW cm−2. Uncertainty of the simulation ε = 15% (grey area).
Figure 6. FSVmaxversus laser intensity I. 99.999% pure aluminum, thickness = 100 µm, GCLT—1053 nm, direct illumination, ϕ = 1.1 and 2.5 mm, ∆T = 10 ns, 20 ns and 40 ns.
1053 nm. In this case, the shape of the FSV peaks is not influ-enced by the laser-pulse shape nor the wavelength: the peaks widths durations at half maximum are 32 and 20 ns, respect-ively. When using longer top-hat pulse durations, the widths of the peaks increase : pulses of 20 and 40 ns (figures7(c) and (d)) result in FSV first peak widths at half maximum of 41 and 79 ns, respectively.
The maximal rear FSV was set the same as for the direct illumination regime, and is plotted versus the laser intensity in figure8. From these graphs, the influence of the wavelength and the pulse duration on the FSV maxima is established. However, small variations of the wavelength (from 1029 to 1053 nm) and focal spots (round and square) do not affect the maximum peak velocity. The results of the experiments car-ried out at the two laser facilities (GCLT and HiLASE) are con-sistent with each other (figure8(b)), demonstrating the reliab-ility of the method. For all sets of data obtained, two different behaviors can be observed: firstly, the velocities increase as a function of power density; secondly, the maximal velocities saturate from a threshold corresponding to the intensity (Ith),
above which the plasma breakdown has a detrimental effect on the maximal FSV. For the 7 ns laser pulse at 532 nm, the Ith
is equal to 8–10 GW cm−2with a maximal FSV of 720 m s−1
(figure8(a)). For laser pulses at 1029 and 1053 nm with pulse durations of 10, 20 and 40 ns, the Ith values are equal to 5 to
6, 3 to 4 and 2 to 3 GW cm−2, respectively, with maximal velocities of 530, 440 and 300 m s−1(figures8(b)–(d)). These thresholds are collated in table2.
3. Numerical study
The numerical study was performed using one-dimensional Lagrangian code called ESTHER. It is widely described in the literature [13,35–37]. In the studied range of power densit-ies, the plasma is dominated by inverse bremsstrahlung laser absorption and hydrodynamic phenomena including ioniza-tion, phase transformaioniza-tion, temperature and pressure determ-ination. In the code, the material stack is divided into several cells. The laser–matter interaction is reproduced by solving the Helmholtz equations within each cell using the complex refractive indexes given by Palik’s tables [38] for the solid state, and calculated from the Lorenz plasma model [39] in the plasma state. The hydrodynamics of each cell are modelled by solving equations for the cell position’s evolution together with the equations for the conservation of mass, momentum and energy in finite volumes in the planar mono-dimensional hypothesis. The global hydrodynamic in the entire stack of cells is described using, in our case, a SESAME-tabulated state equation provided by the Los Alamos National Laboratory. The mechanical behavior of the stack is simulated using the SCG model [34]. The code reliability in the direct-irradiation regime at 1053 nm and the WCR at 532 nm was proven by Bardy [35]. The aim of this study is to extend its range of application under WCR at 1053 nm to extract ablation pres-sure temporal profiles and find numerical equations to repro-duce them without a laser–matter interaction code. In addi-tion, plasma temperature profiles and the ablated layer thick-ness are obtained from the simulation to evaluate the impact of the plasma laser on the surface of the material. The SESAME equation for state number 3720 and the aluminum elastoplastic model properties are taken directly from previous studies (cf table 1) [35]. For the WCR, all the parameters from the previous study were adopted, except for the optical constant of water, which had been adapted for the 1053 nm wavelength
Figure 7. A comparison of the simulatied (colored dashed lines) and experimental (black lines) results for pure aluminum, thickness = 500 µm, WCR. (a) Hephaïstos, 532 nm, ∆T = 7 ns, ϕ = 4 mm, (1) I = 2.4 GW cm−2, (2) I = 5.9 GW cm−2, (b) GCLT, 1053 nm, ∆T = 10 ns , ϕ = 5 mm, (1) I = 2.3 GW cm−2, (2) I = 5.0 GW cm−2, (c) GCLT, 1053 nm, ∆T = 20 ns, ϕ = 5 mm, (1) I = 1.4 GW cm−2, (2) I = 2.3 GW cm−2, (d) GCLT, 1053 nm, ∆T = 40 ns, ϕ = 5 mm, (1) I = 0.4 GW cm−2, (2) I = 1.1 GW cm−2. Uncertainty of the simulation
ε = 15 % (grey area).
Figure 8. FSVmaxversus laser intensity I. Pure aluminum, thickness = 500 µm, WCR: (a) Hephaïstos, 532 nm, ϕ = 3 and 4 mm, ∆T = 7 ns; (b) GCLT: 1053 nm; HiLASE: 1029 nm; ϕ = 5 and 3.5 mm, ∆T = 10 ns; (c) GCLT, 1053 nm, ϕ = 5 mm, ∆T = 20 ns; (d) GCLT, 1053 nm, ϕ = 5 mm, ∆T = 40 ns.
(n1= 1.33, n2= 1.3 × 10⁻⁶) [40] where n1 + n2 is the
complex refractive index.
3.1. Free surface velocity
The simulations of the FSV under direct illumination and the WCR are displayed in figures5and7(colored dashed lines)
and compared with the experimental results (black lines). The simulation uncertainty is directly linked to the intens-ity input deduced from the focal spot and energy experi-mental measurements (cf section2). Therefore it is also taken at ±15%. It is represented by grey areas. The SCG mech-anical model is correct for every configuration and its good agreement with the experiments is shown in figures5and7.
Figure 9. Pablversus time. 99.999% pure aluminum, thickness = 100 µm, GCLT, 1053 nm, direct illumination, ϕ = 1.1 mm: (a) ∆T = 10 ns, (1) I = 16.7 GW cm−2, (2) I = 112.0 GW cm−2; (b) ∆T = 20 ns, (1) I = 8.1 GW cm−2, (2) I = 133.6 GW cm−2; (c) ∆T = 40 ns, (1) I = 24.7 GW cm−2, (2) I = 78.1 GW cm−2.
In both illumination regimes, the first peak amplitude is accurately determined when ε is taken in account. In the direct-illumination regime, small discrepancies in the peak shape and duration can be seen (figures5(a) 2 and (b) 2), highlighting a potential area for improvement in the elastoplastic model. However, this study is focusing on the plasma pressure, which is directly related to the first peak and thus will not be affected by those discrepancies. In the direct-illumination regime as well as the WCR, the experimental curves for each wavelength and pulse duration are accurately described by the code when only the laser power density changes. This supports the valid-ity of the code at 532 nm in the WCR with ∆T = 7 ns and intensities ranging from 2.4 to 6 GW cm−2and at 1053 nm, as follows:
• ∆T = 10 ns, laser intensities ranging from 15 to 110
and 1.3 to 5 GW cm−2for direct illumination and WCR, respectively
• ∆T = 20 ns, laser intensities ranging from 10 to 130 and
1.5 to 2.3 GW cm−2 for direct illumination and WCR, respectively
• ∆T = 40 ns, laser intensities ranging from 25 to 80 and
0.8 to 2 GW cm−2 for direct illumination and WCR, respectively.
Consequently, the interesting physical data, such as the pressure as a function of time, can be extracted from the code for each corresponding validity domain.
3.2. Ablation pressure
The ablation pressure, Pabl, versus time was obtained from the
code at the ablation front location. Figure9presents the res-ults for the ablation pressures at 10, 20 and 40 ns at 1053 nm in the direct-illumination regime. These correspond to the con-ditions presented in figure5. The pulse duration has a strong influence on the shape of the pressure temporal profile. First, the pressure rises drastically when the plasma is heated by the laser, then a plateau can be observed until the end of the laser pulse. Finally, when the laser pulse ends, the pressure drops dramatically until the ambient pressure is reached, following adiabatic matter expansion.
In the WCR, the same method was applied to obtain the pressure from the simulation of the FSV presented in figure7. In the case of a 7 ns Gaussian pulse at 532 nm (figure10(a)) the pressure profile increases slowly during the few ns needed to warm up the matter and create the plasma. Then it increases almost as a Gaussian up to the the maximal ablation pressure (Pabl,max); finally it reduces as the matter expands. For pressure
profiles extracted at 1053 nm, the three steps identified in the direct-illumination regime are also visible in the WCR. How-ever for the 20 and 40 ns pulses (figures 10(c) and (d)), the profiles are very similar with an almost perfectly flat plateau corresponding to the pulse duration. The pulse duration does not affect the maximal value; a 2.3 GW cm−2pulse with top-hat pulses of either 10 or 20 ns will induce maximal ablation pressures of 2.5 or 2.7 GPa, respectively (figures10(b) 1 and (c) 2).
To simulate the behavior of the target under laser shock, the temporal pressure profiles extracted from ESTHER (figures9and10) were used instead of the laser–matter interaction module. The resulting FSV profiles are similar to the ones presented in figures 5and7, confirming the reliab-ility of the temporal pressure profiles. Thanks to the model developed within the code, it is now possible to obtain the pressure as a function of time to calculate the FSVs of all the experiments realized within the area of validity defined in section3.1.
3.3. Plasma parameters
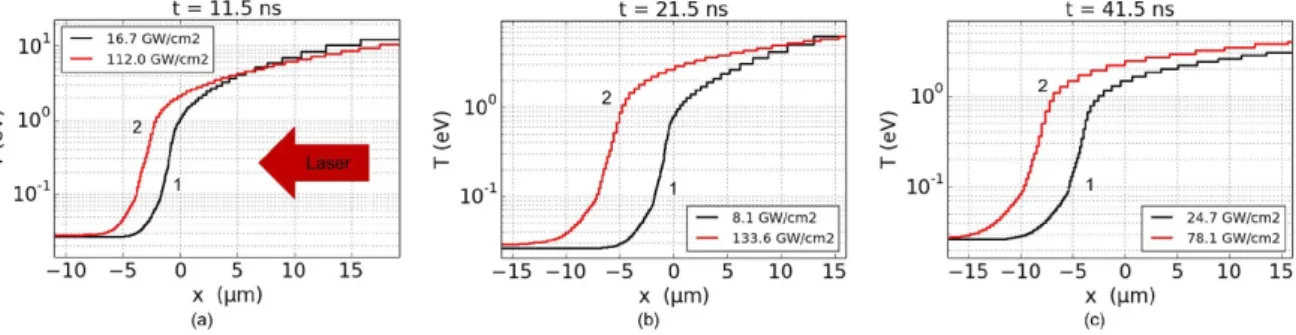
The plasma temperature at the end of the laser pulse has been extracted from the entire simulated stack for each laser con-figuration (figures 5and 7). Figure 11 displays the plasma temperatures for different incident laser intensities (I) with (a) 10, (b) 20 (c) and 40 (d) ns laser pulse durations in the dir-ect illumination regime. The surface of the target is defined as x = 0. The laser is, by convention, coming from the right of the stack. The warmest region is the plasma corona with temperatures from 10 to 15 eV for any pulse duration. The shock front is propagating through the target with temperat-ures from 2 eV to room temperature (0.03 eV). The amount of ablated aluminum is proportional to the pulse duration and the incident laser intensity. At ∆T = 20 ns, with intensities of 8.1
Figure 10. Pablversus time. 99.999% pure aluminum, thickness = 500 µm, WCR: (a) Hephaïstos, 532 nm, ∆T = 7 ns, ϕ = 4 mm, (1) I = 2.4 GW cm−2, (2) I = 5.9 GW cm−2; (b) GCLT, 1053 nm, ∆T = 10 ns, ϕ = 5 mm, (1) I = 2.3 GW cm−2, (2) I = 5.0 GW cm−2; (c) GCLT, 1053 nm, ∆T = 20 ns, ϕ = 5 mm, (1) I = 1.4 GW cm−2, (2) I = 2.3 GW cm−2, (d) GCLT, 1053 nm, ∆T = 40 ns, ϕ = 5 mm, (1) I = 0.4 GW cm−2, (2) I = 1.1 GW cm−2.
Figure 11. Temperature versus position. 99.999% Pure aluminum, thickness = 100 µm, GCLT, 1053 nm, direct illumination, ϕ = 1.1 mm: (a) ∆T = 10 ns, (1) I = 16.7 GW cm−2, (2) I = 112.0 GW cm−2, (b) ∆T = 20 ns, (1) I = 8.1 GW cm−2, (2) I = 133.6 GW cm−2, (c) ∆T = 40 ns, (1) I = 24.7 GW cm−2, (2) I = 78.1 GW cm−2.
and 133.6 GW cm−2, 5 and 13 µm of aluminum are ablated, respectively.
In the WCR, the plasma temperature was extracted at the time when the pressure and the temperature were maximal, which corresponds to 12.5 ns for 7ns Gaussian pulses. In the case of 10, 20 and 40 ns top-hat pulses, the maximum temperature is at the end of the pulse duration (11.5, 22.5 and 42.5 ns precisely). The plasma temperature is displayed for laser pulses at 532 and 1053 nm in figure12. In ESTHER, the modelling of the plasma under the WCR is composed of Al (black) and H2O (blue) media. The temperature range is
sim-ilar for all laser configurations (8–14 eV). With the wavelength and incident laser intensity kept constant, the plasma thick-ness, L, and temperature, T, are proportional to the pulse dur-ation. In figure12, the temperatures are 9 and 13 eV and the plasma lengths 9 and 20 µm, respectively, for 10 ns ((b) 1) and 20 ns ((c) 2) top-hat pulses. These results are in agreement with
Fabbro’s model [21] (L = 7 µm for I = 10 GW cm−2and ∆T = 10 ns on a 10 mm copper target confined with glass). At the end of the laser pulse, the ablated zone can be evaluated using the temperature profile; table2presents these values together with the plasma thickness for every configuration. For the laser shock process, it is interesting to know the depth of the vaporized material, to quantify the required thermal protection [41,42].
4. Scaling laws
The reliability of the numerical code and the extracted pres-sure profile was established in section3. The pressure versus time relation is of particular interest, since it enables any code to calculate the behavior of materials under shock, without the need for a laser–matter interaction module. However, each
Figure 12. Temperature versus position. 99.999% pure aluminum, thickness = 500 µm, WCR (a) 532 nm, ∆T = 7 ns, ϕ = 4 mm, (1) I = 2.4 GW cm−2, (2) I = 5.9 GW cm−2, (b) GCLT, 1053 nm, ∆T = 10 ns, ϕ = 5 mm, (1) I = 2.3 GW cm−2, (2) I = 5.0 GW cm−2, (c) GCLT, 1053 nm, ∆T = 20 ns, ϕ = 5 mm, (1) I = 1.4 GW cm−2, (2) I = 2.3 GW cm−2, (d) GCLT, 1053 nm, ∆T = 40 ns, ϕ = 5 mm, (1) I = 0.4 GW cm−2, (2) I = 1.1 GW cm−2.
ablation pressure curve that is obtained requires the ESTHER code and a few minutes of calculation. The aim of this section is to present an analytic formula for the pressure dependence on the laser wavelength, pulse duration and incident intensity for the direct and water confined regimes. To support this aim, tens of simulations were run within the validity area defined by the experiments, i.e. at 532 nm in the WCR with Tpulbetween
7 and 20 ns and intensities ranging from 1 to 10 GW cm−2 and at 1053 nm for the WCR, Tpulbetween 10 and 40 ns and
intensities I from 1 to 6 GW cm−2and for direct illumination regime, Tpul between 5 and 40 ns andintensities I from 10 to
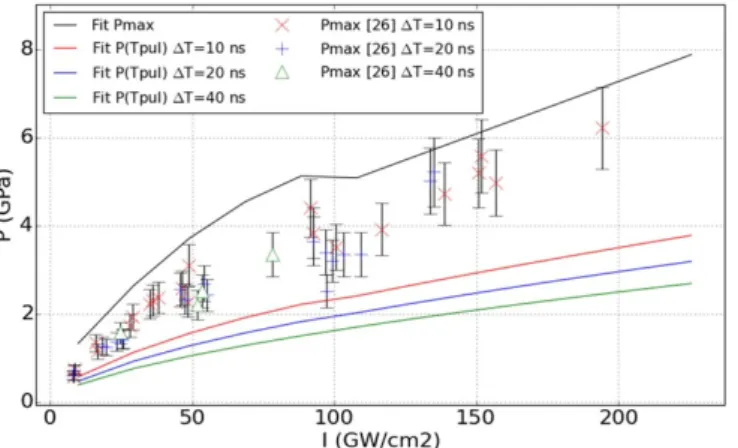
500 GW cm−2. Numerical fits that can reproduce the temporal pressure profiles were then found. Finally, two methods yield-ing the maximum pressure are compared: the first is extracted from a numerical fit of the pressure temporal profile, and the second is calculated from the experimental FSVs presented in figures5and7, using formula (1) [26].
Pmax= ρ0 ( C0+ SFSVmax 2 ) FSVmax 2 + ∆P + 2 3σY0[GPa] (1) where ρ0is the density of the material [gm−3], C0is the sound
velocity in this material [m s−1], S is the parameter regulating the growth of the shock speed with the material speed, σY0the
elastic limit [GPa], and ∆P the attenuation (hydrodynamic and elastic-plastic) [GPa]. ∆P is calculated numerically accord-ingly to [25]. It has to be noticed that the fit is only valid before the water breakdown power density.
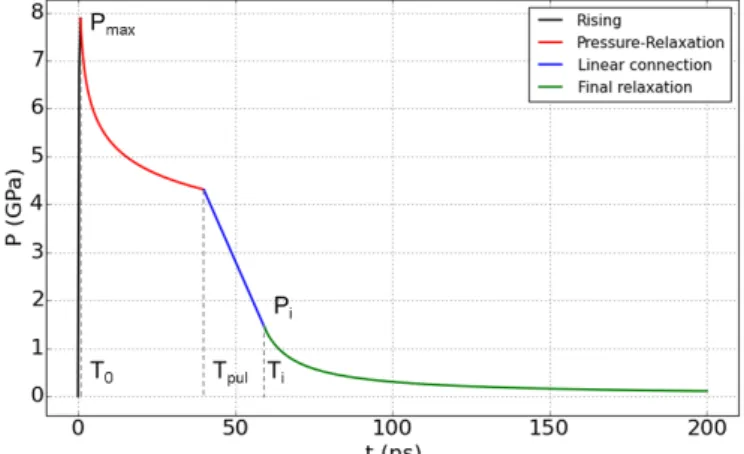
Figure 13. Analytic temporal pressure profile corresponding to a 40 ns top-hat pulse at 1053 nm with an incident laser intensity of 250 GW cm−2under direct laser illumination.
4.1. Direct illumination regime
To describe the pressure temporal profile, the temporal area was divided into four zones represented in figure13; each zone is reproduced by one fit. T0and Tiare set at 0.5 ns and32Tpul,
respectively, for the following calculations.
• Linear rising t ≤ T0: P(t) = Pmax
(
t T0
)
• Pressure/relaxation zone T0≤ t ≤ Tpul: P(t) = Pmax
(T0
t
Figure 14. Maximum pressures calculated according to the analytic fit and formula (1), together with the pressure at the end of the pulse duration calculated according to the analytic fit for 10, 20 and 40 ns top-hat pulses at 1053 nm under direct illumination.
• Linear connection Tpul≤ t ≤ Ti connection between the
points [Tpul; P(Tpul)] and [Ti; Pi= P(Ti)]
• Final release zone t ≥ Ti: P(t) = Pi
(
Ti−Tiδ
t−Tiδ )n
.
The parameters Pmax, Pi (pressure at time equals Ti), p, n
and δ were adjusted for the entire intensity and pulse duration range. On the contrary, the parameters Pmax and p do not
depend on the pulse duration, therefore they were adjusted for the longest pulse duration, i.e 40 ns. Pm corresponds to the
minimal pressure obtained at the end of this pulse duration. The three other parameters related to the relaxation, Pi, n, and
δ depend on the pulse duration Tpul. They are all given by the
equations inA.1.
The pressure profiles obtained with the above equations are in good agreement with the one obtained via the laser–matter interaction module in ESTHER. Consequently, the FSVs cal-culated by the code using the pressure profile and the fit are similar. Thanks to the analytically fitted curves, it is possible to reproduce the material behavior induced by laser–matter inter-action using any mechanical simulation software. In the direct-illumination regime, the temporal laser pulse and pressure pro-file do not have the same shape, as can be seen in figure9. There is indeed a sharp peak at the beginning of the plateau that makes it irrelevant to describe the ablation pressure using only its maximal value. As an illustration, figure14represents the maximum of this pressure peak Pmax and the pressure at
the end of the pulse duration, PTpul, obtained analytically as
a function of the intensity, together with the maximum pres-sure Pmaxcalculated from the experimental FSV using formula
(1). The pulse duration does not affect the maximum pres-sure, however, longer pulses induce lower pressures at time
Tpul. In the entire range studied, the maximum pressures
cal-culated from the experimental FSVs are in between the fits of the maximum pressure and the pressure at Tpul. It is
there-fore important to take the entire temporal pressure profile into account when using it as an input to simulate the target’s beha-vior under laser shock.
Figure 15. Analytic temporal pressure profile corresponding to a 7 ns FWHM Gaussian pulse at 532 nm with an incident laser intensity of 5 GW cm−2under the WCR.
4.2. Water-confined regime
4.2.1. 532 nm. With the 7 ns Gaussian-shaped laser pulse,
the pressure profile is also a Gaussian until the final release. For the purposes of this study, the profile was divided into four temporal zones, the initiation, the rise, the maximum, and the relaxation (figure15). For each zone, an analytic formula has been fitted in order to reproduce the simulation over the entire area of validity. The intensities were set between 1 and 10 GW cm−2for 7 to 20 ns FWHM Gaussian pulses. It should be noted that only the 7 ns simulations can be compared with experiments.
T0is defined as the time needed for the initiation of the
abla-tion phenomena. For a Gaussian pulse, the intensity increase is slow, since the energy deposited needs some time to ablate the surface and create a plasma which will absorb the laser energy. The initial reflectivity of the aluminum surface, which controls T0, is set to 0.5. Once the aluminum is sufficiently
ablated, the pressure rises drastically until it reaches its max-imal value, Pmax. After this maximum is reached at Tmax, the
medium slowly relaxes. The following equations describe the analytic formulation which enables the reproduction of the profile pressure using only the pulse duration Tpuland the
max-imum intensity, I, for Gaussian pulses.
• Initiation t ≤ T0: P(t) = 0 with T0=0.8+0.87TI0.35 pul
• Linear rise t ≤ Tl: P(t) = Pi ( t−T0 Tl−T0 ) with Tl= Tmax− 1
2Tpuland Pi= 0.82Pmax
• Maximal pressure Tl≤ t ≤ TrP(t) = Pmaxe− (t−Tmax
1.1Tpul
)2
with
Tr= Tmax+12Tpul
• Final release zone t ≥ Tr: P(t) = Pi
(
Tr−Trδ
t−Trδ )n
.
The maximal pressure peak is reached at Tmax, with Tmax=
1.7 Tpul(I− (1.3 − 0.13 Tpul))0.012, the highest values being
achieved with Pmax= 2.2 I0.57. The coefficients n and δ,
required for the calculation of the final relaxation are defined by equation (A12) in appendixA.2.
Figure 16. Maximum pressures calculated by analytic fits and formula (1) for 7 ns Gaussian pulses at 532 nm in the WCR.
Figure 17. Analytic temporal pressure profile corresponding to a 20 ns top-hat pulse at 1053 nm with an incident laser intensity of 3 GW cm−2under the WCR.
It can be seen from these formulas that the maximum of the pressure does not depend on the pulse duration for a Gaussian pulse (this might not be true for other pulse shapes). The pulse duration has an influence on the pressure duration, which is to make its temporal shape longer. The maximum pressures cal-culated from the experimental FSVs presented in7using for-mula (1) [26] were plotted together with the maximum values of Pmaxcalculated via the fit in figure16. These two methods of
maximum pressure determination are in very good agreement until the water breakdown phenomenon occurs.
4.2.2. 1053 nm. For water-confined regimes at 1053 nm, the temporal pressure profiles obtained from the simulation with intensities ranging from 1 to 6 GW cm−2and top-hat pulses from 10 to 40 ns were separated into four zones (figure17). The analytic equations of the pressure profile dependence on the laser intensity, I (GW cm−2) and the pulse duration Tpul
[ns] are as follows:
− Quadratic rising t ≤ T0: P(t) = Pmax
( 1−
( 1−T0t
)2)
with T0=2.4I and Pmax= 2I0.53
Figure 18. Maximum pressures calculated according to analytic fits and formula (1) for 10, 20 and 40 ns top-hat pulses at 1053 nm in the WCR.
− Plateau( T0≤t≤min(T1, Tpul) :P(t) =Pmin+ (Pmax−Pmin)
T1−t T1−T0
)4
with T1= max(12, 16− I) and Pmin= 1.79 I0.453
− Linear connection T1≤ t ≤ min(Tpul) :P(t) =P40ns40−−TP1min(t− T1)
+Pminwith P40ns= 1.97I0.53
− Final releasing zone t ≥ Tpul: P(t) = P (Tpul)
(
1−δ
t/Tpul−δ
)n
with n = 0.68 + 0.5e−(0.1Tpul−0.5)I and δ = 0.52
(
1− e−(0.011T1.56pul)I
)
.
The pressure temporal profiles are not Gaussian shapes, however the maximum pressure Pmax is close to the pressure
at the end of the laser pulse, Ppul. The maximal pressures Pmax
calculated from the fit are plotted as a function of the incident intensities together with the Pmax calculated by equation (1)
from the experimental FSVs. Similarly to the WCR at 532 nm, the two methods of Pmaxdetermination are in good agreement.
The pulse duration ∆T has no influence on Pmax, however, a
longer pulse duration induces a longer pressure, therefore it is important to take into account the entire temporal profile of the pressure given by the above equations.
5. Conclusions
In this paper, we presented the experimental FSVs of pure aluminum, as measured by VISAR in three different laser labs. This work synthesizes a significant range of input para-meters covering two irradiation regimes (direct and water confined), three wavelengths (from 532 to 1053 nm), two laser pulse shapes (Gaussian and top-hat), four laser-pulse durations (from 7 to 40 ns) and five focal-spot sizes (from 1 to 5 mm) with round and square shapes. Although the exper-iments were conducted with several laser configurations, the results collected demonstrated good consistency. More pre-cisely, it was shown that with similar wavelengths and pulse durations, the shape of the focal spot does not have an effect on the maximal FSV. Due to the good agreement of the simu-lation results with the experimental data, the reliability of the ESTHER code was extended to a broader range of validity, making it now possible to obtain physical data characterizing
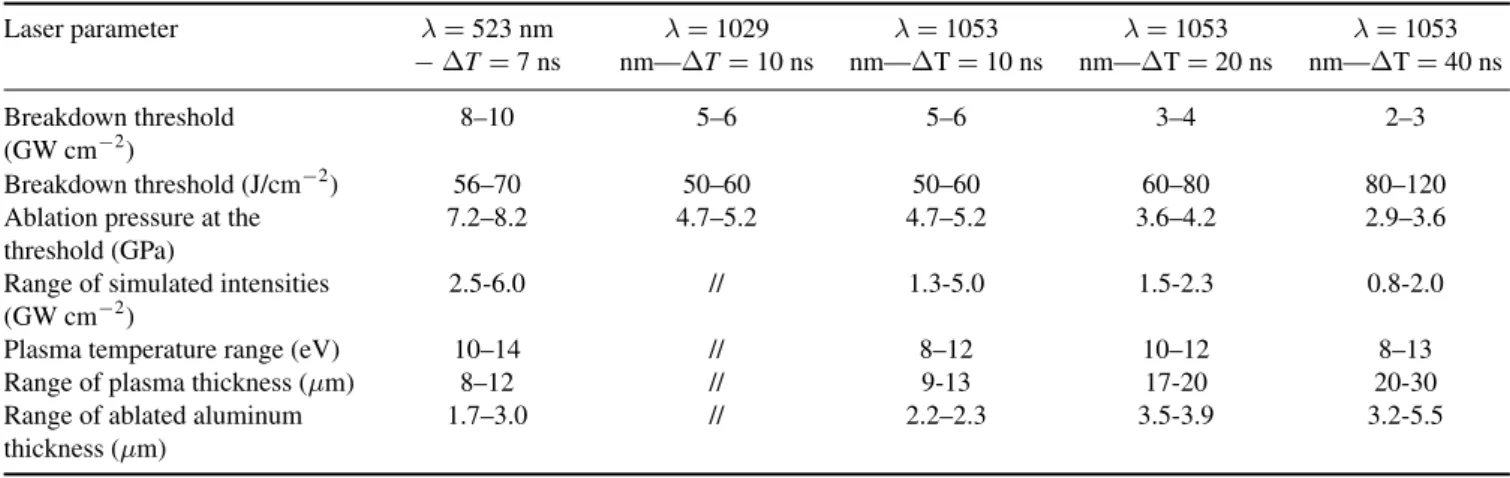
Table 2. Plasma characterization of water-confined laser shock at λ = 532, 1029 and 1053 nm, ∆T = 7, 10, 20, and 40 ns for pure aluminum, thickness = 500 µm. Laser parameter λ = 523 nm − ∆T = 7 ns nm—∆T = 10 nsλ = 1029 λ = 1053 nm—∆T = 10 ns λ = 1053 nm—∆T = 20 ns λ = 1053 nm—∆T = 40 ns Breakdown threshold (GW cm−2) 8–10 5–6 5–6 3–4 2–3 Breakdown threshold (J/cm−2) 56–70 50–60 50–60 60–80 80–120
Ablation pressure at the threshold (GPa)
7.2–8.2 4.7–5.2 4.7–5.2 3.6–4.2 2.9–3.6
Range of simulated intensities (GW cm−2)
2.5-6.0 // 1.3-5.0 1.5-2.3 0.8-2.0
Plasma temperature range (eV) 10–14 // 8–12 10–12 8–13
Range of plasma thickness (µm) 8–12 // 9-13 17-20 20-30
Range of ablated aluminum thickness (µm)
1.7–3.0 // 2.2–2.3 3.5-3.9 3.2-5.5
the plasma produced (table 2). We have presented analytic fits of the temporal pressure profiles that can be used in any mechanical simulation software to simulate the behavior of aluminum targets under laser shock. In a future investigation, the influence of changing the pulse duration and spatial shape at 532 nm will be investigated.
Appendix A. Parameters for temporal pressure profile scaling law
A.1. Direct illumination regime
The parameters Pmax, Pi(pressure at time equals Ti), p, n and
δ (figure13) were adjusted for the entire intensity and pulse duration range. The results are given below, with I and Tpulin
ns and GW cm−2, respectively.
Pmax= 0.56 + 0.08 I− 3.2 × 10⁻⁴I2for I≤ 100 (A1)
Pmax= 2.52 + 0.0238 I for I≥ 100 (A2)
Pm= 0.092 I0.623for I≤ 100 (A3) Pm= 0.162 + 0.0166 I for I≥ 100 (A4) p = ln(PmaxP m ) ln ( 40 T0 ) . (A5)
The parameters Pmax and p do not depend on the pulse
duration, therefore they were adjusted for the longest pulse duration, i.e 40 ns. The minimal pressure, Pm, corresponds to
the pressure obtained at the end of this pulse duration. The other three parameters related to the relaxation, Pi, n, and δ
are given by the following equations. They depend on the pulse duration Tpul.
Pi= 0.11 + 0.011I∗ for I∗≤ 240 − 3.4 Tpul (A6)
Pi= (2.79− 0.09 Tpul+ 1.12× 10⁻³T2pul) + 2× 10⁻³I∗ (A7)
for I∗≥ 240 − 3.4 Tpul I∗= (1.1− 9.76 × 10⁻³Tpul)I (A8) n =(0.5 + 1.76× 10⁻²Tpul ) e− ( I∗∗−115 100 )2 (A9) +1.14− 1.06 × 10⁻²Tpul+ 1.37× 10⁻⁴T2pul δ = 0.83−(0.467− 2.45 × 10⁻³Tpul +1.75× 10⁻⁴T2pul ) e− ( I∗∗−100 100 )2 (A10) I∗∗= (0.84 + 0.016Tpul) I. (A11) A.2. WCR at 532 nm, figure15 n = max ( 0.72; 0.72 ( Is I )0.25) (A12) δ = min ( 0.57; 0.57 +(0.16− 2.3 × 10⁻²Tpul +1.4× 10⁻³T2pul ) (I− Is) ) Is= 5.4− 0.22Tpul. ORCID iDs
Marine Scius-Bertrand https://orcid.org/0000-0002-2695-9557
References
[1] Antoun T, Seaman L, Curran D R, Kanel G I, Razorenov S V and Utkin A V 2003 Spall Fracture (New York: Springer) [2] Meyers M A 1994 Dynamic Behavior of Materials (New York:
Wiley)
[3] Clauer A H 2019 Laser shock peening, the path to production
Metals9 626
[4] Yuan J and Gupta V 1993 Measurement of interface strength by the modified laser spallation technique. i. experiment and simulation of the spallation process J. Appl. Phys.
74 2388–96
[5] Bolis C, Berthe L, Boustie M, Arrigoni M, Barradas S and Jeandin M 2007 Physical approach to adhesion testing using laser-driven shock waves J. Phys. D: Appl. Phys.
40 3155–63
[6] Ballard P, Fournier J, Fabbro R and Frelat J 1991 Residual stresses induced by laser-shocks J. Phys. IV (Proc.)
01 C3-487–94
[7] Fairand B P, Wilcox B A, Gallagher W J and Williams D N 1972 Laser shock-induced microstructural and mechanical property changes in 7075 aluminum J. Appl. Phys.
43 3893–5
[8] Peyre P, Fabbro R, Berthe L and Dubouchet C 1996 Laser shock processing of materials, physical processes involved and examples of applications J. Laser Appl.8 135–41
[9] Peyre P, Fabbro R, Merrien P and Lieurade H P 1996 Laser shock processing of aluminium alloys. Application to high cycle fatigue behaviour Mater. Sci. Eng. A210 102–13
[10] Clauer A H 1996 Laser shock peening for fatigue resistance
217 230
[11] Vossen J L 1978 Measurements of film-substrate bond strength by laser spallation Adhesion Measurement of Thin Films,
Thick Films and Bulk Coatings (Conshohocken, PA: ASTM
International) pp122–33
[12] Berthe L, Arrigoni M, Boustie M, Cuq-Lelandais J P, Broussillou C, Fabre G, Jeandin M, Guipont V and Nivard M 2011 State-of-the-art laser adhesion test (LASAT)
Nondestruct. Test. Eval.26 303–17
[13] Bardy S, Aubert B, Berthe L, Combis P, H´ebert D, Lescoute E, Rullier J-L and Videau L 2016 Numerical study of laser ablation on aluminum for shock-wave applications: development of a suitable model by comparison with recent experiments Opt. Eng., Bellingham56 011014
[14] Sagnard M, Ecault R, Touchard F, Boustie M and Berthe L 2019 Development of the symmetrical laser shock test for weak bond inspection Opt. Laser Technol.111 644–52
[15] Ecault R, Dominguez N and Voillaume H 2020 Laser Shock Adhesion test for composite bonding assessment Compos.
Struct.247 112441
[16] Mora P 1982 Theoretical model of absorption of laser light by a plasma Phys. Fluids25 1051–6
[17] Ambartsumyan R, Basov N, Boˇcko V, Zuev V, Krokhin O, Kryukov P, Senat-Skiˇc Y and Stoˇclov Y 1965 Heating of matter by focused laser radiation Sov. J. Exp. Theor. Phys.
21 1061–4
[18] Anderholm N C 1970 Laser-generated stress waves Appl.
Phys. Lett.16 113–15
[19] O’Keefe J D and Skeen C H 1972 Laser-induced stress-wave and impulse augmentation Appl. Phys. Lett.21 464–6
[20] Peyre P and Fabbro R 1995 Laser shock processing: a review of the physics and applications Opt. Quantum Electron.
27 1213–29
[21] Fabbro R, Fournier J, Ballard P, Devaux D and Virmont J 1990 Physical study of laser-produced plasma in confined geometry J. Appl. Phys.68 775–84
[22] Berthe L, Fabbro R, Peyre P, Tollier L and Bartnicki E 1997 Shock waves from a water-confined laser-generated plasma
J. Appl. Phys.82 2826–32
[23] Berthe L, Fabbro R, Peyre P and Bartnicki E 1998 Experimental study of the transmission of breakdown plasma generated during laser shock processing EPJ Appl.
Phys.3 215–18
[24] Sollier A, Berthe L and Fabbro R 2001 Numerical modeling of the transmission of breakdown plasma generated in water during laser shock processing EPJ Appl. Phys.16 131–9
[25] Le Bras C et al 2019 Laser shock peening: toward the use of pliable solid polymers for confinement Metals
9 1–13
[26] Tollier L, Fabbro R and Bartnicki E 1998 Study of the laser-driven spallation process by the velocity interferometer system for any reflector interferometry technique. I. Laser-shock characterization J. Appl. Phys.
83 1224–30
[27] Sano Y, Mukai N, Okazaki K and Obata M 1997 Residual stress improvement in metal surface by underwater laser irradiation Nucl. Instrum. Methods Phys. Res. B
121 432–6Materials Synthesis and Modification by Ion and/or Laser Beams
[28] Barker L M and Hollenbach R E 1972 Laser interferometer for measuring high velocities of any reflecting surface J. Appl.
Phys.43 4669–75
[29] Barker L M and Schuler K W 1974 Correction to the velocity-per-fringe relationship for the VISAR interferometer J. Appl. Phys. 45 3692–3
[30] Tollier L and Fabbro R 1998 Study of the laser-driven spallation process by the VISAR interferometry technique. II. Experiment and simulation of the spallation process J.
Appl. Phys.83 1231–7
[31] Divoky M et al 2020 Performance comparison of yb:yag ceramics and crystal gain material in a large-area, high-energy, high average–power diode-pumped laser Opt.
Express28 3636–46
[32] CUQ-LELANDAIS J-P 2010 Etude du comportement dynamique de mat´eriaux sous choc laser sub-picoseconde
PhD Thesis Ecole Nationale Sup´erieure de M´ecanique et
d’A´erotechique, Poitiers (http://www.theses. fr/2010ESMA0017)
[33] Boustie M, Cuq-Lelandais J P, Bolis C, Berthe L, Barradas S, Arrigoni M, de Resseguier T and Jeandin M 2007 Study of damage phenomena induced by edge effects into materials under laser driven shocks J. Phys. D: Appl. Phys.
40 7103–8
[34] Steinberg D J, Cochran S G and Guinan M W 1980 A constitutive model for metals applicable at high-strain rate
J. Appl. Phys.51 1498–504
[35] Bardy S, Aubert B, Bergara T, Berthe L, Combis P, H´ebert D, Lescoute E, Rouchausse Y and Videau L 2020
Development of a numerical code for laser-induced shock waves applications Opt. Laser Technol.124 105983
[36] Colombier J P, Combis P, Bonneau F, Le Harzic R and Audouard E 2005 Hydrodynamic simulations of metal ablation by femtosecond laser irradiation Phys. Rev.
B—Condens. Matter Mater. Phys.71 1–6
[37] Cuq-Lelandais J P, Boustie M, Berthe L, De Ress´eguier T, Combis P, Colombier J P, Nivard M and Claverie A 2009 Spallation generated by femtosecond laser driven shocks in thin metallic targets J. Phys. D: Appl. Phys.42 065402
[38] Palik E D 1998 Handbook of Optical Constants of Solids (New York: Academic) vol 3
[39] Spitzer L 2006 Physics of Fully Ionized Gases (New York: Dover Publications)
[40] Kedenburg S, Vieweg M, Gissibl T and Giessen H 2012 Linear refractive index and absorption
measurements of nonlinear optical liquids in the visible and near-infrared spectral region Opt. Mater. Express
2 1588–1611
[41] Clauer A H, Fairand B P and Wilcox B A 1977 Laser shock
hardening of weld zones in aluminum alloys Metallurgical
Trans. A8 1871–6
[42] Montross C S, Wei T, Lin Y, Clark G and Mai Y-W 2002 Laser shock processing and its effects on microstructure and properties of metal alloys: a review Int. J. Fatigue
![Table 1. Parameters used for the Steinberg–Cochran–Guinan (SCG) material model [34] with an aluminum target (99.999%, laminated).](https://thumb-eu.123doks.com/thumbv2/123doknet/7355566.213382/5.892.72.823.142.195/table-parameters-steinberg-cochran-guinan-material-aluminum-laminated.webp)