LETTER • OPEN ACCESS
Coherent signature of warming-induced extreme sub-continental boreal
wildfire activity 4800 and 1100 years BP
To cite this article: Martin P Girardin et al 2019 Environ. Res. Lett. 14 124042
View the article online for updates and enhancements.
LETTER
Coherent signature of warming-induced extreme sub-continental
boreal wild
fire activity 4800 and 1100 years BP
Martin P Girardin1,2,10,11 , Jeanne Portier2,3,10 , Cécile C Remy4,5,6 , Adam A Ali4,5 , Jordan Paillard4,7 , Olivier Blarquez7 , Hugo Asselin8 , Sylvie Gauthier1,2 , Pierre Grondin9
and Yves Bergeron2,4
1 Natural Resources Canada, Canadian Forest Service, Laurentian Forestry Centre, 1055 du PEPS, PO Box 10380, Stn. Sainte-Foy, Québec, QC, G1V 4C7, Canada
2 Centre for Forest Research, Université du Québec à Montréal, PO Box 8888, Stn. Centre-ville, Montréal, QC, H3C 3P8, Canada 3 Forest Resources and Management, Swiss Federal Institute for Forest, Snow and Landscape Research WSL, Zürcherstrasse 111, 8903
Birmensdorf, Switzerland
4 Forest Research Institute, Université du Québec en Abitibi-Témiscamingue and Université du Québec à Montréal, 445 boul. de l’Université, Rouyn-Noranda, QC, J9X 5E4, Canada
5 Institut des Sciences de l’Evolution—Montpellier, UMR 5554 CNRS-IRD-Université Montpellier-EPHE, Montpellier, France 6 Department of Biology, 1 University of New Mexico, Albuquerque, New Mexico, 87131-0001, United States of America
7 Département de Géographie, Université de Montréal, Pavillon 520 Chemin-de-la-Côte-Ste-Catherine, Montréal QC, H2V 2B8, Canada 8 School of Indigenous Studies, Université du Québec en Abitibi-Témiscamingue, 445 boul. de l’Université, Rouyn-Noranda, QC, J9X 5E4,
Canada
9 Direction de la recherche forestière, Ministère des Forêts, de la Faune et des Parcs du Québec, 2700 Einstein, Québec, QC, G1P 3W8, Canada
10 Authors contributed equally to the work.
11 Author to whom any correspondence should be addressed.
E-mail:martin.girardin@canada.ca
Keywords: Boreal forest, sedimentary charcoal, climate change, paleoecology, temperature Supplementary material for this article is availableonline
Abstract
Climate changes are expected to progressively increase extreme wildfire frequency in forests. Finding past
analogs for periods of extreme biomass burning would provide valuable insights regarding what the effects
of warming might be for tree species distribution, ecosystem integrity, atmospheric greenhouse gas balance,
and human safety. Here, we used a network of 42 lake-sediment charcoal records across a
∼2000 km
transect in eastern boreal North America to infer widespread periods of wildfire activity in association with
past climate conditions. The reconstructed
fluctuations in biomass burning are broadly consistent with
variations in ethane concentration in Greenland polar ice cores. Biomass burning
fluctuations also
significantly co-varied with Greenland temperatures estimated from ice cores, at least for the past 6000
years. Our retrospective analysis of past
fire activity allowed us to identify two fire periods centered around
4800 and 1100 BP, coinciding with large-scale warming in northern latitudes and having respectively
affected an estimated
∼71% and ∼57% of the study area. These two periods co-occurred with widespread
decreases in mean
fire-return intervals. The two periods are likely the best analogs for what could be
anticipated in terms of impacts of
fire on ecosystem services provided by these forests in coming decades.
Introduction
The Northern Hemisphere has recently experienced extreme wildfire seasons, which have burned extensive forest areas across the boreal biome. Notably, record-breaking warm and dry conditions during the summer of 2018 spurred historic wildfire outbreaks in Sweden, ranging across more than 24 310 ha of lands from north of the Arctic Circle to the southernmost county
of Scania(San-Miguel-Ayanz et al2019). The province
of British Columbia, Canada, faced the worst wildfire year on record during the summer of 2017, with 1.2 million ha having burned(Ansmann et al2018, Hu et al2019, Natural Resources Canada2018). During
the summer of 2010, intense drought and high temperatures caused several hundred wildfires in Russia, resulting in about 5 million hectares of burnt areas(Viatte et al2013). Such extreme fire activity can OPEN ACCESS
RECEIVED 29 May 2019 REVISED 7 November 2019 ACCEPTED FOR PUBLICATION 20 November 2019 PUBLISHED 9 December 2019
Original content from this work may be used under the terms of theCreative Commons Attribution 3.0 licence.
Any further distribution of this work must maintain attribution to the author(s) and the title of the work, journal citation and DOI.
have important economic and social consequences, especially when it occurs in populated areas. Commu-nities must face evacuations, mental and physical health problems, damage to infrastructure, and dis-ruptions to business and industry(Bowman et al2011, Viatte et al2013, Landis et al2018). As an example, the
590 000 ha Fort McMurray Horse River wildfire in Alberta (Canada) during 2016 incurred the worst insured losses in Canadian history, destroying 2400 buildings(Statistics Canada2017, Sankey2018). Again
in Canada, massive wildfires during the summer of 2013 threatened a Cree community in northern Quebec, forcing its evacuation (Erni et al 2017, Sankey2018).
Human-caused climate changes, associated with warming and drying at high-latitudes, are expected to progressively increase the frequency of such extreme wildfires in the future, with important consequences for species distribution, ecosystem integrity, atmo-spheric greenhouse gas balance, and human safety (Flannigan et al2009, Oris et al2014, Gauthier et al
2015). Fire suppression agencies will be increasingly
overwhelmed(Bowman et al2017, Wotton et al2017).
Recently, an analysis offire weather climatology from 1979 to 2015, which used the North American Regio-nal ReaRegio-nalysis dataset and the Canadian Fire Weather Index System, has suggested an ongoing significant, increasing trend in fire-season length in eastern Canada(Jain et al2017). To date, detection of
tem-poral changes in the frequency(or in the return inter-val) of major wildfire activity remains a major challenge, owing to the short temporal coverage of cir-cumborealfire data (usually limited to post-1950), the large interannual and spatial variability in area that is burned, and evolving wildfire monitoring and report-ing methods, which tend to mask long-term and sub-tle changes that can be a consequence of changing climate(Krezek-Hanes et al2011, Waito et al2015).
The need for a comprehensive assessment of historical wildfire, climate, and vegetation at all scales, including enhanced datasets from historicalfire maps and synth-esis of climate, vegetation, andfire interactions from past climates, including past warm periods, was identi-fied as national priorities for building the capacity of wildlandfire science in the 2020s (Sankey2018).
Lake-sediment charcoal records are used to recon-struct long-termfire trends and analyze the sensitivity offire activity to various ecosystem and climatic cesses, and can ultimately improve our ability to pro-ject futurefire impacts (Heyerdahl et al2008, Girardin et al2013b, Waito et al2018). Charcoal particles that
are produced duringfire are transported by wind and runoff across landscapes and deposited in lake sedi-ments. They have been used to infer trends in typical (average) biomass burning and changes in fire-return intervals (FRIs) from local to hemispheric scale (Marlon et al 2012, Pellatt et al 2015, Waito et al
2015,2018). Here we extend the utility of these records
by demonstrating their applicability in distinguishing
synchronous fires or fire periods at the sub-con-tinental scale in an attempt to link widespread pulses of biomass burning and rapid warming during pre-industrial times. We illustrate our case with the use of a network of 42 lake-sediment charcoal records that cover the last 8400 years in central and eastern boreal North America. The retrospective analysis of pastfire activity allowed us to identify signals from two high-fire activity periods across the study area, dating from about 4800 and 1100 calibrated years before present (BP), and having occurred during climatic warming at high latitudes.
Data and methods
Forestfire data
Charcoal samples from 42 lake sediment cores were obtained from 14 studies sharing a common protocol of charcoal extraction(see the references listed in table S1 for details, andfigure S1 is available online atstacks.
iop.org/ERL/14/124042/mmedia for study
loca-tions). The network extends throughout the eastern North American boreal forest across a west-to-east transect of more than 2000 km, which covers three Canadian provinces(figure1(a); table S1). Forests in
this area developed during the Holocene, which began with the end of the most recent glaciation about 11 650 years BP(Dyke2004, Walker et al2018). During this
period, ice sheet margins retreated northeastward. As the glacier retreated, and following the disappearance of the proglacial Objibway Lake ca. 8200 BP, forest density increased withfire-adapted conifer tree species Picea becoming, and remaining, the dominant feature in boreal landscapes; together with Abies, broadleaved trees such as Acer were dominant in the mixedwood forests south of the study area(figure S2; Blarquez et al
2015). The average length of the sediment cores was
320 cm(table S1); in most cases, sampling had reached the contact between organic and mineral sediments, allowingfire histories to be traced back to the very beginning of the post-glacial afforestation period. All cores were sliced at contiguous 0.5 or 1.0 cm intervals to discernfire events at high temporal resolution. The analysis of a network offire activity records of this magnitude allowed us to achieve unequaled spatial and temporal resolution in this part of North America (i.e. Girardin et al2013a, Blarquez and Aleman2016).
Sediment accumulation chronologies were generated based on AMS radiocarbon dating of terrestrial plant macroremains and bulk gyttja samples, and 210Pb when available(table S1). 210Pb measurements were performed from the uppermost 10–20 cm of the cores.
210
Pb values were inferred by measuring the activity of the daughter product,210Po, by alpha spectrometry assuming an equal concentration between the two isotopes. The 210Pb concentrations were interpreted using the constant rate of supply model of 210Pb accumulation(Appleby and Oldfield 1978).14C dates
were calibrated using Bayesian models (Parnell et al
2008; Bchron R package) or ‘classical’ models
(Blaauw 2010; CLAM 2.2 program) based on the
IntCal13.14 C data set, as presented in original studies (Hua et al2013, Reimer et al2013). It has been shown
that the two models (Bayesian and ‘classical’) derive relatively equivalent chronologies(Blaauw2010) for the
studied time period(0–8450 BP; Wang et al2019) and
lakes(figure S3). Charcoal particles were measured and the resulting data were converted into charcoal accumu-lation rates(CHARraw; mm2cm−2yr−1) that were based
on numerical age-depth models to reconstruct pastfire frequencies for each lake(table S1). The dates of local fire events were extracted from the CHARrawseries using
CharAnalysis v1.1 software (Higuera et al 2010).
CHARrawseries were interpolated(CHARinterpolated) to
equal time steps based on the median time-resolution computed from the sediments for each lake(table S1). CHARinterpolated series were decomposed into a
low-frequency component (CHARbackground) and a
high-frequency component (CHARpeak). CHARbackground
results from long-distance burning or redeposition processes of charcoal particles that are unrelated to local fire occurrences. CHARbackground was estimated by
applying the LOWESS-smoother robust technique, and subtracted to CHARinterpolatedto obtain the CHARpeak
component. CHARpeakwas decomposed into two
sub-populations: CHARnoiserepresenting variability in
sedi-ment mixing and sampling, together with analytical and naturally occurring noise; and CHARfire representing
significant charcoal peaks (Gavin et al2006, Higuera et al
2010). For each peak, we used a Gaussian mixture
model to identify the CHARnoisedistribution according
to a locally-defined threshold. Signal-to-noise indices (Kelly et al 2011) and goodness-of-fit (Brossier et al 2014) were used to evaluate the effectiveness of the
discrimination between CHARfireand CHARnoiseand to
assess peak detection accuracy by comparing the empirical and fitted noise distributions, respectively (figure S4). Each CHARpeakthat exceeded the threshold
at the 99th percentile of the noise distribution was assumed to originate from a localfire event (Gavin et al
Figure 1.(a) Distribution of the sampled lakes (circles) within the 0.5°×0.5° study grid in eastern boreal North America. The background color illustrates thefire rotation (FR) for each cell that was computed for the 1959–1999 period using national fire data (data from Boulanger et al2014). (b) Proportion of cells in which the annual sum of area that burned (human- and lightning ignited)
exceeded the locally-defined extreme detection threshold, computed using data from the Canadian National Fire Database (hereafter, p̂CNFD), with 95% confidence intervals (shaded). A high p̂CNFDdenotes a year during which biomass burning occurred across an
extensive area. The dashed line is a 10 year window second-order polynomial smoothing. Canadian provinces under study: Manitoba (MB), Ontario (ON), and Quebec (QC).
2006, Higuera et al2011). Given the short fire rotations
in some parts of the study area (e.g. northwestern Quebec,figure 1), we recognize that some peaks may
include more than onefire (Higuera et al2011).
Forestfire data from the Canadian National Fire Database(Stocks et al2002) were used for this study to
described currentfire activity. The database contains information on the location, date of detection, size (ha), and cause (lightning or human) of all fires that were recorded in Canada, for the period 1959–2016. Starting from the 0.5°×0.5° grid covering the study area(figure1), we extracted all fires and computed the
annual area burned for each cell and year.
FRI and biomass burning
FRI is herein defined as the time that has elapsed between two successivefires that are deduced from CHARfire, and which are assumed to have occurred within a given landscape area. For each lake,fire dates were converted to FRIs by subtracting each date from the previous one.
CHARraw series were submitted to a min–max
normalization to remove biases that could result from differences in taphonomic processes between lakes. Normalized charcoal accumulation(CHARnorm) was
used as a proxy for biomass burning(Blarquez et al
2015). All FRI and CHARnormseries were extended at
both edges using a mirror reflection method in order to cover the beginning and the end of each series.
Weibull smoothing
To avoid overestimating the importance of singlefire events, the FRI distributions were smoothed indepen-dently for each lake using the two-parameter Weibull probability density distribution (Johnson and Gut-sell1994, Cyr et al2009) and a 5-observation moving
window. The b and c parameters, which respectively corresponded to the shape and scale parameters of the Weibull distribution, were estimated using thefitdist function of the ‘fitdistrplus’ R package (Delignette-Muller and Dutang2015). For each lake, we used a
gamma(Γ) function (Johnson and Gutsell 1994) to
calculate the mean of the Weibull distribution, where within each 5-observation window, the mean FRI was calculated as:
b c
Mean FRI= G⎜⎛1 +1 .⎟ 1 ⎝ ⎞⎠ ( ) Bootstrap replications(1000 iterations) were used to construct equi-tailed (1–2σ) confidence intervals for the estimated mean FRI within each window. For each window, the mean of the 1000 resulting values was defined as the Weibull-modeled mean FRI. Wei-bull-modeled mean FRIs were then reported along the time series for each lake(Cyr et al2009).
Kriging
Ordinary kriging(Cressie1990) was used to spatially
extrapolate changes in FRI and CHARnormduring the
Holocene to the entire study area at a 0.5°×0.5° resolution. Kriging is a linear approach to interpola-tion/extrapolation of responses, where values across thefield surface are determined in accordance with a given covariance structure, which is determined from those observations that are present (Cowtan and Way2014). The reconstructed values vary smoothly
and match the observed values at the coordinates of the observations; they approach the global mean as the distance from the nearest observation increases.
For each lake, values of the Weibull-modeled mean FRI and of the CHARnormwere extracted at a 50 year
time resolution from the corresponding distributions. A buffer with a 250 km radius was established around the lakes to delimit the perimeter of the study area, upon which a 0.5°×0.5° grid was superimposed. This pro-cess was repeated at each time step as the pool of lakes changed with time. Ordinary kriging was realized with nugget=0 and range=150 km, which were kept con-stant between time steps. The sill parameter was left unspecified in order for the algorithm to optimize its value at each time step. An exponential model was used tofit the semivariograms. Kriging was performed using the autoKrige function of the ‘automap’ R package (Hiemstra2009). The resulting FRIkrig(which
approx-imates the average FRI, in years, for a specific grid cell during a specific time period) and CHARkriggrids were
produced at a 50 year time resolution, and mapped at a 500 year time resolution.
For each 50 year time point, the mean value of all grid cells, along with the corresponding 95% con-fidence interval, were extracted and reported along the time series to produce the temporal variability of FRIkrigand CHARkrig. To do so, we examined the local
spatial structure of each 50 year time point by using Moran’s I spatial correlograms (moran.test function; R Core Team 2014), and calculated 95% confidence
interval after correcting for the effective degrees of freedom(n′) based on lag 1 autocorrelation estimates of Moran’s I (see Dale and Fortin2002). The advantage
of averaging the values of the grid cells, rather than the values of the lakes, is that regions where more lakes were sampled were not over-represented.
Extreme biomass burning detection
Extreme biomass burning was defined as periods during which CHARkrigexceeded a detection
thresh-old that was computed from the long-term median (MED) and the median of absolute distances to the median(MAD):
x( )i >MED( )x +zMAD ,( )x ( )2 with i=1, K , n, for a grid-cell’s CHARkrigrecord x of
size n time points(Hampel1985) (figures S5 and S6).
number of extreme events under analysis was arbitra-rily set to approximate the highest 15th percentile(a function of the distance to the median z, which varies by increments of 0.5). For this study, we set z=3. We preferred to use this extreme event detection method on CHARkrigrecords rather than using localfire events
that were detected using CharAnalysis software. Major fires that were identified by CHARrawpeak records can
lag actual fire dates by several decades; this is a common occurrence that is related to the timing of charcoal transport and deposition (Higuera et al
2005). The fire events are therefore diluted over time,
making the interpolation technique unreliable for such identification of individual events as it averages over noise present in their timing. Alternatively, exceedance of the detection CHARkrig threshold
indicates high inputs of CHARrawinto a lake, but does
not inform on the occurrence of a singlefire.
The sample proportion p̂, representing the frac-tion of grid cells k(an integer 0) of a given popula-tion n′ (an integer>0) that was identified positively as recording an extreme event, was computed for each sampled 50 year period from 8450 to 0 years BP. Bino-mial proportion confidence intervals (95% CIs) were computed using a Bayesian calculation with an unin-formative prior distribution(Brown et al2001). This
uncertainty estimate is important since n′ is unevenly distributed in time, and because small n′ or values of k that are close to 0 or 1 can lead to large errors in the estimation of p̂. The Bayesian approach that was used here (Jeffreys prior with Beta [1/2, 1/2]) has been shown to be particularly robust under small samples sizes, while also being well-suited for uncertainty esti-mation under large sample sizes.
The extreme event detection method was repeated on modern area burned data that were extracted from the Canadian National Fire Database, and for each cell over the 1959–2016 period. A year in a given grid cell was deemed as being extreme when the sum of its area burned exceeded the detection threshold set by equation (1) for the particular annual area burned
dataset for that particular cell.
Relationship with temperature and Greenland ethane levels
Seasonally unbiased and physically constrained Greenland Summit temperatures that covered the Holocene period, and which were inferred from argon and nitrogen isotopes in air trapped within a Green-land ice core(GISP2; Kobashi et al2017), were used to
infer associations between high-latitude temperature variability and biomass burning over the period 8400–0 BP. The Greenland temperature reconstruc-tion has been shown to be representative of hemi-spheric signals(Kobashi et al2017). It should be noted
that sampling density was not constant through the Holocene, such that uncertainty ranges of the recon-structed temperatures varied with time(Kobashi et al
2017). The relationship between paleoatmospheric
ethane in Greenland polar ice cores(Nicewonger et al
2018) and biomass burning was also examined.
Relationships between variables under study were examined using non-parametric stationary boot-strapped correlations (Mudelsee 2003) and wavelet
coherence(WTC) analyses (Grinsted et al2004). All
analyses accounted for the presence of serial auto-correlation in time series when testing for significance of relationships. The non-parametric stationary boot-strapped correlation technique resamples blocks of data pairs to account for the presence of serial(auto-) correlation in the time series. The confidence intervals (CI) allow testing whether the correlation between two serially dependent time series is significant. When the confidence interval contains zero, the hypothesis of ‘no correlation’ cannot be rejected at the 95% level. Where indicated, data were ranked prior to analysis to satisfy normality requirements for the correlation ana-lysis. In contrast, WTC examines the significance and magnitude of coherence(i.e. correlation) between two time series and, furthermore, reveals information about the phase relationship(delays) in a lag-period space(at a time and frequency localization). This ana-lysis of phase relationships is relevant in a context in which the direct correlations between variables may be difficult to assess due to dating uncertainties and offset paleorecords. For each time-series, the required fre-quency spectrum was constructed using continuous wavelet transform analysis. We used the Paul wavelet (order 4) as it is not very localized in frequency space, while allowing signals that are relatively aperiodic to be detected by the analysis(Moore et al2007). The
statis-tical significance level (90%) of the WTC against red noise backgrounds was estimated using Monte Carlo generated noise with 1000 surrogate data set pairs (having the same first-order autocorrelation coeffi-cients as the input datasets; see Grinsted et al2004).
WTC was executed using the R package ‘biwavelet’ version 0.20.11(Gouhier et al2018). For the purposes
of the correlation and WTC analyses, the paleoclimate data were resampled to a lower resolution of 50 year-time steps that was compatible with the CHAR records, using spline estimation; for the correlation with ethane levels in Greenland, biomass burning data were resampled to the time resolution of the ethane data(Software Autosignal).
In our next step in the analysis, spatial correlation maps(Von Storch and Zwiers1999) were created by
analysing the relationship between biomass burning, as computed from modernfire statistics, and gridded temperature data from the Climate Research Unit (CRU TS 4.2 data, resolution of 0.5° latitude × 0.5° longitude). Temperature data were averaged at the grid level over the April–September season. These ana-lyses were conducted using the KNMI Climate Explorer online research tool; all data were ranked prior to analysis(van Oldenborgh et al2008).
Addi-tionally, spatial correlation maps were created after analysing the relationship between the Greenland
temperature reconstruction and CHARkrig at each
grid cell.
Results and discussion
Multi-millennial spatiotemporal variability infire activity
Modernfire rotations (i.e. the time required to burn the equivalent of a specified area; period 1959–1999) range from 25 years to over 500 years across the study area(figure1(a); Boulanger et al2014). Of note is that
the area has seen an increase in the proportion(p̂) of its forests that have been affected by extreme biomass burning (i.e. area burned exceeded an empirical extreme detection threshold, see Data and Methods) during the AD 1980s, peaking in the early AD 1990s and then declining (figure 1(b); proportions were
computed using the Canadian National Fire Database, hereafter p̂CNFD; see Data and Methods). This
phenomenon was observed in analyses of both human-ignited and lightning-ignitedfires (figure S7). The years 1988 and 1995, for example, had particularly
high p̂CNFD(respectively 52% and 57% of grid cells),
distributed in all three provinces(figure S8).
We were interested in determining whether there were past analogs of such widespread biomass burning that could be reconstructed from lake-sediment char-coal records. We conducted spatially-interpolated reconstructions for the whole study area of the nor-malized charcoal (CHARkrig) accumulation rate,
which is representative of the amount of biomass burning, and of the mean FRI (FRIkrig), which is
defined as the average time that has elapsed between successivefire events for a specified 0.5° × 0.5° grid cell during a specified 50 year time period.
Holocene distributions of FRIkrig (figure 2) and
CHARkrig(figure3) exhibited high variability through
time. From ca. 8200 to 7800 BP, the study area experi-enced low FRIkrigand high biomass burning(figure4).
Following a period offluctuating FRIkrig, low biomass
burning lasted until about 6000 BP. FRIkrigwas longer in
the western sector and shorter in the eastern sector (figure2). Between 6000 and 4500 BP, FRIkrigdecreased
and biomass burning increased(figure2), as has been
previously observed in North America(Hu et al2006,
Figure 2. Spatial interpolation of thefire-return interval (FRIkrig) for 42 lakes from 8000 to 0 years before present (BP). Fire-return
interval is defined as the elapsed time between two fires that are assumed to have occurred within a landscape area. FRI was extracted for each lake at 500 year intervals, and spatially interpolated using ordinary kriging. The estimated distribution of the Laurentian Ice sheet(Dyke et al2003) is also illustrated using a conversion from radiocarbon estimated dates to calibrated calendar ages (Reimer
Ali et al2009, Girardin et al2013a). Between 4500 and
2500 BP,fire activity was at its highest (figures2–4). The
amount of biomass burning fluctuated but remained relatively high, on average(figure4(c)). FRIkrigthen
gra-dually increased until 1000 BP, especially in the north-central part of the study area (figure 2), as has been
shown by previous studies(Girardin et al2013b, Blar-quez et al 2015). From 1000 to 250 BP, FRIkrigalso
increased in the south-central part of the study area (figure2), while remaining relatively high and constant
elsewhere. During this period, biomass burning decreased. After 250 BP, we observed an increase in bio-mass burning and a decrease in FRIkrig(figure4). A
posi-tive trend in biomass burning during 1750–1950 AD, roughly coinciding with the transition from the Pre-Industrial period to the Anthropocene(~1950 AD), was found across 49% of the area, but mostly limited to the western half(figure S9). Notable fluctuations in biomass burning since 1000 BP are broadly consistent with inde-pendent estimates of biomass burning emissions that were recently obtained from paleoatmospheric ethane in Greenland polar ice cores(figures 4(c) and S10; data
from Nicewonger et al2018). Biomass burning is one of
two important sources of ethane in the preindustrial
atmosphere(Nicewonger et al2018). This demonstrates
the relevance of the information that can be deduced from lake-sediment data for large-scale environmental issues: the correlation between the two independent records implies thatfire activity in the study area is an important source for fire emissions transport into Greenland(Kehrwald et al2012).
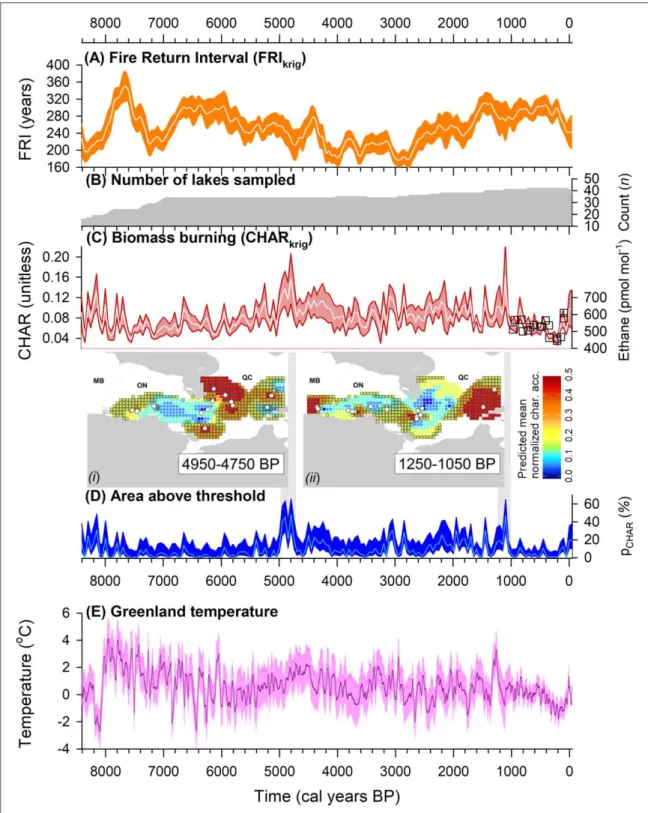
Embedded within this long-term variability are two periods of very-high biomass burning, each last-ing about two centuries (figure 4(d)): from 4950 to
4750 BP and from 1250 to 1050 BP. In both cases, the p̂ proportions of cells with CHARkrig values exceeding
local extreme detection thresholds(hereafter p̂CHAR;
see Data and Methods) were significantly elevated above overall background variability (figure 4(a)).
These CHARkrigperiods are not likely to be related to
single large or severe fire events (i.e. biomass con-sumed per unit area), given that they occur simulta-neously with decreases of FRIkrig (figure 4(a)). This
observation implies that multiplefires marked both periods over the affected regions. During the period of 4950 to 4750 BP, p̂CHARcovered 71% of the study area,
mostly in the eastern sector (see inset maps of figure 4(d)). CHARkrig values also exceeded the
Figure 3. Spatial interpolation of normalized charcoal(CHARkrig) accumulations for 42 lakes from 8000 to 0 years before present
(BP). CHARkrigwas extracted for each lake at 500 year intervals, and spatially interpolated using ordinary kriging. The estimated
distribution of the Laurentian Ice sheet(Dyke et al2003) is also illustrated using a conversion from radiocarbon estimated dates to
detection threshold in 15 individual lake-sediment charcoal records(i.e. 45% of lakes) that were located in eastern and western parts of the study area(see inset
maps offigure 4(d)). From 1250 to 1050 BP, p̂CHAR
covered 57% of the study area(figure4(d)). CHARkrig
values exceeding the threshold were also found in 15 of
Figure 4.(a)–(c) Reconstructions of fire-return interval (FRIkrig) and biomass burning (CHARkrig) averaged at the sub-continental
scale.(a) FRI was extracted for each lake at 50 year intervals, spatially interpolated using ordinary kriging, and here averaged across the whole study area. The shading is indicative of the 95% confidence intervals (95% CI) for the averaged quantities, after adjusting the sample size to an effective degree of freedom. The number of lake-sediment charcoal records at a given time is shown in(b). (c) Same as(a) but for the normalized charcoal (CHARnorm) accumulation. The squares illustrate the distribution of Greenland ice core ethane
levels from(Nicewonger et al2018) and are used as an independent fire proxy for benchmarking (also see figure S10 for a zoom of the
last 1000 years). The two records are significantly correlated with r=0.62 and bootstrap 95% CI [0.16, 0.86]. (d) Percent of the study area for which grid-cell CHARkrigexceeded locally-defined extreme detection thresholds at 50 year intervals (p̂CHAR), with 95%
confidence intervals. The gray vertical bars delineate two periods during which a high percent of the study area underwent extreme biomass burning, i.e. 4950–4750 and 1250–1050 years BP. The inset maps show the distribution of those grid cells (outline in black) in which CHARkrig(color shading) exceeded extreme detection thresholds. Also, circles were added to illustrate the distribution of
sampled lakes in which CHARinterpolatedvalues, of the specified period, exceeded the extreme detection threshold specific to each lake.
(e) Reconstructed mean annual Greenland temperatures, in anomalies relative to averages of 1951–1980, with 2 σ error ( °C; Kobashi et al2017).
the sampled lakes(38% of lakes; figure4(d)). For this
particular period, biomass burning occurred across many regions, stretching from the prairie-boreal eco-tone to the easternmost boreal forests.
Aside from these two periods, the period 3100–2850 BP also stands out as having had a high fire activity (figure4). In particular, we find FRIs among the lowest
recorded. It should be noted that although an increase in CHARkrigoccurred at the beginning of the Industrial Era,
the proportion of cells exceeding the detection limit dur-ing the modern period was within the range of back-ground variability(figure4(d)).
Signatures of warming-induced extremefire activity Biomass burning is the result of additive effects of temperature, seasonal drought severity, duration of the snow-free period(equivalent to fire season length), and fuel availability(Molinari et al2018, Chaste et al
2019). To our knowledge, evidence for a
past-temper-ature influence on spatially widespread periods of high fire activity is lacking for our study area. To examine whether this effect was plausible, we analyzed the correlation between the metric p̂CNFD during
1959–2016 (data from figure1(b)) and
April–Septem-ber mean land temperatures(see Data and Methods). We found that p̂CNFDco-varied in a positive manner
with large-scale mean April–September warming at high latitudes, including over Greenland(figure 5).
This positive covariance between fire-affected areas and Greenland temperature sets the basis for exploring relationships between past widespread boreal fire activity and multi-decadal temperature reconstruc-tions covering the Holocene from Greenland ice cores (Kobashi et al2017;figure4(e)). Consistent with the
analysis of modernfire and temperature data, wavelet coherence (WTC) analysis between the Greenland
Figure 5. Correlation coefficient r between p̂CNFDand gridded mean April–September temperature, 1959–2016. Orange to red colors
indicate areas with high correlations. Areas in gray are not significant (P>0.05).
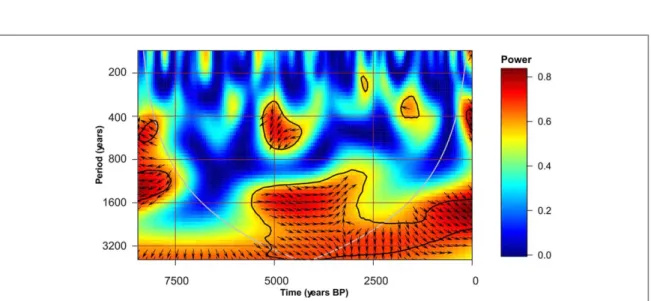
Figure 6. Wavelet coherence(WTC) between p̂CHARand the Greenland temperature reconstruction. Areas of large common power
values in time and period(i.e. at a given time and periodicity in units of years) between p̂CHARand temperature data are shown in red.
The 90% significance level against red noise is shown as a thick contour. The gray line delineates the ‘cone of influence’ where zero padding has reduced the variance. The relative phase relationship is shown by arrows, with in-phase pointing right, antiphase pointing left, temperature leading p̂CHARby 90° (1/4k) pointing down, and p̂CHARleading temperature by 90° (1/4k) pointing up. In-phase and
temperature reconstruction and the p̂CHAR record
indicated areas of significant and almost in-phase correlation at periodicities of>800 years per cycle since 6000 BP (i.e. p̂CHAR generally lagging behind
temperature;figure6). High power was also noticeable
during periods approximating those of high biomass burning, i.e.∼4250 to 5250 and ∼1750 to 1250 BP at periodicities of about 400 years per cycle(albeit given the implied coarseness of the temporal resolution of thefire record, information that can be obtained is likely to be limited at such frequency).
Non-parametric stationary bootstrapped correlations that were computed for the last 6000 years BP corroborated the WTC correlation for that period with r=0.20 and 95% CI[0.05; 0.37] (about the same correlation was found between the global averages of CHARkrigvalues
and Greenland temperature: r= 0.24 with 95%CI [0.04, 0.47]). Hence, p̂CHAR significantly co-varied
with Greenland temperaturefluctuations, at least for the past 6000 years. The reason for low concordance between fire activity and the thermal maximum of 8000–6500 BP (Kobashi et al2017, Bajolle et al2018,
Figure 7. Correlation coefficient r between Greenland temperature reconstruction and gridded CHARkrigover periods(a) 8000–0
years BP,(b) 6000–0 years BP, and (c) 2000–0 yes BP. The maps were created from projecting correlation values that were computed at each grid point covered by the CHARkrigdata and the Greenland temperature reconstruction. Orange to red colors indicate areas with
high positive correlations; delineated areas are significant with P<0.05 (determined from an effective degree of freedom for temporal autocorrelation in the data(von Storch and Zwiers 1999).
Porter et al2019) remains to be elucidated. It could be
hypothesized that relatively low biomass burning from 7500 to 6500 BP was the result of cold air masses associated with the remaining ice sheet in northern Quebec (Dyke 2004, Marsicek et al 2018, Liu et al
2014) (figures1and S13), humid conditions and high
lake levels across large areas of eastern North America (Hély et al2010, theirfigure3(e)), and higher biomass
of less fire-prone deciduous tree species, notably Betula and Populus(Girardin et al2013a, Blarquez and Aleman2016,figure S2). All these factors could have contributed to reduce spreading of crownfires.
It should be noted that the relationship between CHARkrigand temperature is not homogeneous across
the study area(figure7). It is a dominant feature of the
easternmost sectors, and during the last 2000 years or so, it encompassed a larger part of the study area (figure7(c), also see figures S11 and S12). Note also,
that the pattern of temperature and CHARkrig
correla-tion over the last 2000 years(figure7(c)) is similar to
the pattern of linear trends of CHARkrigfrom 200 to 0
BP(figure S9). It is likewise similar to the pattern of correlation between p̂CNFDand gridded mean
April-September temperatures for 1959–2016 (figure 5).
From these observations, it appears to be a region in the center of the study area, southeast of James Bay, which emerges from the ensemble where CHARkrig
temporal trajectories do not co-occur with high lati-tude temperatures. It was previously postulated that precipitation patterns and changes in the composition of forest landscapes were the main factors that would influence the fire activity trajectories below James Bay, as opposed to direct effects of warming onfire (Gir-ardin et al2009,2013a). The decoupling of
temper-ature and CHARkrigtrajectories in that particular area
adds credibility to this thesis.
Two periods of high sub-continental biomass burning and p̂CHAR(i.e. 4950–4750 BP and 1250–1050
BP) are found during some of the periods of warmest Holocene temperatures in Greenland (respectively about +2.4 °C and +3.4 °C above the 1951–1980 baseline;figure4(e); Kobashi et al2017). Both periods
coincide with positive temperature anomalies that have been inferred from chironomid assemblages in eastern boreal North American lakes(∼+2.1 °C and 2.2°C above baseline (Bajolle et al2018,figure S11). Although the two high wildfire periods that have been identified herein had high temperatures in common, they developed under different precipitation and vege-tation contexts. On one hand, the 4950–4750 BP epi-sode occurred during a warm and dry period (Blarquez et al 2015, Karmakar et al 2015). On the
other hand, the 1250–1050 BP episode occurred close to the short Medieval Climate Anomaly during a peak of high temperatures (PAGES 2k Consortium2013, Kobashi et al 2017, Bajolle et al 2018, figure S11) within the otherwise cold and moist Neoglacial period (Viau and Gajewski2009, Blarquez et al2015, Karma-kar et al2015). To this may be added a third period, i.e.
3100–2850 BP and marked by low FRIs, which could fit into the warm anomaly of about 3400–2800 BP.
Our results covering past and modern times thus indicate that forest fires in the study area can be responsive to rapid warming at high latitudes. This is all the more important considering the changes that are currently underway in the North Atlantic basin. The p̂CNFDexhibits a drop in 1992–1993, consistent
with high-latitude cooling caused by the eruption of Mount Pinatubo(Parker et al1996), followed by an
increase until 2005 that is consistent with Greenland warming(figure S14). For the most recent 11 years on record (2005–2016), Greenland temperature has exhibited a slightly decreasing trend consistent with northern North Atlantic-wide cooling during that per-iod(figure S15) and a slowdown of the Atlantic Ocean overturning circulation(Thornalley et al2018). The
proportion of forest that was affected by extreme bio-mass burning also declined during this period (figures1and S7). Clearly, a better understanding of
the future decadal temperature variations in the Atlan-tic(e.g. Liu et al2017) is of paramount importance in
improving future boreal wildfire predictions in eastern boreal North America. Contextually, the spatial /tem-poral dimensions of warming and fire therein are likely to differ from other boreal regions of western North America where temperatures since the mid-20th century appear to be exceptionally warm in com-parison with the last 13 000 years(Marsicek et al2018; Porter et al2019).
Conclusion
Our retrospective analysis, which was based upon a network of lake-sediment charcoal records, allowed us to identify two periods of widespread biomass burning across eastern North American boreal forests at 4950–4750 BP and 1250 to 1050 BP. Both periods coincided with positive temperature anomalies over Greenland (+2 °C to +3 °C above baseline) and are likely the best analogs for what could be anticipated in terms of impacts on fire in coming decades (mid-century) across much of eastern boreal North America as a consequence of human-caused climate changes (approximately +2 °C to +4 °C above the 1951–1980 baseline by 2040 for that particular area according to Chaste et al2019). On the other hand, it is not to be ruled
out that end-of-this-century conditions could exceed anything experienced in the Holocene (including the warm early-mid Holocene) and that the best analogs could likely come from more ancient periods(Burke et al
2018). We recommend that future studies aiming at
clarifying the spatial/temporal dimensions of a high fire period in the past focus on very-high resolution charcoal and pollen collections targeting the sediment horizons spanning such events. Their detailed documentation could provide valuable insights regarding the effects of widespread burning on vegetation composition, boreal
forest dynamics, and the carbon cycle. The capacity of boreal conifer tree species to maintain themselves, for boreal carbon stocks to recover, and for ecosystem services to be maintained in face of multiple fire disturbances could be better evaluated on the basis of these empirical data. This would also offer new opportu-nities to benchmark dynamic global vegetation model simulations. Such comprehensive analysis of past climate change impacts on fire activity, including past warm periods, is needed to inform future predictions of how changes in extreme wildfires could transform existing forest ecosystems(Sankey2018).
Acknowledgments
This work was made possible thanks to financial support from the Strategic Grant and Discovery Programs of the Natural Sciences and Engineering Research Council of Canada (NSERC), and the Canadian Forest Service. We thank William J Parsons for the editing of the manuscript, and two anonymous reviewers for their comments on an earlier version.
Data availability statement
The data that support thefindings of this study are available from the corresponding author upon reason-able request.
ORCID iDs
Martin P Girardin
https://orcid.org/0000-0003-0436-7486
Jeanne Portier https: //orcid.org/0000-0002-9706-5155
Cécile C Remy
https://orcid.org/0000-0003-1231-0498
Hugo Asselin https: //orcid.org/0000-0002-9542-4994
Sylvie Gauthier https: //orcid.org/0000-0001-6720-0195
Yves Bergeron
https://orcid.org/0000-0003-3707-3687
References
Ali A A, Carcaillet C and Bergeron Y 2009 Long-termfire frequency variability in the eastern Canadian boreal forest: the influences of climate versus local factors Glob. Change Biol.15 1230–41
Ansmann A, Baars H, Chudnovsky A, Mattis I, Veselovskii I, Haarig M, Seifert P, Engelmann R and Wandinger U 2018 Extreme levels of Canadian wildfire smoke in the stratosphere over central Europe on 21–22 August 2017 Atmos. Chem. Phys.18 11831–45
Bajolle L, Larocque-Tobler I, Gandouin E, Lavoie M, Bergeron Y and Ali A A 2018 Major postglacial summer temperature changes in the central coniferous boreal forest of Quebec(Canada) inferred using chironomid assemblages J. Quat. Sci.33 409–20
Blaauw M 2010 Methods and code for‘classical’ age-modelling of radiocarbon sequences Quat. Geochronol.5 512–8
Blarquez O and Aleman J C 2016 Tree biomass reconstruction shows no lag in postglacial afforestation of eastern Canada Can. J. For. Res.46 485–98
Blarquez O, Ali A A, Girardin M P, Grondin P, Fréchette B, Bergeron Y and Hély C 2015 Regional paleofire regimes affected by non-uniform climate, vegetation and human drivers Sci. Rep.5 13356
Boulanger Y, Gauthier S and Burton P J 2014 A refinement of models projecting future Canadianfire regimes using homogeneousfire regime zones Can. J. For. Res.44 365–76
Bowman D M J S, Williamson G J, Abatzoglou J T, Kolden C A, Cochrane M A and Smith A M S 2017 Human exposure and sensitivity to globally extreme wildfire events Nat. Ecol. Evol.1 1–6
Bowman D M J S et al 2011 The human dimension offire regimes on Earth J. Biogeogr.38 2223–36
Brossier B, Oris F, Finsinger W, Asselin H, Bergeron Y and Ali A A 2014 Using tree-ring records to calibrate peak detection in fire reconstructions based on sedimentary charcoal records Holocene24 635–45
Brown L D, Cai T T and DasGupta A 2001 Interval estimation of binomial proportion Stat. Sci.16 101–17
Burke K D, Williams J W, Chandler M A, Haywood A M, Lunt D J and Otto-Bliesner B L 2018 Pliocene and Eocene provide best analogs for near-future climates Proc. Natl Acad. Sci.115 13288–93
Chaste E, Girardin M P, Kaplan J O, Bergeron Y and Hély C 2019 Increases in heat-induced tree mortality could drive reductions of biomass resources in Canada’s managed boreal forest Landsc. Ecol.34 403–26
Cowtan K and Way R G 2014 Coverage bias in the HadCRUT4 temperature series and its impact on recent temperature trends Q. J. R. Meteorol. Soc.140 1935–44
Cressie N 1990 The origins of kriging Math. Geol.22 239–52
Cyr D, Gauthier S, Bergeron Y and Carcaillet C 2009 Forest management is driving the eastern North American boreal forest outside its natural range of variability Front. Ecol. Environ.7 519–24
Dale M R T and Fortin M-J 2002 Spatial autocorrelation and statistical tests in ecology Ecoscience9 162–7
Delignette-Muller M-L and Dutang C 2015fitdistrplus : An R Package forfitting distributions J. Stat, Softw.64 1–84
Dyke A S 2004 An outline of North American deglaciation with emphasis on central and northern Canada Quaternary Glaciations-Extent and Chronology, Part II: North America vol 2(Amsterdam: Elsevier)pp 373–424
Dyke A S, Moore A and Robertson L 2003 Deglaciation of North America, Open File 1574(Ottawa, Canada: Geological Survey of Canada) (https://doi.org/10.4095/214399)
Erni S, Arseneault D, Parisien M-A and Bégin Y 2017 Spatial and temporal dimensions offire activity in the fire-prone eastern Canadian taiga Glob. Change Biol.23 1152–66
Flannigan M D, Krawchuk M A, De Groot W J, Wotton B M and Gowman L M 2009 Implications of changing climate for global wildlandfire Int. J. Wildl. Fire18 483–507
Gauthier S, Bernier P, Kuuluvainen T, Shvidenko A Z and Schepaschenko D G 2015 Boreal forest health and global change Science349 819–22
Gavin D G, Hu F S, Lertzman K and Corbett P 2006 Weak climatic control of stand-scalefire history during the Late Holocene Ecology87 1722–32
Girardin M P, Ali A A, Carcaillet C, Blarquez O, Hély C, Terrier A, Genries A and Bergeron Y 2013a Vegetation limits the impact of a warm climate on boreal wildfires New Phytol.199 1001–11
Girardin M P, Ali A A, Carcaillet C, Gauthier S, Hély C, Le Goff H, Terrier A and Bergeron Y 2013b Fire in managed forests of eastern Canada: risks and options For. Ecol. Manage.294 238–49
Girardin M P, Ali A A, Carcaillet C, Mudelsee M, Drobyshev I, Hély C and Bergeron Y 2009 Heterogeneous response of circumboreal wildfire risk to climate change since the early 1900s Glob. Change Biol.15 2751–69
Gouhier T C, Grinsted A and Gouhier M T C 2018 Package ‘biwavelet’: conduct Univariate and Bivariate Wavelet Analyses(https://cran.r-project.org/web/packages/ biwavelet/biwavelet.pdf)
Grinsted A, Moore J C and Jevrejeva S 2004 Application of the cross wavelet transform and wavelet coherence to geophysical time series Nonlinear Process. Geophys. Eur. Geosci. Union11 561–6
Hampel F R 1985 The breakdown point of the mean combined with some rejection rules Technometrics27 95–107
Hély C, Girardin M P, Ali A A, Carcaillet C, Brewer S and Bergeron Y 2010 Eastern boreal North American wildfire risk of the past 7000 years: a model-data comparison Geophys. Res. Lett.37 L14709
Heyerdahl E K, Mckenzie D, Daniels L D, Hessl A E, Littell J S and Mantua N J 2008 Climate drivers of regionally synchronous fires in the inland Northwest (1651–1900) Int. J. Wildl. Fire17 40–9
Hiemstra P, Pebesma E J, Twenhöfel C J W and Heuvelink G B M 2009 Real-time automatic interpolation of ambient gamma dose rates from the Dutch radioactivity monitoring network Computers and Geosciences35 1711–21
Higuera P E, Chipman M L, Barnes J L, Urban M A and Hu F S 2011 Variability of tundrafire regimes in Arctic Alaska: millennial-scale patterns and ecological implications Ecol. Appl.21 3211–26
Higuera P E, Gavin D G, Bartlein P J and Hallett D J 2010 Peak detection in sediment—charcoal records : impacts of alternative data analysis methods onfire-history interpretations Int. J. Wildl. Fire19 996–1014
Higuera P E, Sprugel D G and Brubaker L B 2005 Reconstructingfire regimes with charcoal from small-hollow sediments: a calibration with tree-ring records offire Holocene15 238–51
Hu F S, Brubaker L B, Gavin D G, Higuera P E, Lynch J A, Rupp T S and Tinner W 2006 How climate and vegetation influence the fire regime of the Alaskan boreal biome: the holocene perspective Mitig. Adapt. Strateg. Glob. Change11 829–46
Hu Q et al 2018 A study of long-range transported smoke aerosols in the Upper Troposphere/Lower Stratosphere Atmos. Chem. Phys.19 1173–93
Hua Q, Barbetti M and Rakowski A Z 2013 Atmospheric radiocarbon for the period 1950–2010 Radiocarbon55 2059–72
Jain P, Wang X and Flannigan M D 2017 Trend analysis offire season length and extremefire weather in North America between 1979 and 2015 Int. J. Wildl. Fire26 1009–20
Johnson E A and Gutsell S L 1994 Fire frequency models, methods and interpretations Adv. Ecol. Res.25 239–87
Karmakar M, Laird K R and Cumming B F 2015 Diatom-based evidence of regional aridity during the mid-Holocene period in boreal lakes from northwest Ontario(Canada) Holocene25 166–77
Kehrwald N, Zangrando R, Gabrielli P, Jaffrezo J L, Boutron C, Barbante C and Gambaro A 2012 Levoglucosan as a specific marker offire events in Greenland snow Tellus B64 18196
Kelly R F, Higuera P E, Barrett C M and Hu F S 2011 Short paper: a signal-to-noise index to quantify the potential for peak detection in sediment–charcoal records Quat. Res.75 11–7
Kobashi T et al 2017 Volcanic influence on centennial to millennial Holocene Greenland temperature change Sci. Rep.7 1–10
Krezek-Hanes C C, Ahern F, Cantin A and Flannigan M D 2011 Trends in largefires in Canada, 1959–2007. Canadian biodiversity: ecosystem Status and Trends 2010 Technical Thematic Report No. 6(Ottawa, ON: Northern Forestry Centre)
Landis M S, Edgerton E S, White E M, Wentworth G R, Sullivan A P and Dillner A M 2018 The impact of the 2016 Fort McMurray Horse River Wildfire on ambient air pollution levels in the Athabasca Oil Sands Region, Alberta, Canada Sci. Total Environ.618 1665–76
Liu W, Xie S-P, Liu Z and Zhu J 2017 Overlooked possibility of a collapsed Atlantic Meridional Overturning Circulation in warming climate Sci. Adv.3 e1601666
Liu Z, Lu Z, Wen X, Otto-Bliesner B L, Timmermann A and Cobb K M 2014 Evolution and forcing mechanisms of El Niño over the past 21,000 years Nature515 550–3
Marlon J R et al 2012 Long-term perspective on wildfires in the western USA Proc. Natl Acad. Sci.109 E535–43
Marsicek J, Shuman B N, Bartlein P J, Shafer S L and Brewer S 2018 Reconciling divergent trends and millennial variations in Holocene temperatures Nature554 92–6
Molinari C, Lehsten V, Blarquez O, Carcaillet C, Davis B A S, Kaplan J O, Clear J and Bradshaw R H W 2018 The climate, the fuel and the land use: Long-term regional variability of biomass burning in boreal forests Glob. Change Biol.24 4929–45
Moore J, Grinsted A and Jevrejeva S 2007 Evidence from wavelet lag coherence for negligible solar forcing of climate at multi-year and decadal periods Nonlinear Dynamics in Geosciences(New York, NY: Springer)pp 457–64
Mudelsee M 2003 Estimating Pearson’s correlation coefficient with bootstrap confidence interval from serially dependent time series Math. Geol.35 651–65
Natural Resources Canada 2018 The state of Canada’s forests Annual Report 2018(Ottawa: Natural Resources Canada, Canadian Forest Service)
Nicewonger M R, Aydin M, Prather M J and Saltzman E S 2018 Large changes in biomass burning over the last millennium inferred from paleoatmospheric ethane in polar ice cores Proc. Natl Acad. Sci.115 12413–8
Oris F, Asselin H, Ali A A, Finsinger W and Bergeron Y 2014 Effect of increasedfire activity on global warming in the boreal forest Environ. Rev.22 206–19
PAGES 2k Consortium 2013 Continental-scale temperature variability during the past two millennia Nat. Geosci.6 339–46
Parker D E, Wilson H, Jones P D, Christy J R and Folland C K 1996 The impact of Mount Pinatubo on world-wide temperatures Int. J. Climatol.16 487–97
Parnell A C, Haslett J, Allen J R M, Buck C E and Huntley B 2008 A flexible approach to assessing synchroneity of past events using Bayesian reconstructions of sedimentation history Quat. Sci. Rev.27 1872–85
Pellatt M G, McCoy M and Mathewes R W 2015 Paleoecology and fire history of garry oak ecosystems in canada: implications for conservation and environmental management Biodivers. Conserv.24 1621–39
Porter T J, Schoenemann S W, Davies L J, Steig E J, Bandara S and Froese D G 2019 Recent summer warming in northwestern Canada exceeds the Holocene thermal maximum Nat. Commun.10 1631
R Core Team 2014 R: A language and environment for statistical computing(Vienna, Austria: R Foundation for Statistical Computing) (http://R-project.org/)
Reimer P J et al 2013 IntCal13 and Marine13 radiocarbon age calibration curves 0–50 000 years cal BP Radiocarbon55 1869–87
Sankey S 2018 Blueprint for wildlandfire science in Canada (2019–2029) (Edmonton, Alberta: Natural Resources Canada, Canadian Forest Service, Northern Forestry Centre) San-Miguel-Ayanz J, Durrant T, Boca R, Libertà G, Branco A,
de Rigo D, Ferrari D, Maianti P, Artés Vivancos T, Oom D, Pfeiffer H, Nuijten D and Leray T 2018 Forest Fires in Europe, Middle East and North Africa 2018(Italy: Joint Research Centre, European Commission, Ispra(VA)) (https://doi. org/10.2760/1128)
Statistics Canada 2017 Infographic: Fort McMurray 2016 Wildfire —Economic Impact. (Ottawa, ON: Statistics Canada) Stocks B J et al 2002 Large forestfires in Canada, 1959–1997
J. Geophys. Res.108 8149
Thornalley D J R et al 2018 Anomalously weak Labrador Sea convection and Atlantic overturning during the past 150 years Nature556 227–30
van Oldenborgh G J, Coelho C A S and Doblas-Reyes F J 2008 Exploratory analysis and verification of seasonal forecasts with the KNMI climate explorer ECMWF Newsl. 116 4–5
Viatte C, Strong K, Paton-Walsh C, Mendonca J, O’Neill N T and Drummond J R 2013 Measurements of CO, HCN, and C2H6 total columns in smoke plumes transported from the 2010 Russian boreal forestfires to the Canadian High Arctic Atmos. Ocean51 522–31
Viau A E and Gajewski K 2009 Reconstructing millennial-scale, regional paleoclimates of boreal Canada during the holocene J. Clim.22 316–30
von Storch H and Zwiers F W 1999 Statistical Analysis in Climate Research(Cambridge: Cambridge University Press) (https:// doi.org/10.1017/CBO9780511612336)
Waito J, Girardin M P, Tardif J C, Conciatori F, Bergeron Y and Ali A A 2018 Recentfire activity in the boreal eastern interior of North America is below that of the past 2000 yr Ecosphere9 e02287
Waito J, Girardin M P, Tardif J C, Hély C, Blarquez O and Ali A A 2015 Fire and climate: using the past to predict the future Routledge Handbook of Forest Ecology(London: Routledge) pp 489–503
Walker M et al 2018 Formal ratification of the subdivision of the Holocene Series/Epoch (Quaternary System/Period): two new Global Boundary Stratotype sections and Points(GSSPs) and three new stages/ subseries Episodes41 213–23
Wang Y, Goring S J and McGuire J L 2019 Bayesian ages for pollen records since the last glaciation in North America Sci. Data
6 176
Wotton B M, Flannigan M D and Marshall G A 2017 Potential climate change impacts onfire intensity and key wildfire suppression thresholds in Canada environ Res. Lett.12 095003