HAL Id: hal-02357371
https://hal.archives-ouvertes.fr/hal-02357371
Submitted on 14 Nov 2019
HAL is a multi-disciplinary open access
archive for the deposit and dissemination of
sci-entific research documents, whether they are
pub-lished or not. The documents may come from
teaching and research institutions in France or
abroad, or from public or private research centers.
L’archive ouverte pluridisciplinaire HAL, est
destinée au dépôt et à la diffusion de documents
scientifiques de niveau recherche, publiés ou non,
émanant des établissements d’enseignement et de
recherche français ou étrangers, des laboratoires
publics ou privés.
Improving estuarine net flux estimates for dissolved
cadmium export at the annual timescale: Application to
the Gironde Estuary
Aymeric Dabrin, Jörg Schäfer, Gérard Blanc, Emilie Strady, Matthieu
Masson, Cécile Bossy, Sabine Castelle, Naïg Girardot, Alexandra Coynel
To cite this version:
Aymeric Dabrin, Jörg Schäfer, Gérard Blanc, Emilie Strady, Matthieu Masson, et al.. Improving
estuarine net flux estimates for dissolved cadmium export at the annual timescale: Application
to the Gironde Estuary. Estuarine, Coastal and Shelf Science, Elsevier, 2009, 84 (4), pp.429-439.
�10.1016/j.ecss.2009.07.006�. �hal-02357371�
Improving estuarine net flux estimates for dissolved cadmium export at the
annual timescale: Application to the Gironde Estuary
Aymeric Dabrin, Jo¨rg Scha¨ fer
*, Ge´rard Blanc, Emilie Strady, Matthieu Masson, Ce´cile Bossy,
Sabine Castelle, Na¨ıg Girardot, Alexandra Coynel
Universite´ d e Bordeaux, UMR 5805, EPOC, 3 3 4 0 5 Talence, Francea r t i c l e i n f o
Article history:Received 28 April 2009 Accepted 16 July 2009 Available online 23 July 2009
Keywords:
c ad m i u m Gironde Estuary long term monitoring annual dissolved net flu x
a b s t r a c t
Dissolved Cd (CdD) concentrations along the salinity gradient were measured in surface water of the Gironde Estuary during 15 cruises (2001–2007), covering a wide range of contrasting situations in terms of hydrology, turbidity and season. During all situations dissolved Cd concentrations displayed maximum values in the mid-salinity range, reflecting Cd addition by chloride-induced desorption and complexa-tion. The daily net CdDfluxes from the Gironde Estuary to the coastal ocean were estimated using Boyle’s method. Extrapolating CdDconcentrations in the high salinity range to the freshwater end member
D
using a theoretical dilution line produced 15 theoretical Cd concentrations (Cd0), each representative D
0 —1
of one distinct situation. The obtained Cd concentrations were relatively similar (w201 T 28 ng L ) when freshwater discharge Q was >500 m3 s—1 (508 ≤ Q ≤ 2600 m3 s—1), but were highly variable (340 T 80 ng L—1; 247–490 ng L—1) for low discharge situations (169 ≤ Q ≤ 368 m3s—1). The respective daily CdDnet fluxes were 5–39 kg day—1, mainly depending on freshwater discharge. As this observation invalidates the existing method of estimating annual CdDnet fluxes, we proposed an empirical model,
D
using representative Cd0values and daily freshwater discharges for the 2001–2007 period. Subsequent integration produced reliable CdDnet flux estimates for the Gironde Estuary at the annual timescale that ranged between 3.8–5.0 t a—1in 2005 and 6.0–7.2 t a—1in 2004, depending on freshwater discharge. Comparing CdDnet fluxes with the incoming CdDfluxes suggested that the annual net CdDaddition in the Gironde Estuary ranged from 3.5 to 6.7 t a—1, without any clear temporal trend during the past seven years. The annual CdDnet fluxes did not show a clearly decreasing trend in spite of an overall decrease by a factor w 6 in Cd gross fluxes during the past decade. Furthermore, in six years out of seven (except 2003), the annual CdDnet fluxes even exceeded river borne total (dissolved þ particulate) gross Cd fluxes into the estuary. These observations were attributed to progressive Cd desorption from both suspended particles and bottom sediment during various sedimentation–resuspension cycles induced by tidal currents and/or continuous dredging (navigation channel) and diverse intra-estuarine sources (wet deposition, urban sources, and agriculture). Provided that gross fluxes remain stable over time, dissolved Cd exportation from the Gironde Estuary to the coastal ocean may remain at the present level for the coming decade and the estuarine sedimentary Cd stock is forecast to decrease slowly.
.
1. Introduction
Hydrological, sedimentological and biogeochemical processes in estuarine systems strongly modify the quantity and the quality of river borne matter transported from the continent to the coastal ocean. Despite the need for reliable annual net flux data, estuarine net flux estimates are only available for the large minority of the global estuaries and cover very few, mostly dissolved, elements.
These estimates are usually valid for one particular day or distinct hydrological situation and, thus, extrapolation from the daily to the annual timescale suffers from many uncertainties due to hydro-logical variations and complex estuarine processes.
The Gironde Estuary (southwest France) is affected by historic
metallic (e.g. Cd, Zn, Hg; Audry et al., 2004a; Scha¨ fer et al., 2006)
contamination due to former Zn ore treatment in the industrial basin of Decazeville, that was stopped after a major pollution accident in
1986 (Jouanneau et al., 1999). Despite decreasing Cd inputs due to
ongoing remediation efforts since the early 1990s, the Lot-Garonne River system still contributes up to 80% to the annual Cd gross fluxes
into the Gironde Estuary (Scha¨fer et al., 2002b; Audry et al., 2004a).
* Corresponding author.
E-mail address: [email protected](J. Scha¨fer).
Moreover, important Cd stocks in the Lot River reservoir sediments
(w200 t,Lapaquellerie et al.,1995) may be mobilized by flood events
and/or dredging activities (e.g.Blanc et al., 1999; Audry et al., 2004b;
Coynel et al., 2007). Numerous studies evidenced non-conservative behaviour of Cd along the salinity gradients in estuaries, bays or
deltas (Boyle et al., 1982; Elbaz-Poulichet et al., 1987; Windom et al.,
1988; Shiller and Boyle, 1991; Boutier et al., 1993; Chiffoleau et al., 1994; Wen et al., 1999; Tang et al., 2002). Typical profiles show a
mid-salinity maximum in dissolved Cd (CdD) reflecting the balance
between chloride-induced desorption/complexation processes and
dilution by seawater (e.g. Comans and van Dijk, 1988;
Elbaz-Poulichet et al., 1996). Chloride induced-desorption is probably the major phenomenon that govern Cd behaviour in estuaries. However,
several studies (e.g.Florence,1989; Baeyens et al.,1997; Waeles et al.,
2005) have shown that organic ligands contribute also to keep Cd in
solution in the high-salinity part of the estuaries. Dissolved Cd addition is particularly efficient in macrotidal estuaries due to
relatively long particle residence times (Dyer, 1994). Several studies
have reported CdDaddition along the salinity gradient of the Gironde
Estuary, suggesting that w90% of the Cd gross fluxes are dissolved due to estuarine biogeochemical processes, thus increasing Cd
availability to aquatic organisms (e.g.Jouanneau et al., 1990;
Krae-piel et al., 1997; Boutier et al., 2000; Michel et al., 2000; Audry et al., 2007a,b; Lekhi et al., 2008). Although Cd concentrations in oysters
from the Gironde Estuary have decreased from w100
mg g
—1(dryweight) in the early 1980s to 10–26
mg g
—1d.w. in 2006 (Claisse et al.,1992; RNO, French National Mussel Watch Program, 2006), they still are w 2 5 times the average level measured along the entire
French Atlantic and Mediterranean coasts (Boutier et al., 1989) and
clearly exceed the current European consumption safety level for
Cd in marine bivalves (5
mg g
—1, dry weight; CE No. 466/2001). As aconsequence, oyster (bivalve) recovery and production are forbidden in the Gironde Estuary, i.e. this case of compromised/ affected ecosystem health goes along with social and economic effects. Furthermore, part of the water and particles exported from the Gironde Estuary to the coastal ocean reach the Marennes-Ole´ron Bay, i.e. one of Europe’s most important oyster production zones, where Cd concentrations in oysters are clearly higher than in other
bays along the French coast (Heral et al., 1982; Boutier et al., 2000;
IFREMER, 2002). Therefore, precise estimates of annual dissolved Cd export from the Gironde Estuary to the coastal zone are essential to assess Cd sources and inputs into the Marennes-Ole´ ron Bay. Reliable
CdDnet flux estimates need concentration data in the estuarine
high-salinity range, where CdDvalues follow a theoretical mixing
line. Extrapolation of this dilution line to S ¼ 0, produces a
theoret-D
ical freshwater CdD concentration (Cd0 ), that may be multiplied by
the daily freshwater discharge (Qi) to estimate daily CdDnet flux
(Boyle et al., 1974). Integration of 365 discrete daily CdDnet fluxes
would then provide precise annual flux estimates, but this ‘‘ideal’’ strategy also would be far too expensive and time-consuming.
Accordingly, the existing estimates of CdDnet fluxes in the Gironde
Estuary and other estuaries are based on few measurement campaigns, each providing one daily (‘‘snapshot’’) dataset, i.e. one
D D
Cd0 value. Therefore, extrapolation of these daily Cd net flux
estimates to the annual timescale may imply important uncertainty.
Elbaz-Poulichet et al. (1987)estimated an annual net CdDflux of 14
t a—1 (37 kg day—1) based on one measurement campaign in
October 1982.Boutier et al. (2000)estimated annual CdDnet fluxes
D
in 1991 to 11 t a—1 (44 kg day—1), based on one Cd0 value, i.e. one
measurement campaign. During five sampling campaigns in the
hydrological year 1997–1998,Michel et al. (2000)obtained similar
daily CdD net fluxes for contrasting seasons/discharges and
concluded that daily CdD net fluxes (w17 kg day—1) out of the
Gironde Estuary would be constant throughout the year. Since the early nineties, Cd gross fluxes into the Gironde estuary have
decreased probably due to ongoing remediation in the watershed
and apparently changing hydrological conditions (Scha¨ fer et al.,
2002a,b; Masson et al., 2006) suggesting profound changes in the Cd budget of the Gironde Estuary. There is, however, at present no
estimate of recent annual CdDnet fluxes in the Gironde Estuary
taking into account potential interannual and seasonal variations. This work is based on a unique data set of dissolved Cd distri-butions along the Gironde Estuary salinity gradient, obtained from 15 measurement campaigns over 7 years (2001–2007) covering contrasting hydrological situations (e.g. freshwater discharges, tidal coefficients) and seasons. The aim of this study is to provide recent
data on CdDnet fluxes and to evaluate the variability and long-term
evolution of CdDexport from the Gironde Estuary to the coastal
ocean. Based on the relationship between CdDdistribution along
the salinity gradient and freshwater discharge we propose an
improved method of extrapolating daily CdD net fluxes to the
annual timescale. Additionally, we compare recent CdDaddition
and net fluxes to historic data to assess the response of the estua-rine Cd budget to generally decreasing gross inputs.
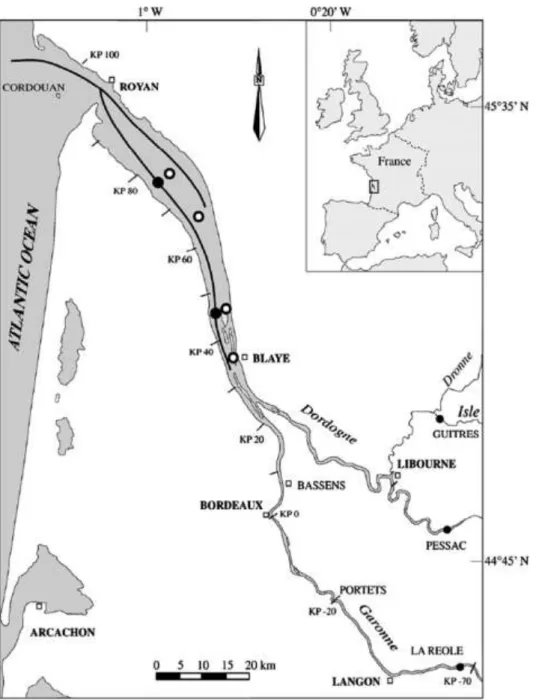
2. Study area
The physical, geochemical and hydrological characteristics of
the Gironde Estuary (w170 km length, w 8 0 000 km2watershed
surface area; Fig. 1) have been well defined in several studies
(Elbaz-Poulichet et al., 1984; Li et al., 1994; Sottolichio and Castaing, 1999; Scha¨ fer et al., 2002b). The Gironde Estuary has a mean annual
freshwater discharge of w1000 m3 s—1 with typical water and
particle residence times of w20–90 days and w1– 2 years,
respec-tively (Jouanneau and Latouche, 1981). During the tidal cycle, ocean
water fluxes at the estuary mouth are 30–40 times higher than
fluvial inputs (Allen et al., 1977). Asymmetrical progression of the
tidal wave toward the upstream estuary induces a pronounced maximum turbidity zone (MTZ), where concentrations of
sus-pended particulate matter (SPM) exceed 1 g L—1in surface water
and several hundreds of g L—1in bottom water. This MTZ is typically
located in the low salinity region and migrates up and down
estuary with seasonal river flow variations (Sottolichio and
Casta-ing, 1999). Sediment resuspension generally occurs during erosion periods at mid-ebb and mid-flood while tidal slacks are sedimen-tation periods. As a consequence of sedimensedimen-tation, the navigation
channel (w18 km2) of the estuary is continuously dredged by the
Bordeaux Autonomous Harbour (P.A.B.). The dredged sediments are either dispersed in the water column on-site or transported downstream within the estuary and deposited in distinct zones, where they are dispersed and/or resuspended by tidal currents (Audry et al., 2007a,b).
3. Material and methods
3.1. Sampling
Samples were collected during 15 cruises within the Gironde Estuary between March 2001 and November 2007 along the salinity gradient onboard the RV ‘‘Coˆtes de la Manche’’ (INSU). These sampling campaigns cover a wide range of freshwater
discharges (Table 1), which were calculated as the sum of the daily
flows of the Garonne and Dordogne Rivers (Fig. 2). Sampling of
surface and bottom water in the estuarine salinity gradient was performed with acid-cleaned Niskin Bottles, thoroughly rinsed with estuarine water from the site. The samples were immediately
filtered through cellulose acetate syringe filters (Sartorius®, 0.2
mm
porosity). Aliquots for trace metals measurements were transferred into 125 mL acid-cleaned polypropylene bottles, acidified (pH 1;
3.2. Sample analyses
Determination of SPM concentrations was performed by
filtra-tion using dry pre-weighed filters (Durieux glass–fibre, 0.7
mm
porosity) as described elsewhere (e.g.Audry et al., 2004a; Masson
et al., 2006). The filters were dried to constant weight (50○C) and
re-weighed. Analyses of dissolved metals were performed after matrix separation and preconcentration by liquid–solid extraction, to avoid interferences induced by major cations during instrumental anal-ysis. In this work, we used commercially available cartridges
(Dig-iSEP Blue®; SCP Science) with amino-diacetate as the functional
group that has strong affinities to several divalent transition metal cations (e.g. Cd, Cu, Co, etc.). The samples (50 mL) with pH adjusted
to 5.3 T 0.1 were passed (flowrate 2 mL min—1) through the
acid-cleaned and conditioned column (0.1 M ammonium acetate buffer; pH 5.3). Then the cartridges were rinsed with 5 mL of buffer solution and trace metals were eluted with nitric acid (2 M, SCP-Science plasmapurePlus). Dissolved Cd concentrations were measured using
tions, parallel to the samples and certified reference materials. Methodological blanks obtained for Cd were generally lower than
2 ng L—1and were systematically subtracted from results obtained
for the other samples. Detection limit (3.3 times the standard
deviation of blank values; n ¼ 56) was 6 ng L—1. Reproducibility and
accuracy of the method were assessed by analyzing certified
refer-ence seawater (CASS-4; Cd: 26 T 3 ng L—1) and estuarine water
(SLEW-3; Cd: 48 T 4 ng L—1). For both reference materials,
repro-ducibility was generally better than 3% (rsd; n ¼ 25) and accuracy was respectively 99% and 98% of the certified values.
D
3.3. Cd0determination
The commonly applied method for estimating dissolved metal
net fluxes (Boyle et al., 1974) is based on the dissolved element
distribution in the high salinity zone. According toBoyle et al.
Fig. 1. Map of the Gironde Estuary. Kilometric Points (KP) ¼ distance (km) from the city of Bordeaux.
ICP–MS (X7, Thermo) with external calibration. Column blanks were performed by passing 50 mL Milli-Q water under identical
condi-(1974, 1982), the instant net flux (Ft) of a dissolved element X across an isohaline S at a time t is:
t t
F ¼ Q ½X]—½S ]d½S]d½X]
. Σ
where [S] is salinity, [X] the concentration of the element of
interest, and Qtthe freshwater discharge at time t. If the relation
between the dissolved element concentration and the salinity is linear (conservative behaviour), d[X]/d[S] is constant and equal to the slope of the segment representing this relation in the concen-tration-salinity diagram. In this case, for any salinity [S] belonging
to the linearity range, [X]S —[S] * (d[X]S/d[S]) is constant and equal
to the intercept [X]0of the straight line extrapolated from this
segment, and the net instant flux of the element through any iso-haline in the linearity range is:
Ft ¼ Qt½X]0
As perfect linearity is rarely observed in any salinity range, a linear regression technique is applied to obtain the most probable
intercept, which is then used to estimate the net instant flux of any dissolved element. The salinity range used for this calculation should be representative of the geographic zone selected and should include the isohaline through which the flux estimation is to be made. The salinity range was determined in order to maximize
the correlation coefficient. Daily net flux (FNET) can be estimated as:
FNET¼Qfw½X]0
where Qfwis the daily river discharge.
4. Results
4.1. Hydrologic conditions
The fifteen cruises are representative of a 7-years period covering
contrasting hydrologic conditions and different seasons (Fig. 2,
Table 1). Except for 2003, two campaigns per year were performed. Freshwater discharges during the different sampling cruises ranged
from 169 m3s—1(September 2006) to 2600 m3s—1(March 2007).
Cruise Discharge
(m3s—1) PK range Salinity range Linear regression n R
2 Daily flu x (kg day—1)
Flood events
Gi m et 2 Marc h 2001 2040 0–100 15–29 [Cd] ¼ —6.4 (T3.4)[S] þ 222 (T79) 8 0.79 39 ( T 14) Gimercad 3 Marc h 2007 2600 0–85 12–26 [Cd] ¼ —3.8 (T2.9)[S] þ 160 (T56) 4 0.77 36 (T13)
Intermediate freshwater discharge
Gi m et 3 June 2001 546 0–100 17–32 [Cd] ¼ —6.4 (T2.7)[S] þ 230 (T65) 6 0.92 11 (T3.1) Girox 1 February 2002 508 0–100 18–32 [Cd] ¼ —4.5 (T0.7)[S] þ 176 (T19) 9 0.97 8 (T0.8) Reagir 3 May 2005 687 0–100 15–30 [Cd] ¼ —5.7 (T0.5)[S] þ 219 (T11) 6 0.99 13 (T0.7) Gimercad 1 May 2006 705 0–100 19–30 [Cd] ¼ —5.0 (T1.4)[S] þ 202 (T37) 6 0.96 12 (T2.3) Low freshwater discharge
Girox 2 September 2002 368 0–100 23–31 [Cd] ¼ —4.8 (T1.1)[S] þ 247 (T31) 7 0.96 8 (T1.0) Girox 4 September 2003 207 0–100 27–33 [Cd] ¼ —13.0 (T1.2)[S] þ 490 (T38) 6 0.99 9 (T0.7) Reagir 1 July 2004 310 0–100 20–34 [Cd] ¼ —7.6 (T1.6)[S] þ 296 (T44) 9 0.96 8 (T1.2) Reagir 2 October 2004 304 0–100 21–31 [Cd] ¼ —8.5 (T3.2)[S] þ 324 (T88) 6 0.93 9 (T2.3) Metogir 1 July 2005 304 0–100 25–34 [Cd] ¼ —10.2 (T1.5)[S] þ 367 (T46) 7 0.99 10 (T1.2) Reagir 4 November 2005 319 0–90 17–31 [Cd] ¼ —6.3 (T5.3)[S] þ 264 (T120) 6 0.93 7 (T3.3) Gimercad 2 September 2006 169 0–100 23–33 [Cd] ¼ —10.4 (T1.8)[S] þ 399 (T53) 10 0.95 6 (T0.8) Gimercad 4 October 2007 305 0–100 24–34 [Cd] ¼ —10.4 (T2.3)[S] þ 400 (T69) 6 0.98 11 (T1.8) Gimercad 5 November 2007 209 0–100 23–30 [Cd] ¼ —7.2 (T3.4)[S] þ 273 (T105) 4 0.98 5 (T1.9) 0 1
Dconcentrations (ng L—, bold numbers) at S ¼ 0 and daily Cd net flu x estimates (kg day—1). All each regression, equations of the dilution lines, and the resulting theoretical Cd
the relationships are statistically significant at the 95% confidence level.
G im e t2 G im e t3 G ir o x 1 G ir o x 2 G ir o x 4 Rea g ir 1 Rea g ir 2 6000 5000 4000 3000 2000 1000 0 ja n .-01 a p r. -0 1 ju l. -01 o c t. -01 ja n .-0 2 a p r. -0 2 ju l. -0 2 o c t. -0 2 ja n .-0 3 a p r. -0 3 ju l. -0 3 o c t. -0 3 ja n .-0 4 a p r. -0 4 ju l. -0 4 o c t. -0 4 ja n .-0 5 a p r. -0 5 ju l. -0 5 o c t. -0 5 ja n .-0 6 a p r. -0 6 ju l. -0 6 o c t. -0 6 ja n .-0 7 a p r. -0 7 ju l. -0 7 o c t. -07 F re s h w a te r d is c h a rg e (m 3s -1) Rea g ir 3 M e to g ir 1 Rea g ir 4 G im e rc a d 1 G im e rc a d 2 G im e rc a d 3 G im e rc a d 4 G im e rc a d 5
Fig. 2. Freshwater discharges of the Gironde Estuary during the 2001–2007 period. Table 1
Based on freshwater discharge data, the studied hydrological situations may be classified as follows: (a) low freshwater discharge
during summer and autumn (<500 m3 s—1; September 2002,
September 2003, July 2004, October 2004, July 2005, November 2005, October 2007 and November 2007), (b) intermediate
discharge during the winter/spring period (500–700 m3s—1; June
2001, February 2002, May 2005 and June 2006) and (c) the flood
events (>2000 m3s—1; March 2001, March 2007). Although the
sampled periods cover a very wide range of discharge situations in
the Gironde Estuary, the discharge range from 750 to 2000 m3s—1
has not been sampled. During the 2001–2007 period, hydrological situations with freshwater discharges comprised between 750 and
2000 m3s—1only occurred during w25% of the time. Accordingly,
the sampled periods represent hydrological situations covering w75% of the time during 2001–2007.
4.2. Dissolved Cd distribution along the salinity gradient
The CdDconcentrations of the first 2 cruises (Gimet 2, Gimet 3)
have already been presented in an earlier study with a different
focus (Audry et al., 2007a,b) and are presented here together with
original data obtained during 13 additional cruises to increase the
representativity of the present work. Dissolved Cd (CdD)
concen-trations in surface waters along the salinity gradient displayed a
similar distribution during all 15 cruises (Fig. 3). In the freshwater
reaches, CdD concentrations were generally close to 20 ng L—1(Fig.
3; Audry et al., 2007a,b). In the low-salinity range (S < 15), dissolved Cd concentrations increased with salinity reaching
maximum values of 98 ng L—1(November 2007) to 166 ng L—1
(September 2003) in the mid-salinity range (S w 15–20). In
contrast, in the high-salinity range (S > 20), CdDbehaved
conser-vatively, i.e. showed a linear decrease with salinity (Fig. 3). The
dissolved Cd concentrations obtained for bottom water profiles fit with the concentrations in surface waters, except during the flood event (March 2007) when bottom water concentrations were higher and more variable.
5. Discussion
5.1. Cadmium chlorocomplexation and variations of the maximum CdDvalues
The CdD concentrations observed for the 15 profiles (8– 166 ng
L—1;Fig. 3) were in the same range as those measured during the
previous decade (Kraepiel et al.,1997; Boutier et al., 2000; Michel et
al., 2000). The maximum values were higher than those reported for heavily industrialised/urbanised estuaries, such as the Seine (Chiffoleau et al., 1999), the Loire (Waeles et al., 2004) and the
Scheldt Estuaries (Zwolsman et al., 1997), but they were clearly
lower than those of in the Rio Tinto, which is severely impacted by
acid-mine drainage (Braungardt et al., 2003) or in the Mersey
Estuary, which drains a heavily populated and highly industrialised
area (Martino et al., 2002).
The observed dissolved Cd distributions of all the campaigns showed typical non-conservative behaviour of Cd as observed in
other macrotidal estuaries, e.g. the Tay (Owens and Balls, 1997), the
Charente (Boutier et al., 2000), the Loire (Boutier et al., 1993;
Waeles et al., 2004), the Scheldt (Zwolsman et al., 1997) and the
Seine Estuaries (Chiffoleau et al., 1994, 1999). The commonly
observed dissolved Cd addition in the low salinity range (S < 15) has been attributed to chloride-induced desorption of particle-bound Cd and formation of stable dissolved chlorocomplexes (e.g.
Elbaz-Poulichet et al., 1987; Comans and van Dijk, 1988; Turner et al., 1993; Turner, 1996). The apparently conservative behaviour in
the mid- to high-salinity range (wlinear decrease in CdD
concentrations with increasing salinity) may be attributed to
dilution of mid-salinity high CdDwaters by oceanic, low CdDwater.
This, in turn, suggests that the suspended particles in the high salinity range are depleted in easily desorbable Cd.
Like the low- to intermediate discharge situations, both flood situations (March 2001 and March 2007) showed a clear increase in the low-salinity range, but the mid-salinity maximum was much less defined, i.e. the data were more scattered than during
low discharge situations (Fig. 3). This may suggest that floods
modify the typical CdD distribution along the salinity gradient,
eventually due to (a) local resuspension of bottom sediment (
Sot-tolichio and Castaing, 1999) enriched in dissolved and particulate Cd (Audry et al., 2006) and/or (b) very short water residence times
(w20 days,Jouanneau and Latouche, 1981) with incomplete mixing
of ‘‘fresh’’ Cd-rich and ‘‘old’’ Cd-depleted particles. In fact, fluvial inputs of dissolved and particulate Cd by the Garonne, Dordogne
and Isle Rivers are at maximum during floods (Scha¨ fer et al., 2002b;
Masson et al., 2006). The particle fluxes from the watershed to the estuary during major flood events (e.g. w0.8–1 Mt in 6 days in
February 2003;Coynel et al., 2007) may be equivalent to 20–25% of
the particle mass in the MTZ (4–5 Mt;Jouanneau et al., 1990). This
may modify the composition of the estuarine particle pool, especially for reactive carrier phases and associated elements that
undergo profound changes in the estuarine geochemical
gradients, inducing local heterogeneities in particle composition and reactivity. This hypothesis may be supported by the similarity
between CdDconcentrations in surface and bottom water profiles
during low-and intermediate discharge (Fig. 3), suggesting that
the water column was well-mixed under these hydrologic
condi-tions. In contrast, during the floods, clear CdD concentration
differences between surface and bottom water were observed and attributed to (a) the impact of sediment remobilisation including porewater release into the water column and/or (b) incomplete mixing and variable residence times of different water masses and particles.
Although freshwater discharges during the different cruises
varied by a factor 16, maximum CdDconcentrations in the
mid-salinity range of each profile showed only little variability, ranging
from 98 ng L—1to 166 ng L—1(Fig. 3). Interestingly, there was no
systematic difference in the maximum CdDfor the different types of
hydrological situations. This observation is not what would have been expected, presuming dilution of dissolved Cd in the estuary by freshwater inputs during floods. In fact, one would have expected
maximum CdD mid-salinity levels during low water discharge,
when long residence times of water (up to 3 months), and particles (>2 years) should account for most efficient Cd desorption (Jouanneau and Latouche, 1981). Furthermore, neither the position nor the SPM concentration level in the MTZ seem to control
maximum CdDconcentrations in the Gironde Estuary (Fig. 3).
5.2. Temporal variations in the theoretic CdD concentrations at zero
salinity
D
The theoretic CdD concentrations at zero salinity (Cd0 ) obtained
from applying Boyle’s method to the different longitudinal profiles
D
are reported in Table 1. During the flood events, Cd0concentrations
were 222 ng L—1 in March 2001 (2040 m3 s—1) and 160 ng L—1in
March 2007 (2600 m3 s—1). This is in good agreement with Cd0 D
(206 ng L—1) obtained from previously reported data on dissolved
Cd concentrations in the Gironde Estuary during a comparable
hydrologic situation in 1994 (Q ¼ 2100 m3s—1;Kraepiel et al., 1997).
For intermediate freshwater discharge conditions (2001–2007
D
period), Cd0 concentrations ranged from 176 ng L—1(February
2002; Q ¼ 508 m3 s—1) to 230 ng L—1 (June 2001; Q ¼ 546 m3s—1),
D
In contrast, clearly higher Cd0values may be deduced from older
data measured during intermediate freshwater discharge in 1984
D
0 1 3s—1
(Cd ¼ 1000 ng L—, Q ¼ 600 m ; Jouanneau et al., 1990) and in
D
0 1 3s—1
1991 (Cd ¼ 504 ng L—, Q ¼ 1010 m ;Boutier et al., 2000). These
results are consistent with strongly reduced emissions after the stop of the ore treatment activity (1987) and gradually decreasing particulate Cd concentrations of SPM in the fluvial-estuarine system, which is further supported by sedimentary records in Lot River
Gimet 2 S P M ( m g L -1) 160 120 80 40 0 C d ( n g L -1) C d ( n g L -1) Gimet 3 Reagir 3 800 400 0 2000 Gimercad 1 1600 1200 S P M ( m g L -1) Girox 2 C d ( n g L -1) Girox 4 Reagir 2 C d ( n g L -1) 400 0 1600 1200 800 2000 Reagir 1 S P M ( m g L -1) Metogir 1 S P M ( m g L -1) C d ( n g L -1)
Gimercad 2 Gimercad 4 Gimercad 5
0 2000 1600 1200 800 400 0 S P M ( m g L -1) 200 160 120 80 40 0 200 160 120 80 40 0 200 160 120 80 40 0 200 160 120 80 40 0 Cd (n g L -1) 160 120 80 40 0 1600 1200 800 400 0 2000 Girox 1 S P M ( m g L -1)
a
2000 Gimercad 3 1600 1200 800 400 0 0 10 20 30 0 10 20 30 0 10 20 30Salinity Salinity Salinity
c
b
200 March 2001 March 2007 June 2001 February 2002 200 May 2005 May 2006September 2002 September 2004 July 2004
October 2004 July 2005 Reagir 4 2000
November 1600 2005 1200 800 400 November 2007 October 2007 September 2006
Fig. 3. Distribution of dissolved Cd and suspended particulate matter along the salinity gradient for (a) flood events, (b) intermediate discharge and (c) low discharge. Dotted areas represent surface water SPM concentrations, open circles represent CdDconcentrations in surface water and full circles represent CdDin bottom water. Note that the CdDvalues for the Gimet 2 and 3 cruises (March and June 2001) are fromAudry et al. (2007a).
reservoir lakes (e.g.Audry et al., 2004b) and in the flood-tidal dock at
Bordeaux (Grousset et al., 1999).
During low freshwater discharge (Q < 500 m3 s—1), Cd0
D
concentrations varied by a factor w 2 and ranged from 247 ng L—1
(September 2002; Q ¼ 368 m3 s—1) to 490 ng L—1 (September 2003;
Q ¼ 207 m3 s—1; Table 1; Fig. 4a). To our knowledge, this is the most D
complete (9 campaigns) data set on Cd0 values covering most low
freshwater discharge situations in the same estuary during consecutive years (2002–2007). This dataset is the first to show the
D
great variability of the Cd0 concentration during low freshwater
discharge (Q < 500 m3s—1;Fig. 4a). The observed variations
prob-ably reflect the balance of desorption efficiency, residence time of water and particles in the estuary and mixing of fresh- and seawater. Such non-steady state conditions may eventually result from several factors. First, variations in the input of freshwater particles (rich in desorbable Cd) or urban particles from Bordeaux may enhance addition, especially during low discharge, when
particle residence time in the estuary is long (Sottolichio and
Cas-taing, 1999). Second, variable CdDrelease may be due to sediment
and/or fluid mud resuspension by tidal currents and/or dredging (Robert et al., 2004; Audry et al., 2007a,b). Third, O2-depletion in
the bottom of the water column during low freshwater discharge (Abril et al., 1999) could eventually induce removal processes, e.g. by sulphide precipitation, as reported for the Scheldt Estuary (Zwolsman et al., 1997) temporarily and locally limiting Cd addi-tion. However, the well-mixed Gironde Estuary generally displays relatively high oxygen concentrations in most of the water column
(too high for sulphide precipitation), despite seasonal hypoxic conditions in the fluid mud layer during pronounced low discharge
conditions, (IFREMER, 1994; Abril et al., 1999). This is consistent
with sulphide oxidation in the bottom of the water column induced
by resuspension of anoxic sediments (Audry et al., 2007b).
D
Plotting Cd0 concentrations over daily water discharge
sepa-rates the recent (2001–2007) data into two major domains (Fig. 4a).
The first relates to the low discharge period (Q < 500 m3 s—1)for
D
which Cd0 values were very variable (247–490 ng L—1). The second
domain (Q > 500 m3 s—1) regroups the flood events and
interme-D
diate freshwater discharge periods for which Cd0values were less
variable (201 T 28 ng L—1).
Plotting daily CdD net fluxes over daily water discharge shows
how much CdD net fluxes are controlled by discharge (Fig. 4b).
These results are clearly different from those ofMichel et al. (2000)
reporting rather constant daily CdD net fluxes in the Gironde
Estuary whatever the freshwater discharge. This fundamental difference may eventually be attributed to different observation
periods. The results ofMichel et al. (2000)are based on one
rela-tively dry hydrological year (1997/1998) following a succession of very wet years with numerous intense floods (1992, 1994, 1996;
Scha¨ fer et al., 2002b). Assuming that (a) a major part of the MTZ had been expulsed out of the estuary in 1996 and the preceding wet years and (b) the MTZ may not have been well installed/renewed in 1997/1998 due do low discharge, one cannot exclude that at that time the desorbable Cd stock in estuarine suspended particles was too low to buffer discharge-induced variations, e.g. due to dilution. Accordingly, this observation period may be considered as probably not representative of present day (2001–2007) conditions that correspond to a series of dry to average years with few isolated
intense floods (Masson et al., 2007), which is not favourable to
particle expulsion out of the estuary. Although the existing dataset does not allow a definitive conclusion on this point, it is evident
that the hypothesis of constant daily CdD net fluxes cannot be
applied to obtain reliable flux estimates at the annual timescale.
5.3. Daily CdD net fluxes
During 2001–2007, daily CdD net fluxes, classically estimated
D
from the product of Cd0 and the respective daily freshwater
discharge, ranged from 5 kg to 39 kg (Fig. 4b). These values are of
the same order as net CdD net fluxes reported for the Seine (11 kg
day—1; Chiffoleau et al., 1999), one of the most metal
contaminated estuaries in the world (Meybeck et al., 2004) and the
Loire Estuaries (14 kg day—1;Waeles et al., 2004). Comparing the
recent daily CdDnet flux estimates for the Gironde Estuary to those
obtained in 1982 (37 kg day—1for 400 m3s—1;Elbaz-Poulichet et al.,
1987), 1984 (54 kg day—1for Q ¼ 600 m3s—1;Jouanneau et al., 1990)
and 1992 (44 kg day—1 for Q ¼ 1000 m3 s—1; Boutier et al., 2000)
shows that daily CdD net fluxes have decreased by a factor 3–5
during the past two decades. This probably reflects stepwise reduction of emissions in the Decazeville watershed and is in good agreement with progressive decontamination of the system dis-cussed above. Although during the nineties alternation of dry and wet hydrological years induced some variability of particulate Cd
inputs into the Gironde Estuary (2.5–23.0 t a—1 with a mean of
12.4 t a—1; 1991–1999 period; Scha¨ fer et al., 2002b), frequency of
these variations was similar to the particle residence time in the
estuary (1–2 years;Castaing and Jouanneau, 1979), which may have
‘‘smoothened’’ CdDaddition resulting in more or less constant CdD
net fluxes. In contrast, since 2000 dissolved Cd fluxes from the
source to the estuary have decreased due to remediation (Audry et
al., 2004b) and particulate Cd transport in the fluvial-estuarine system clearly changed due to increasingly frequent and long low discharge periods. For example, succession of 2–3 dry years
0 500 Discharge (m s-1) 0 200 400 600 800 1000 1200 Cd D 0 (ng L -1) D a il y Cd D fl ux e s ( k g da y -1) 10 0 20 30 40 50 60
a
b
0 500 1000 1500 2000 2500 3000 1000 1500 2000 2500 3000 D DFig. 4. Theoretic Cd0 concentrations (a) and daily Cd flux (b) over the whole range of discharges observed. Full circles correspond to the data of this study (2001–2007), full diamond corresponds to 1982 data (Elbaz-Poulichet et al., 1987), the cross corresponds to 1984 data (Jouanneau et al., 1990), full triangle corresponds to 1991 data (Boutier et al., 2000), open triangle corresponds to 1994 data (Kraepiel et al., 1997), and open diamonds correspond to 1997–1998 data (Michel et al., 2000). The linear correlation refers only to the data of this study (2001–2007).
followed by extreme flood events resulted in erosion and destabi-lisation of ancient Lot River sediment, enhanced by flood
management (e.g. dam opening; Coynel et al., 2007). These
processes contributed to temporarily very high Cd transport into
the estuary followed by relatively long periods with very low CdP
fluxes (Scha¨ fer et al., 2002b; Coynel et al., 2007; Masson et al.,
2007). Extremely long low discharge periods without renewal/
expulsion of MTZ particles (e.g. July 2004–November 2006;Fig. 2)
one might expect the estuarine SPM in the MTZ to become depleted in desorbable Cd, resulting in decreasing addition and temporarily reduced net fluxes. Replenishment and/or exchange of estuarine SPM during the following flood would then restore the estuarine stock in desorbable Cd. Accordingly, the point of time of a sampling campaign with respect to depletion/replenishment periods may
D
eventually explain the observed variability of Cd0 values during the
studied low discharge situations.
5.4. Annual CdD net flux estimation
The major part (up to 95%, unpublished data) of particulate Cd
(CdP) exposed to the estuarine salinity gradient is transferred to the
dissolved phase before/while exported to the coastal ocean (
Krae-piel et al., 1997). In fact, typical annual average CdPconcentrations
(weighted by SPM fluxes) at the entry of the Gironde Estuary during
the 1990–2005 period were 4–4.5 mg kg—1(after Scha¨ fer et al.,
2002b; Masson et al., 2006), whereas typical particulate Cd
concentration in MTZ particles are w0.4–0.5 mg kg—1(Kraepiel et
al., 1997; Audry et al., 2007a). Assuming that CdDmay easily enter
the aquatic food chain and potentially impact the marine resources
(e.g. oysters;Lekhi et al., 2008), it is important to quantify CdD net
fluxes. Ideally, annual net flux estimates should result from integration of daily net fluxes, but in reality only few daily flux estimates exist even for the most intensively observed estuaries. Thus, daily net flux estimates have to be extrapolated and the choice of the appropriate extrapolation method will determine the quality of annual net flux estimates. Some pioneer studies on net
D
CdD fluxes in the Gironde Estuary used one Cd0 value multiplied by
the mean annual freshwater discharge (Elbaz-Poulichet et al., 1982)
or by the annual freshwater discharge of the respective year (e.g.
Boutier et al., 2000). This in turn requires low seasonal variability of
D
Cd0 compared to the variability of the river water discharge.
0
However, both, the observation that CdD values varied with
fresh-water discharge during 1997/1998 (Michel et al., 2000) and the
D
present dataset show that random Cd0 values may be too variable
to produce reliable CdD net flux estimates at the annual scale. In
D
fact, multiplying the three different Cd0 values reported byMichel
et al. (2000) in 1997 by annual discharge would produce CdD net D
flux estimates of 2.5–12.2 t a—1, depending on the Cd0 value used.
Such high uncertainty seems to invalid the method proposed by
D
Boutier et al. (2000). This and the high variability of Cd0values
obtained from our 2001–2007 dataset supports the idea that
reli-able annual CdDnet flux estimates cannot be obtained from random
D
single Cd0values especially, when they were obtained during low
discharge (Fig. 4a). However, the dataset also suggests that for
D
freshwater discharge >500 m3 s—1 in the Gironde Estuary, Cd0
values were relatively stable (i.e. 201 T 28 ng L—1) and did not seem
to change much during the past decade (Fig. 4a). Extrapolation of
CdDnet fluxes to the annual scale needs taking into account these
discharge-dependent features. Accordingly, we suggest using
D
different Cd0 for different discharge situations. For discharge
D
3 s—1 0 1
>500 m , Cd value of 201 T 28 ng L—should provide
satis-factory daily CdD net flux estimates. For discharge <500 m3s—1,
a range of CdDnet fluxes could be estimated, by using the lowest
0 Min 0
and the highest Cd value observed ð Cd ðQ < 500Þ ¼ 247T
—1 Max 0 D D i1
31 ng L ; CdDðQi < 500Þ ¼ 490 T 38 ng L—Þ. This would
produce an estimated range of the annual CdDnet fluxes as follows:
Min NET D F Cd ¼ Cd 0 DðQi>500Þ X * QiðQ >500Þi . Σ . Min þ Cd i 0 DðQ <500Þ X * QiðQ <500Þi Σ Max NET D . F Cd ¼ Cd 0DðQ >500Þi *X QiðQ >500Þi Σ . Max þ Cd0DðQi<500Þ X * QiðQ <500Þi Σ
The annual CdD net flux estimates for the 2001–2007 period
obtained by this method suggest that annual CdDnet flux ranged
from 3.8–5.0 t a—1in 2005 to 6.0–7.2 t a—1in 2004, depending on
interannual variations in freshwater inputs (Table 2; Fig. 5). The
differences between the minimum and maximum annual CdD net
flux estimates ranged through 0.8–1.3 t a—1, with uncertainties
mainly related to the duration of low freshwater discharge situations.
5.5. Annual net Cd addition
The annual CdD fluxes at the upstream limit of the salinity
gradient (FI: incoming fluxes;Audry et al., 2007a,b) were estimated
as follows:
FI ¼ CdS¼0*
X
Qi
where Qi represents the daily freshwater discharges and CdS¼0
represents the average CdD concentration measured at S ¼ 0 forthe
different campaigns (CdS¼0¼ 17 T 5 ng L—1). The annual net Cd D
addition was estimated from the difference between FNET and FIfor
each year (Table 2). The resulting annual CdDaddition in the salinity
gradient of the Gironde Estuary ranged through 3.5–5.7 t a—1using
MinFNETand through 4.7–6.7 t a—1usingMaxFNET. This suggests that
D D
Cd addition provides Cd amounts 11–16-fold higher than the incoming flux (FI), depending on freshwater discharge.
Further-D
more, Cd addition did not seem to show a clearly decreasing trend during the observation period, despite of the generally decreasing contamination of the Lot-Garonne-Gironde fluvial-estuarine
system (Fig. 5).
Dredging activities (Audry et al., 2007a,b), ongoing reload of the
MTZ by Cd-rich particles from sedimentary stocks in the watershed
2001 2002 2003 2004 2005 2006 2007
M inFNETCdD (t a—1) 6.0 (T0.8) 4.4 (T0.6) 5.0 (T0.7) 6.0 (T0.8) 3.8 (T0.5) 4.3 (T0.6) 4.4 (T0.6) M axFNETCdD (t a—1) 7.0 (T0.8) 5.7 (T0.6) 5.8 (T0.7) 7.2 (T0.8) 5.0 (T0.5) 5.4 (T0.6) 5.6 (T0.6)
M inNet addition 5.7 4.0 4.6 5.5 3.5 3.9 4.0
M axNet addition 6.6 5.3 5.4 6.7 4.7 5.0 5.2
Annual freshwater inputs (km3) 28.8 20.8 24.3 28.0 17.7 20.6 21.0
Table 2
Annual CdDnet flux, net addition and annual freshwater inputs in the Gironde Estuary during the 2001–2007 period. Annual CdDdissolved net fluxes are statistically significant at the 95% confidence level.
during flood events (Coynel et al., 2007) and/or progressive release of the estuarine Cd stock due to tidal resuspension of the bottom
sediment (Robert et al., 2004) could eventually explain this
rela-tively constant dissolved Cd net addition in the Gironde Estuary.
5.6. Comparison between the annual CdD net fluxes and the gross
total Cd inputs
Estuarine mass balances need reliable estimates of gross fluxes, i.e. fluxes derived from the upstream watershed and net fluxes, i.e. fluxes leaving the estuary towards the coastal ocean. The existing observation methods allow precise and reliable estimates of gross fluxes, which are at the origin of net fluxes, but it is widely accepted that estuarine processes widely decouple gross and net fluxes (Zwolsman et al., 1997; Monbet, 2006). Accordingly, comparison of gross and net fluxes reasonably integrates larger (e.g. annual) timescales.
The annual freshwater fluxes entering the Gironde Estuary are derived from the sum of dissolved and particulate fluxes in the major tributaries, i.e. the Garonne, the Dordogne and the Isle Rivers. However, the Garonne River accounts for the majority of the highly variable and discharge-dependent SPM and Cd fluxes entering the Gironde Estuary, whereas the Dordogne River typically contributes
1.2 T 0.3 t a—1 (Scha¨ fer et al., 2002b; Fig. 5). For the 2001–2007
period, the total annual Cd gross fluvial inputs were clearly lower
and less variable than during 1990–2000 (2.8–5.1 t a—1; Fig. 5)
except for 2003 (13.9 t a—1), when a major flood remobilised
important stocks of Cd-polluted sediment in the Lot River
contrib-uting w90% to the high annual gross fluxes into the estuary (Coynel
et al., 2007). The annual gross CdDfluxes also tended to decrease
during the observation period (2001–2007: from 0.5 to 0.2 t a—1). In
contrast, annual CdDnet fluxes did not show any decreasing trend
and were higher than annual gross total Cd fluxes in six years out of
seven (Fig. 5), with a difference of w1.4 T 0.4 t a—1. This difference
has become visible only recently, due to the decreasing overall Cd budget of the Gironde Estuary and may reflect different sources of increasing relative importance. Atmospheric Cd wet deposition
( w7 ng cm—2a—1;Maneuxet al.,1999) would contribute w0.05 t a—1
to the estuary surface and w0. 2 t a—1to the adjacent watersheds.
Diffuse inputs (e.g. by agriculture), urban wastewater, runoff and aerosols would also be expected to represent non-negligible Cd sources to the estuary.
The average particulate Cd concentration (0.57 T 0.18 mg kg—1,
n ¼ 91; unpublished data) in the muddy sediments (silt and clay
>80%) of the Gironde Estuary covering w400 km2 (Kapsimalis et
al., 2004), tend to be higher than that of SPM in the water column
of the downstream estuary (0.44 T 0.04 mg kg—1, n ¼ 546,
unpub-lished data; Kraepiel et al., 1997). Assuming that tidal currents,
dredging, etc. may eventually erode the uppermost 10 cm of these sediments and using the average concentration values in sediment and SPM, the expected Cd desorption in the salinity gradient would
suggest a potential release of w2. 6 t of CdD. However, erosion of
deeper sediment layers with higher Cd concentrations (Robert et
al., 2004) cannot be excluded, which would imply a higher sedimentary Cd stock potentially recycled. Without fundamental changes in estuarine functioning, recycling of the sedimentary Cd stock in the Gironde Estuary and diverse Cd inputs from diffuse sources may be sufficient to maintain the Cd budget of the Gironde Estuary at the present level for another decade. Assuming that the present annual Cd budget of the Gironde Estuary is close to steady state, one may reasonably expect that (a) the present empirical
model for CdDnet flux estimates at the annual timescale will still be
valid during this period and (b) CdDnet fluxes to the coastal ocean
are forecast to decrease slowly, even when the ongoing inputs of Cd from the watershed continue to decrease.
6. Conclusion
The present work provides a very complete and recent dataset on dissolved Cd concentrations in the salinity gradient of the Gironde Estuary covering seven years and contrasting hydrological
situations. Although CdDconcentrations along the salinity gradient
followed the classical pattern, the data support substantial improvement in quantitative understanding of Cd behaviour in this
system. Maximum CdDconcentrations in the mid-salinity range
were independent from discharge and average SPM concentration.
For a given cruise and salinity, CdD concentrations in surface
bottom water were similar, except during floods, suggesting limited mixing and heterogeneous water and particle residence times. Comparing recent and historic data clearly indicated a decrease by
a factor 3–5 in daily CdDnet fluxes during the past two decades,
mainly reflecting emission control in the Decazeville watershed.
The present data revealed that during 2001–2007 daily CdDnet
fluxes depended strongly on discharge, which is the contrary of the
hypothesis (CdDnet fluxes independent from discharge;Michel et
al., 2000) established for the previous decade. Therefore, the
commonly applied method of estimating annual CdDnet fluxes for
the Gironde Estuary is not valid anymore for the present conditions.
Taking into account discharge-dependent daily CdDnet fluxes, we
proposed a new empirical model for CdDnet flux estimates in the
Gironde Estuary at the annual timescale.
Comparing annual gross Cd fluxes to annual CdD net fluxes
obtained from the model revealed that neither annual CdDaddition
not CdDnet fluxes showed a clear trend during 2001–2007 despite
of decreasing gross fluxes. This and the fact that CdD net fluxes
systematically exceeded total gross fluxes imply inputs by various diffuse sources. These inputs were negligible in former Cd budgets, but have become significant due to decreasing fluxes from the major source in the Decazeville basin. These sources and Cd release from the sedimentary stock may keep the Cd budget of the Gironde Estuary at the present level for at least another decade, suggesting slow decontamination of the estuary, i.e. decreasing sedimentary
Cd stocks. If CdDfluxes to the coastal ocean are forecast to decrease
0 5 10 15 20 25 199 0 199 1 199 2 199 3 199 4 199 5 199 6 199 7 199 8 199 9 200 0 200 1 200 2 200 3 200 4 200 5 200 6 200 7 30 C d f lu xe s (t a -1) Cd particulate fluxes
Cd dissolved fluxes Garonne Cd particulate fluxes
Cd dissolved fluxes Dordogne
D
Net Cd fluxes of theGironde
Fig. 5. Dissolved and particulate annual Cd fluxes in the Garonne and Dordogne River for the 1990–2007 period (1990–1999:Scha¨ fer et al., 2002a,b; 2000–2002:Masson et al., 2006; 2003–2007: unpublished data) and dissolved annual CdDnet fluxes in the Gironde Estuary for the 2001–2007 period. The errors bars represent the minimum and maximum flux estimates taking into account the 95% confidence intervals in each of these fluxes.
slowly, further work is needed to (a) quantify inputs from intra-estuarine sources and (b) optimize management and control of total Cd inputs to accelerate the clean-up of this system and minimize future impact on the coastal zone.
Acknow ledgements
We gratefully acknowledge the captains and crew members of the RV ‘‘Coˆtes de la Manche’’ (INSU), and the following colleagues for sampling assistance, contribution to field work and analytical support: S. Audry, S. Robert, G. Lavaux and J.P. Lissalde. The support by the INSU, the CIRMAT committee and. P. Morin is acknowledged. References
Abril, G., Etcheber, H., Le Hir, P., Bassoulet, P., Boutier, B., Frankignoulle, M., 1999. Oxic/anoxic oscillations and organic carbon mineralization in an estuarine m axi m u m turbidity zone (The Gironde, France). Limnology and Oceanography 44, 1304–1315.
Allen, G.P., Sauzay, G., Castaing, Jouanneau, J.M., 1977. Transport and deposition of suspended sediment in the Gironde Estuary, France. In: Wiley, M. (Ed.), Estuary Process. Academic Press, N ew York, pp. 63–81.
Audry, S., Scha¨ fer, J., Blanc, G., 2004a. Anthropogenic com pon en ts on heavy metal budgets (Cd, Zn, Cu and Pb) in the Lot-Garonne fluvial system (France). Applied Geochemistry 19, 469–486.
Audry, S., Scha¨ fer, J., Blanc, G., Jouanneau, J.M., 2004b. Fifty-year sedimentary record of heavy metal pollution (Cd, Zn, Cu, Pb) in the Lot River reservoirs (France). Environmental Pollution 132, 413–426.
Audry, S., Blanc, G., Scha¨ fer, J., Chaillou, G., Robert, S., 2006. Early diagenesis of trace metals (Cd, Cu, Co, Ni, U, M o and V) in the freshwater reaches of a macrotidal estuary. Geochimica et Cosmochimica Acta 70, 2264–2282.
Audry, S., Blanc, G., Scha¨ fer, J., Gue´ rin, F., Masson, M., Robert, S., 2007a. Budgets of Mn , Cd, Cu in the macrotidal Gironde Estuary ( SW France). Marine Chemistry 107, 433–448.
Audry, S., Blanc, G., Scha¨ fer, J., Robert, S., 2007b. Effect of estuarine sediment resuspension on early diagenesis, sulfide oxidation and dissolved molyb d en um and uranium distribution. Chemical Geolology 238, 149–167.
Baeyens, W., Goeyens, L., Monteny, F., Elskens, M., 1997. Effect of organic complexation on the behaviour of dissolved Cd, Cu and Zn in the Scheldt Estuary. Hydrobiologia 366, 81–90.
Blanc, G., Lapaquellerie, Y., Maillet, N., Anschutz, P., 1999. A c adm iu m budget for the Lot-Garonne fluvial system (France). Hydrobiologia 410, 331–341.
Boutier, B., Chiffoleau, J.F., Jouanneau, J.M., Latouche, C., Phillips, I., 1989. La contamination de la Gironde par le c ad m i u m : origine, extension, importance. Scientific and technical report, Ifremer no. 14.
Boutier, B., Chiffoleau, J.F., Auger, D., Truquet, I., 1993. In fluence of the Loire River on dissolved lead and c ad mi um concentrations in coastal waters of Brittany. Estuarine Coastal and Shelf Science 36, 133–145.
Boutier, B., Chiffoleau, J.F., Gonzalez, J.L., Lazure, P., Auger, D., Truquet, I., 2000. Influence of the Gironde estuary outputs on cad mi u m concentrations in the coastal waters: consequences on the Marennes-Ole´ ron Bay (France). Ocean-ologica Acta 23, 745–757.
Boyle, E.A., Collier, R., Dengler, A.T., Edmond , J.M., Ng, A.C., Stallard, R.F., 1974. On the chemical mass-balance in estuaries. Geochimi ca C osmochim ica Acta 38, 1719–1728.
Boyle, E.A., Huested, S.S., Grant, B., 1982. The chemical mass balance of the A m azon plume-II. Copper, nickel and c ad m i um . Deep Sea Research 29, 1355–1364. Braungardt, C.B., Achterberg, E.P., Elbaz-Poulichet, F., Morley, N.H., 2003. Metal
geochemistry in a mine-polluted estuarine system in Spain. Applied Geochemistry 18, 1757–1771.
Castaing, P., Jouanneau, J.M., 1979. Temps de re´sidence des eaux et des suspensions dans l’estuaire d e la Gi ronde. Journal de Recherche en Oce´anographie, 41–52. Chiffoleau, J.F., Cossa, D., Auger, D., Truquet, I., 1994. Trace metal distribution, partition and fluxes in the Seine estuary (France) in low discharge regime. Marine Chemistry 47, 145–158.
Chiffoleau, F., Auger, D., Chartier, E., 1999. Fluxes of selected trace metals from the Seine estuary to the eastern English Channel during the period August 1994 to July 1995. Continental Shelf Research 19, 2063–2082.
Claisse, D., Joanny, M., Quintin, J.Y., 1992. Le Re´ seau National d’Observation de la qualite´ d u milieu marin (RNO). Analysis 20, 719–722.
Coman s, R.N.J., van Dijk, C.P.J., 1988. Role of complexation processes in cad miu m mobilization during estuarine mixing. Nature 336, 151–154.
Coynel, A., Scha¨fer, J., Blanc, G., Bossy, C., 2007. Scenario of particulate trace metal and metalloid transport during a major flood even t inferred from transient geochemical signals. Applied Geochemistry 22, 821–836.
Dyer, K.R., 1994. Estuarine sediment transport and deposition. Sedimen t Transport and Depositional Processes, 193–218.
Elbaz-Poulichet, F., Huang, W .W., Jednacak-Biscan, J., Martin, J.M., Thomas, A.J., 1982. Trace metal behaviour in the Gironde Estuary. Thalassia Jugoslavica 18, 61–95.
Elbaz-Poulichet, F., Holliger, P., Huan g, W.W ., Martin , J.M., 1984. Lead cycling in estuaries, illustrated by the Gironde Estuary, France. Nature 308, 409–414. Elbaz-Poulichet, F., Martin, J.M., Huang, W.W., Zhu, J.X., 1987. Dissolved Cd
behav-iour in som e selected French and Chinese Estuaries. Consequences on Cd supply to the ocean. Marine Chemistry 22 (2–4), 125–136.
Elbaz-Poulichet, F., Garnier, J.M., Gu an, D .M., Martin, J.M., Thomas, A.J., 1996. The conservative behaviour of trace metals (Cd, Cu, Ni an d Pb) and as in the surface p lu me of stratified estuaries: example of the Rhone River (France). Estuarine, Coastal and Shelf Science 42 (3), 289–310.
Florence, T.M., 1989. Electrochemical techniques for trace elements speciation in waters. In: Batley, G.E. (Ed.), Trace Element Speciation: Analytical Meth ods and Problems. CRC Press, Inc., Boca Raton, Florida, pp. 77–116.
Grousset, F.E., Jouanneau, J.M., Castaing, P., Lavaux, G., Latouche, C., 1999. A 70 year record of contamination from industrial activity along the Garonne River and its tributaries ( SW France). Estuarine, Coastal and Shelf Science 48, 401–414. Heral, M., Razet, D., Deslous-Paoli, J.M., Berthome´ , J.P., Garnier, J., 1982. Caracte´
ris-tiques saisonnie` res de l’hydrobiologie d u complexe estuarien de Maren nes Ole´ ron. Revue des Travaux de l’Institut des Peˆches Maritimes 46, 97–119.
IFREMER, 1994. Estuaire de la Gironde. Livre Blanc, Final Report (Brest), Agence de l’Eau Adour Garonne.
IFREMER, 2002. Re´ sultats d e la surveillance de la qualite´ d u milieu marin littoral De´ partements Gironde. Landes et Pyre´ne´es Atlantiques, Arcachon, 60 pp. Jouanneau, J.M., Latouche, C., 1981. The Gironde Estuary. 115 pp.
Jouanneau, J.M., Boutier, B., Latouche, C., Phillips, I., 1990. Cad m i um in the Gironde fluvio-estuarine system: behaviour and flow. Science of the Total Environment 97/98, 465–469.
Jouanneau, J.M., Castaing, P., Grousset, F., Buat-Menard, P., Pedemay, P., 1999. Recording and chronology of cad mi um by137Cs in the Gironde Estuary ( SW France). Comp tes Rendus de l’Acade´ m ie de Sciences, Sciences de la Terre et des Plane`tes 329, 265–270.
Kapsimalis, V., Masse´ , L., Tastet, J.P., 2004. Tidal impact on modern sedimentary facies in the Gironde Estuary, Southwes tern France. Journal of Coastal Research SI 41, 1–11.
Kraepiel, A.M.L., Chiffoleau, J.F., Martin, J.M., Morel, F.M.M., 1997. Geochemistry of trace metals in the Gironde estuary. Geochim ica et Cosmochimi ca Acta 61, 1421–1436.
Lapaquellerie, Y., Jouanneau, J.M., Maillet, N., Latouche, C., 1995. Pollution en Cd dans les se´ dim en ts d u Lot (France) et calcul du stock de polluant. Environ-mental Technology 16, 1421–1436.
Lekhi, P., Cassis, D., Pearce, C.M., Ebell, N., Maldonad o, M.T., Orians, K.J., 2008. Role of dissolved and particulate c adm iu m in the accumulation of c adm iu m in cultured oysters (Crassostrea gigas). Science of the Total Environment 393 (2–3), 309– 325.
Li, Z.H., Nguyen, K.D., Brun-Cottan, J.C., Martin, J.M., 1994. Numerical simulation of the turbidity m ax i m u m transport in the Gironde Estuary (France). Oceanologica Acta 17, 479–500.
Man eu x, E., Grousset, F.E., Buat-Me´ nard, P., Lavaux, G., Rimmelin, P., Lapaquellerie, Y., 1999. Temporal patterns of the wet deposition of Zn, Cu, Ni, Cd and Pb: the Arcachon lagoon (France). Water, Air, and Soil Pollution 114, 95–120.
Martino, M., Turner, A., N i m m o, M., Millward, G.E., 2002. Resuspension, reactivity and recycling of trace metals in the Mers ey Estuary, UK. Marine Chemistry 77, 171–186.
Mass on , M., Blanc, G., Scha¨ fer, J., 2006. Geochemical signals and source contribu-tions to heavy metal (Cd, Zn, Pb, Cu) fluxes into the Gironde Estuary via its major tributaries. Science of the Total Environment 370, 133–146.
Mass on , M., Scha¨ fer, J., Blanc, G., Pierre, A., 2007. Seasonal variations an d ann ual flu xes of arsenic in the Garonne, Dordogne and Isle Rivers, France. Science of the Total Environment 373, 196–207.
Meybeck, M., Horowitz, A.J., Grosbois, C., 2004. The geochemistry of seine river basin particulate matter: distribution of an integrated metal pollution index. Science of the Total Environment 328, 219–236.
Michel, P., Boutier, B., Chiffoleau, J.F., 2000. Net fluxes of dissolved arsenic, c ad mi um , copper, zinc, nitrogen and phosphorous from the Girond e Estuary (France): seasonal variations an d trends. Estuarine, Coastal and Shelf Science 51, 451–462.
Monbet, P., 2006. Mass balance of lead through a small macrotidal estuary: the Morlaix River Estuary (Brittany, France). Marine Chemistry 98, 59–80. Owens, R.E., Balls, P.W., 1997. Dissolved trace metals in the Tay Estuary. Estuarine,
Coastal and Shelf Science 44, 421–434.
RNO, 2006. Bulletin de Surveillance d u milieu marin, travaux d u Re´seau National d’Observation de la Qualite´ d u Milieu Marin. Ifremer.
Robert, S., Blanc, G., Scha¨fer, J., Lavaux, G., Abril, G., 2004. Metal mobilization in the Gironde Estuary (France): the role of the soft m u d layer in the m axi m u m turbidity zone. Marine Chemistry 87, 1–13.
Scha¨ fer, J., Blanc, G., Bossy, C., Gue´ rin, F., Lapaquellerie, Y., Lavaux, G., Lissalde, J.P., Mass on , M., Maillet, N., Robert, S., 2002a. Bud get of the metal inputs into the Gironde Estuary: Cd desorption process in the salinity gradient (Bilan des apports me´ talliques a` l’estuaire de la Gi ronde: processus de de´ sorption de c ad m i u m dans le gradient de salinite´ ). Final scientific report, Liteau Program. Scha¨ fer, J., Blanc, G., Lapaquellerie, Y., Maillet, N., Man eux, E., Etcheber, H., 2002b.
Ten-year-observation of the Gironde tributary fluvial system: fluxes of sus-pend ed matter, particulate organic carbon and cadmi um . Marine Chemistry 79, 229–242.
Scha¨ fer, J., Blanc, G., Audry, S., Cossa, D., Bossy, C., 2006. Merc ury in the Lot-Garon ne River system (France): sources, fluxes and anthropogenic compon en t. Applied Geochemistry 21, 515–527.
Shiller, A .M., Boyle, E.A., 1991. Trace elements in the Mississippi River Delta ou tflow region: behaviour at high discharge. Geochemica Cosmochemica Acta 55, 3241–3251.
Sottolichio, A., Castaing, P., 1999. A synthesis on seasonal dynamics of highly-concentrated structures in the Gironde Estuary. Comp tes Rendus de l’Academie de Sciences, Sciences de la Terre et des Planetes 329, 795–800.
Tang, D., Warnken, K.W., Santschi, P.H., 2002. Distribution and partitioning of trace metals (Cd, Cu, Ni, Pb, Zn) in Gavelston Bay waters. Marine Chemistry 78, 29–45.
Turner, A., Millward, G.E., Bale, A.J., Morris, A.W., 1993. Application of the K D concept to the study of trace metal removal and desorption during estuarine mixing. Estuarine, Coastal and Shelf Science 36, 1–13.
Turner, A., 1996. Trace-metal partitioning in estuaries: importance of salinity and particle concentration. Marine Chemistry 54, 27–39.
Waeles, M., Riso, R.D., Maquer, J.F., Le Corre, P., 2004. Distribution and chemical speciation of dissolved c ad m i u m and copper in the Loire estuary and North Biscay continental shelf, France. Estuarine, Coastal and Shelf Science 59, 49–57. Waeles, M., Riso, R.D., Le Corre, P., 2005. Seasonal variations of c ad m i u m speciation in the Penze´ Estuary, N W France. Estuarine, Coastal and Shelf Science 65, 143–152.
W en , L.S., Santschi, P., Gill, G., Paternostro, C., 1999. Estuarine trace metal distri-bution in Gavelston Bay: importance of colloidal forms in the speciation of the dissolved phase. Marine Chemistry 63, 185–212.
W i n d om , H., Smith Jr., R., Rawlinson, C., Hungspreugs, M., Dharmvanij, S., Wattayakorn, G., 1988. Trace metal transport in a tropical estuary. Marin e Chemistry 24, 293–305.
Zwolsman, J.J.G., Van Eck, B.T.M., Van Der Weijden, C.H., 1997. Geochemistry of dissolved trace metals (cadmium, copper, zinc) in the Scheldt estuary, sou thwestern Netherlands: impact of seasonal variability. Geochi mica et Cos mochi -mica Acta 61, 1635–1652.