UNIVERSITÉ DU QUÉBEC À MONTRÉAL
ON THE LARGE SCALE CONTROL MECHANISMS OF ARCTIC SEA ICE AND PERMAFROST USING REGIONAL CLIMATE MODELS
THE SIS PRÉSENTED
AS PARTIAL REQUIREMENT
FOR PHD DEGREE IN BARTH AND ATMOSPHERIC SCIENCES
BY
JEAN-PHILIPPE PAQUIN
UNIVERSITÉ OU QUÉBEC À MONTRÉAL Service des bibliothèques
Avertissement
La diffusion de cette thèse se fait dans le respect des droits de son auteur, qui a signé le formulaire Autorisation de reproduire et de diffuser un travail de recherche de cycles supérieurs (SDU-522- Rév.01-2006}. Cette autorisation stipule ·que «conformément à l'article 11 du Règlement no 8 des études de cycles supérieurs, [l'auteur] concède
à
l'Université du Québecà
Montréal une licence non exclusive d'utilisation et de publication de la totalité ou d'une partie importante de [son] travail de recherche pour des fins pédagogiques et non commerciales. Plus précisément, [rauteur] autorise l'Université du Québecà
Montréalà
reproduire, diffuser, prêter, distribuer ou vendre des copies de [son] travail de recherche à des fins non commerciales sur quelque support que ce soit, y compris l'Internet. Cette licence et cette autorisation n'entraînent pas une renonciation de [la] part [de l'auteur]à
[ses] droits moraux nià
[ses] droits de propriété intellectuelle. Sauf entente contraire, [l'auteur] conserve la liberté de diffuser et de commercialiser ou non ce travail dont [il] possède un exemplaire.»ÉTUDE
DES
MÉCHANISMES
DE
GRANDE ÉCHELLE INFLUENÇANT LA
GLACE
DE
MER ARCTIQUE ET LE PERGÉLISOL À L
'
AIDE
DE
MODÈLES
RÉGIONAUX
DE
CLIMAT
THÈSE
PRÉSENTÉE
COMME EXIGENCE PARTIELLE
DU DOCTORAT
EN SCIENCES
DE
LA TERRE
ET
DE
L
'ATMOSPHÈRE
PAR
JEAN
-PHILIPPE PAQUIN
REMERCIEMENTS
Je tiens à remercier tout d'abord ma directrice de thèse, Laxmi Sushama. L'accomplissement de ce travail de recherche n'aurait pu être possible sans son support au cours des cinq dernières années. Un merci spécial à mes collaborateurs suédois Ralf Doscher et Torben Kônigk ainsi que l'ensemble de l'équipe du Centre Rossby qui, malgré un océan de distance, ont toujours trouvé le temps de m'épauler dans mes recherches sur 1' océan et la glace de mer.
D'autres professeurs et collègues chercheurs ont aussi contribué par les nombreuses discussions constructives au succès de ce travail, en particulier : Bruno Tremblay, Michelle Garnaud, Richard Harvey, Colin Jones, Bernard Dugas et, bien évidemment, René Laprise.
Le travail présenté dans cette thèse n'aurait pu être accompli sans le support de Katja Winger qui a toujours su prendre le temps de m'aider avec les nombreux défis techniques que représente l'utilisation du MRCC5 et le développement d'un nouveau paramétrage. Je voudrais aussi remercier les autres membres de l'équipe de soutien et d'enseignement de l'UQAM: Eva Monteiro, Georges Huard, Nadjet Labassi, Adelina Alexandru et Delphine Person.
Le travail et la vie à l'UQAM n'auraient été aussi agréables sans la présence de nombreux collègues, rapidement devenus amis et parfois même confidents. Je vous salue et vous remercie, vous tous, et plus particulièrement Danahé et Marko pour votre soutien quand le ciel était moins bleu mais surtout pour tous les bons moments que nous avons passés ensemble au cours de ces nombreuses années ... et aussi pour les années à venir!
Je voudrais remercier ma famille, toujours présente pour m'encourager et me soutenir dans ce projet ambitieux qu'est le doctorat. Finalement, un merci sans mesure à ma
conjointe, Isabelle, pour son soutien indéfectible tout au long des années et pour avoir accepté de vivre avec moi notre prochaine expérience de Vie à Halifax!!!
Quoique l'UQAM soit une institution de langue française, cette thèse est essentiellement présentée en anglais afin d'élargir le bassin de lecteurs et de réviseurs externes. Je présente mes sincères excuses aux lecteurs de cet ouvrage pour qui ce pourrait être problématique.
TABLE OF CONTENT
LIST OF FIGURES ... ... ... ... . v LIST OF TABLES ... ... ... ... ... xi LIST OF ACRONYMS ... ... ... ... ... xiii RÉSUMÉ ... ... .. ... ... ... ... xv ABSTRACT .. ... ... .. ... ... ... xvii INTRODUCTION ... ... ... .... ... ... ... .... 1 CHAPTERI CAUSES AND CONSEQUENCES OF MID 21 sT CENTURY RAPID ICE LOSS EVENT SIMULATED BY THE ROSSBY CENTRE REGIONAL ATMOSPHERE-OCEAN MODEL ... ... ... .. ... .. .... .. ... 17 1.1 Introduction ... ... ... ... 181.2 Mode! Description and experimental design ... ... 22
1.2.1 Mode! description . . . 22
1.2.2 Experirnents ... ... ... ... ... ... .. 23
1.3 RCAO Climatology ... ... ... ... ... 24
1.4 Rapid lee Loss Events ... ... ... ... 26
1.4.1 Rapid lee Loss Events ... ... ... 26
1.4.2 Causes and effects ofRILES ... ... ... ... 27
1.4.3 Impacts ofRILEs ... 38
1.5 Discussion and Conclusions . . . 40
CHAPTERII ON THE SIMULATED ARCTIC NEAR-SURFACE PERMAFROST AND CLIMATE SENSITIVITIES TO SOIL AND SNOW FORMULATIONS ... ... 61
2.1 Introduction .. ... ... .. .. ... ... 62
2.2 Mode! description ... ... ... .... ... 65
2.2.2 The Canadian Regional Climate Mode! ... ... ... ... ... 66
2.3 Mode! Setup .... ... ... ... ... ... 66
2.3.1 CLASS and CRCM5 configurations ... ... ... .. 66
2.3.2 Soil carbon data and parameterization ... ... ... .. ... 67
2.3.3 Mode! experiments .... ... ... ... ... .. 69
2.4 Large-scale data for mode! evaluation ... ... .. ... ... 70
2.5 Results ... ... ... .... ... ... ... 73
2.5 .1 Offline results .. ... ... ... ... ... . 73
2.5.2 Results from CRCM5 Experiments .. ... ... ... ... . 79
2.6 Summary and conclusions ... ... ... ... .. 91
CONCLUSION ... ... ... ... .. 113
LIST OF FIGURES
Figure Page
I.l Topography and bathymetry of the Arctic based on the ETOP05 data set, NOAA 1988 (AMAP 1998)... ... ... ... 14 !.2 Illustration of mutually supporting pro cesses favoring acceleration of the
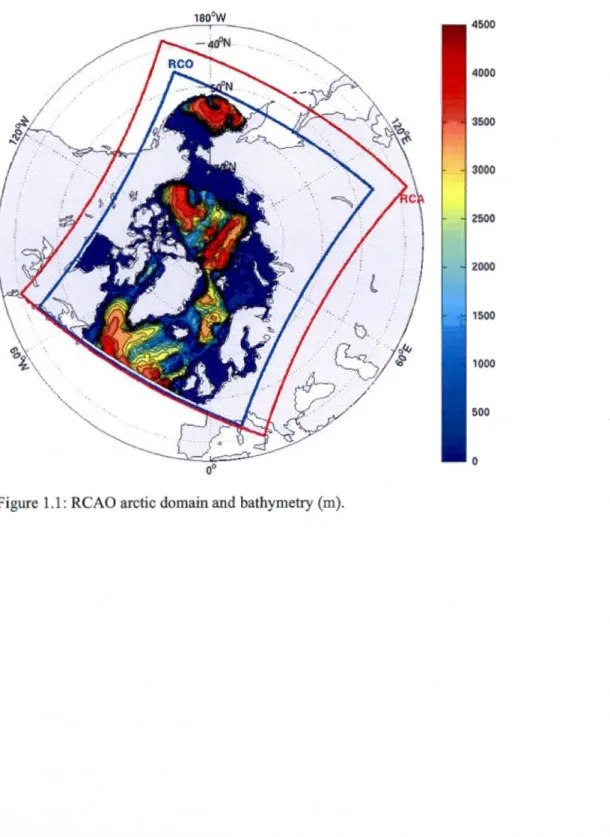
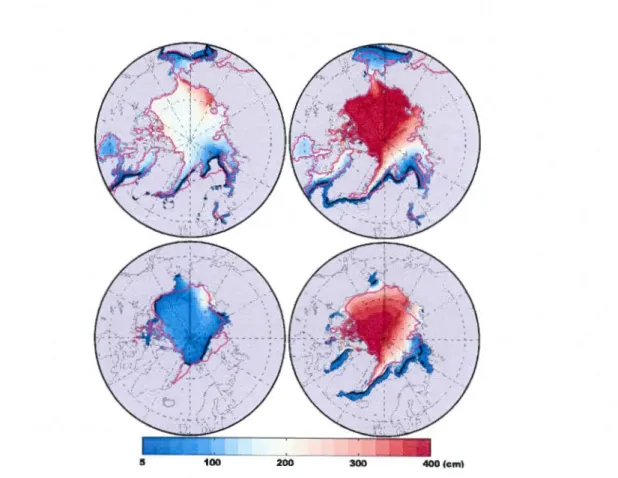
September sea ice trend. . . . 15 1.1 RCAO arctic domain and bathymetry (rn). . . . 45 1.2 1980-1999 average sea ice thickness (cm) and sea ice margin (SIC> 15%;
black contours) for the ensemble mean of the three RCAO climate projections (left) and ECHAM5/MPI-OM (right) for March (top) and September (bottom). ERA-Interim sea ice margin location is shown in magenta contour. . . . 46 1.3 1980-1999 average of 2 rn-air temperature (colors) and sea leve! pressure
(contours) for ERA-Interim (left), ensemble mean of the three RCAO projections (middle) and ECHAM (right) for March (top) and September (bottom). . . 47 1.4 1980-1999 differences for 2 rn-air temperature (colors) and sea leve! pressure
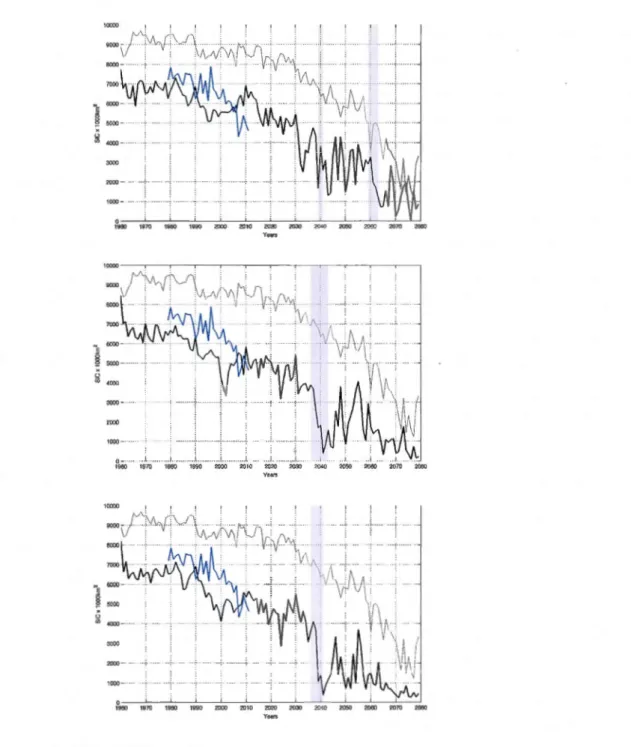
(contours) between RCAO minus ERA-Interim (left) and ECHAM minus Era-lnterim (right) for March (top) and September (bottom) . . . 48 1.5 RCAO simulated September sea ice extent is shown in black for the 1980
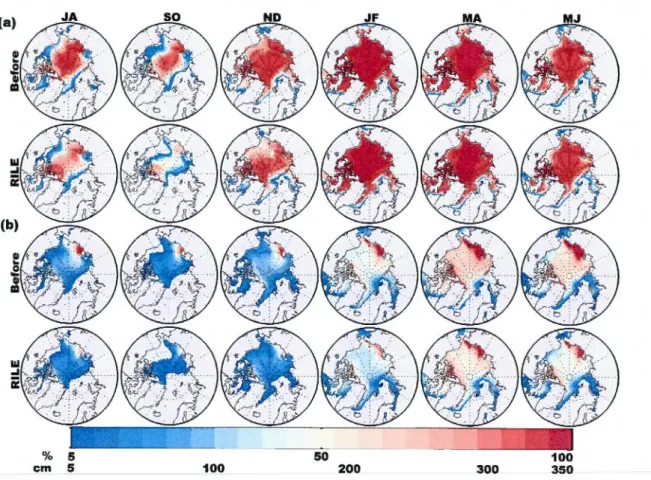
-2080 period: ECHstand2 (top), ECHMPistand (middle) and ECHMPiflux (bottom). Grey shadings indicate Rapid lee Loss Events considered in this study (Table 1.2). ECHAM and satellite observations (Fetterer et al., 2002; updated 2011) of September sea ice extent are presented respectively in light grey and blue on ali panels. . . 49 1.6 Bimonthly averages of (a) sea ice cover (fraction) and (b) thickness (cm) for
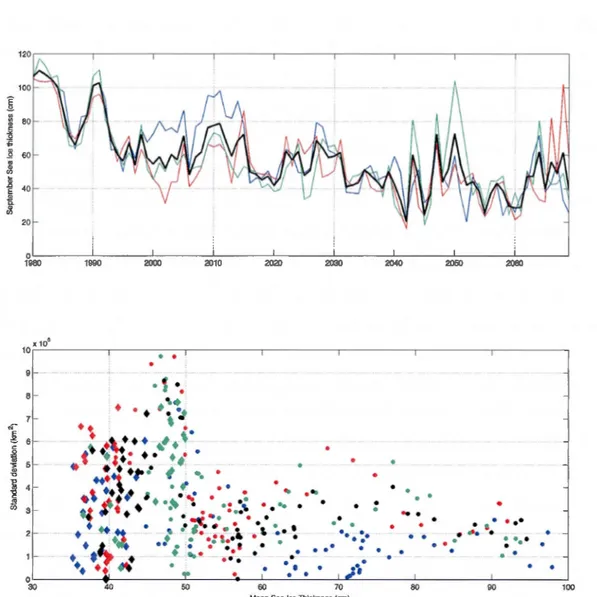
pre-RILE (top) and RILE (bottom) period for R2 (2039 event, projection ECHMPistand). . . 50 1.7 (top) Average September sea ice thickness for ECHStand2 (blue),
ECHMPIStand (red), ECHMPIF!ux (green) and ensemble average (black). (bottom) Relation between 20-year standard deviation of September Sea lee Extent to 20-year average sea ice thickness. Dots are used for 1980-2040 period, while diamonds corresponds to the 2041-2070 period. Same color code as in the top panel with black symbols representing the ensemble average of the three simulations. . . 51
1.8a Bimonthly differences of RILE-(Pre-RILE) averages for R2 event: sea ice caver (SIC, %), sea ice thickness (SIT, cm), 2 rn-air temperature (T2M, o
q
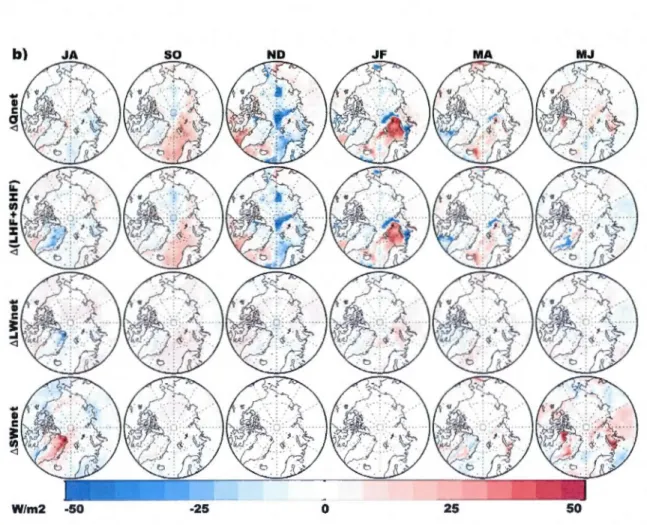
and statistical significance of the 2 rn-air temperature following a t-test at significance levels: 80%-blue, 90%-green, 95%-yellow and 99%-red. The 1 00-year trend in 2 rn-air temperature was removed prior to statistical significance testing. . . 521.8b 1.8b same as Fig. Sa but for: surface net radiative balance (Qneto wm-2), combined latent and sensible heat fluxes (LHF+SHF, wm· \ net surface longwave (LWneto Wm-\ and net surface shortwave (Qneto Wm-2). Fluxes are defined negative upward with respect to the surface. . . . 53
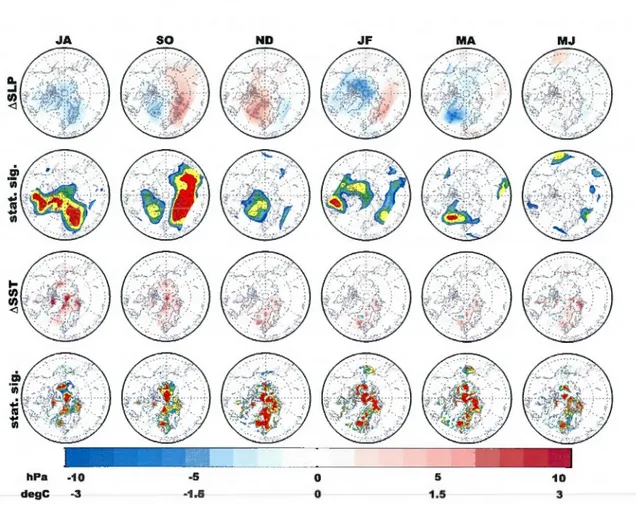
1.9 Bimonthly differences of RILE-(Pre-RILE) averages for R2 event sea leve! pressure (1 st row), sea surface temperature (3rd row) and their statistical significance (2"ct and 4th row). The blue, green, yellow and red shadings correspond to 80%, 90%, 95% and 99% confidence levels of the statistical significance. . . 54
1.10 Average MJJASO anomalies between 2041 against the 2010-2030 period for: sea ice cover (top left), shortwave radiation down at the surface (top middle), shortwave radiation absorbed by the ocean (top right), longwave radiation down at the surface (bottom left), sea surface temperature (bottom middle) and 2 rn-air temperature (bottom right). Radiative flux anomalies are presented in wm-2 and temperatures anomalies in
o
c.
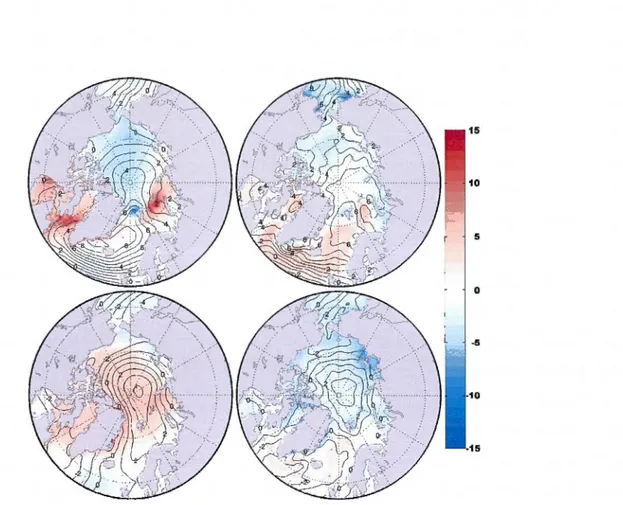
Contours show the location of the 2041 sea ice margin (sea ice caver> 15%) for June (yellow), July (cyan), August (green), September (grey) and October (black).. .... ... 551.11 Changes in 850 hPa geopotential height for March-April (first row), statistical significance (second row), September-October (third row) and its statistical significance (fourth row) between period around RILEs (2036-2042) and the preceding 1 0-year period (2026-2035) for the driving mode! ECHAM, RCAO events R1, R2 and R3, from left to right respectively. The blue, green, yellow and red shadings correspond to 80%, 90%, 95% and 99% confidence levels of the statistical significance of a t-test. The last column represents the standard deviation amongst RCAO for the three projections. . . 56
1.12 Time series of the Barents Sea opening annual (a) oceanic heat transport (PW) and (b) volume transport (Sv) computed using a reference temperature of -0.1
o
c
over the first 290 rn (mode! first 25 verticallevels) for three RCAO climate projections: ECHstand2 (grey line), ECHMPistand (black solid line) and ECHMPiflux (black dashed line). . . . 571.13 Summer and autumn seasonal standard deviation of sea ice cover for post-RILE (left), pre-post-RILE (middle) and their differences (right) for R2 event. . . . 58
colors) and Post-RILE minus Pre-RILE (light colors) over the Arctic Ocean (top left), Arctic Land (bottom left), Siberian Sea (top right) and Siberian Land (bottom right). Arctic land is defined between 45-290°E and between 65°N and the coast white the Siberian sector is defined between 11 0-190°E and 65-90°N. . ... ... ... ... ... .
1.15 November-December (a) spatially averaged vertical temperature profile over Arctic Ocean (blue), Siberian Sea (cyan), pan-Arctic land (red) and Siberian Sea land sector (green) for Pre-RILE (full) and RILE periods ( dotted). (b) differences RILE-(Pre-RILE) for same regions. The Arctic Ocean here is the region between latitudes 80-90°N between 90°W to 60°E and from 68-90°N from 60°E to 90°W. The Siberian Sea covers longitudes between ll0°E to 190°E from the coastline to 90°N, white the Siberian Land covers land from
Vll
60°N to the coastline. . . 60
2.1 (a) CRCMS topography (rn); (b) Number of permeable layers. Dark red regions represent deep peatlands where Letts et al. (2000) parameterization is used. (c) Soi! organic concentration (kg m-2) from IGBP-DIS for the first 100 cm of soi!. (d) Number of soi! organic layers considered in Off OM47, Off_OMSC47, C_OM47 and C_OMSC47. Red regions are similar to those in (b ), white green (blue) regions represent grid points where 10 cm (30 cm) of organic soil are used. . . 97
2.2 (a) Observed permafrost extent (continuous, discontinuous, sporadic and isolated) from the International Permafrost Association (IPA) (Brown et al. 1998); (b )-( e) Mode led permafrost extent and AL Ts for the offline simulations for the 1990-2008 period. . . 98
2.3 (a) Location of selected CALM sites used in the evaluation of ALTs (red). (b) Averaged 1990-2008 observed vs. modeled annual maximum ALTs for CLASS offline simulations: Off_Mine6 (red); Off_Mine47 (green); Off_ OM47 (blue); Off_ OMSC47 (black). For all experiments, the number in brackets indicates the number of stations used for comparison. . . . 99
2.4 (left) Simulated and observed mean annual soil temperatures for stations within the region bounded by 20-190°E and 55-90°N. (right) Mean annual cycle of observed (grey) and simulated soil temperature: Off_Mine6 (red); Off_Mine47 (green); Off_OM47 (blue) and Off_OMSC47 (black). Dashed line on top right plot represents 2 rn-air temperature for UDel (grey) and that from ERA-Interim (black) used to drive CLASS offline. . . lOO
2.5 Averaged mean monthly soil temperature for the 1990-2008 period for Northwest Siberia (55-90°N, 60-90°E; blue shaded region in the left central panel), for various CLASS offline simulations and differences relative to the deep mineral configuration (Off_Mine47). No vertical interpolation of the temperature is done therefore results are presented on modellevels. . . . 101
2.6 Monthly averages of ground heat flux at the soillsnow (atmosphere) interface for Northwestem Siberia (60-90°E, 55-75°N) for the 1990-2008 period for: Off_Mine6 (red), Off_Mine47 (green), Off_OM47 (blue) and Off_OMSC47 (black). . . 102 2.7 Annual cycle of (a) liquid water content and (b) frozen water content for the
first soi! layer, (c) surface runoff, (d) sub-surface runoff, (e) SWE and (f) evaporation, over Northwestem Siberia (60-90°E, 55-75°N) computed over the 1990-2008 period for CLASS offline simulations: Off_Mine6 (red), Off_Mine47 (green), Off_OM47 (blue) and Off_OMSC47 (black). Numbers on top of the subpanels represent the annual average values for Off_ Mine6, Off_Mine47, Off_OM47 and Off_OMSC47 in order. Grey !ines snow observational data of SWE for GlobSnow (full line) and CMC SWE (dashed)... . . 103 2.8 Comparison of averaged 2 rn-air temperature (0
C) for DJF (left) and JJA (right) for C_Mine47 (1 st row) and differences with ERA-Interim (2"d row), UDel dataset (3rd row) and CRU TS3.1 dataset (4th row), for the 1990-2008 period... ... ... . . . 104 2.9 Comparison of averaged precipitation (mm month-1) for DJF (left) and JJA
(right) for C_Mine47 (1 st row) and differences with ERA-Interim (2"d row), UDel dataset (3rd row) and GPCC dataset (4th row), for the 1990-2008 period. . . 105 2.10 Comparison of average SWE (cm) for NDJFM for: (a) C_Mine47, (b)
GlobSnow, (c) the difference C_Mine47-GiobSnow, (d) CMC SWE analysis, (e) the difference C Mine47-CMC. Mountainous areas are masked in GlobSnow dataset due to insufficient data and high uncertainties; therefore no comparison is made with mode led snow mass over these areas. . . 106 2.11 (a) Observed permafrost extent (continuous, discontinuous, sporadic and
isolated) from the International Permafrost Association (IPA) (Brown et al. 1998); (b )-( e) Modelled permafrost extent and ALTs for the CRCM5 simulations for the 1990-2008 period. . . . 107 2.12 (top) Comparison of summer (June-July-August) climatology of (le ft) latent
heat flux, (middle) sensible heat flux and (right) 2 rn-air temperature between C_OM47 and C_Mine47 over the 1990-2008 period. (bottom) Statistical significance of the differences using a t-test. . . 108
2.13 Average annual cycle of (a) latent heat flux, (b) sensible heat flux (Wm-2) and (c) 2 rn-air temperature (0
C) for needle leaf trees (full !ines) and grasslands (dashed !ines) between 55-75°N and 45-270°E for the 1990-2008 period for simulations Off_Mine6 (red), Off_Mine47 (green), Off_OM47 (blue) and Off_OMSC47 (black). (d) Annual cycle of soi! saturation for the
IX
first two soillayers: 0-10 cm (full !ines) 10-30 cm (dashed !ines) for needle leaftrees. Identical color codes are used to designate experiments. . . 109 2.14 (top) Trends in AL T for the 1960-2008 period for C _ Mine4 7 (left),
C_OM47 (middle) and C_OMSC47 (right). Grey regions represent grid cells where permafrost is not present for the entire simulation period. (bottom) Statistical significance of the trends defined using the Mann-Kendall test. . . . 110 2.15 Relation between AL T departure and average annual 2 rn-air temperature
(top), degree-day thawing index (middle) and degree-day freezing index (bottom) for experiments: C_Mine47 (green), C_OM47 (blue) and C _ OMSC4 7 (black) over the respective regions where ALT trends are significant at a 90% confidence leve!. . . 111 2.16 (left) Time series of degree-day freeze (a) and degree-day thaw (b) over grid
points where ail experiments shows statistically significant AL T trends at 90% confidence level. Experiments C_Mine47 (green), C_OM47 (blue), C _ OMSC4 7 (black) and observations from UDel (cyan) and CRU (magenta) are presented. Normalized time series and statistically significant linear trends are presented for DDF (c) and DDT (d)... ... 112 C.1 Figure C.l: Map of peatland coverage for the Canadian Boreal Forest
Data Source: Tamocai, C., I.M. Kettles and B. Lacelle. 2002. Peatlands of Canada Database. Geological Sm·vey of Canada, Open File 4002.... ... 120 C.2 Figure C.2: Map of soil carbon density for the Canadian Boreal Forest. Data
Source: Charles Tarnocai and Barbara Lacelle, Eastern Cereal and Oilseed Research Centre, Agriculture and Agri-Food Canada. . . 121
Xl
LIST OF TABLES
Tables Page
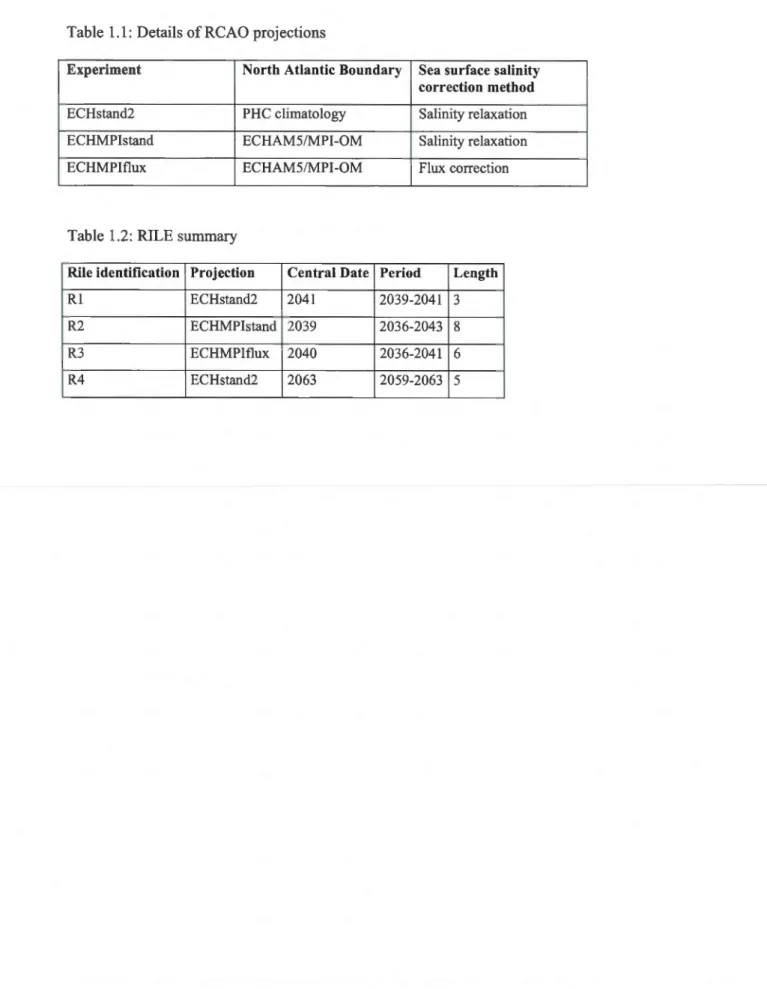
1.1 Details ofRCAO projections ... ... ... ... ... . 40
1.2 RILE summary ... ... ... ... . 40
2.1 List of experiments . . . . ... ... .. ... . 91
2.2 Permafrost extent (x106 km2) located North of 45°N and averaged Active Layer thickness (rn) over 1990-2008 period ... . 91 2.3 Annual mean soi! temperature biases relative to longitudinal position of the
ACIA AIDJEX ALT AO AOGCM CAA CALM CAM CCSM CLASS CLM CMC CMIP CO RD EX CRCMS CRU DDF DDT EOF
ERA
GPCC IGBP-DIS IPA IPCC JULES LBC LHF LSM MRCCS NAM LIST OF ACRONYMSArctic Climate Impact Assessment Arctic lee Dynamics Joint Experiment Active Layer Thickness
Arctic Oscillation
Coupled Atmosphere-Ocean General Circulation Mode! Canadian Arctic Archipelago
Circumpolar Active Layer Monitoring programme Community Atmospheric Mode!
Community Climate System Mode! Canadian Land Surface Scheme Community Land Mode!
Canadian Meteorological Centre Coupled Mode! Intercomparison Project
COordinated Regional Downscaling Experiment
Fifth-generation of the Canadian Regional Climate Mode! Climatic Research Unit
Degree-day freezing index Degree-day thawing index Empirical Orthogonal Functions European Re-Analysis
Global Precipitation Climatology Center
International Geosphere-Biosphere Progamme Data Information System International Permafrost Association
Intergovernrnental Panel on Climate Change Joint UK Land Environrnent Simulator Lateral boundary condition
Latent heat flux Land Surface Madel
Modèle Régional Canadien du Climat de cinquième génération Northern Annular Mode
NAO NSIDC OHT PHC RCA RCAO RCM RCO RILE SHF SIC SLP SMHI
soc
SST SWE T2M UDel WCRPNorth Atlantic Oscillation
National Snow and lee Data Center Ocean beat transport
Polar science center Hydrographie Climatology Rossby Centre Atmospberic model
Rossby Centre Atmospbere-Ocean Regional Climate Model
Rossby Centre Ocean model Rapid lee Loss Event Sensible beat flux Sea ice cover Sea level pressure
Swedisb Meteorological and Hydrological Institute Soil organic content
Sea surface temperature Snow water equivalent 2 rn-air temperature University of Delaware
RÉSUMÉ
La complexité des processus physiques et les nombreuses rétroactions entre les différentes composantes du système climatique présentent des défis particuliers à la simulation du climat arctique. Cette thèse propose d'approfondir certains aspects du climat de 1 'Arctique avec une attention particulière sur les interactions et les rétroactions entre les composantes majeures du système climatique de l'Arctique et comment celles-ci sont influencées par le changement climatique. En premier lieu, un analyse détaillée des mécanismes physiques responsables de la simulation d'évènements de perte rapide de la glace de mer, i.e. une diminution abrupte de la couverture de glace de mer en septembre, est effectuée pour trois projections climatiques effectuées par le Modèle Régional Atmosphère-Océan du Centre Rossby (RCAO). Deux processus importants, agissant à différentes échelles temporelles, sont identifiés comme responsables de la simulation de tels évènements, soit la diminution progressive de l'épaisseur de la glace de mer qui a pour effet de rendre la glace de mer plus vulnérable à la fonte et la présence d'anomalies dans le transport de chaleur atmosphérique et océanique au-dessus du secteur Atlantique de 1 'Océan Arctique. Notre analyse démontre que la propagation d'une anomalie importante dans la circulation atmosphérique de grande échelle à partir de la frontière latérale située dans 1 'Atlantique est responsable de la synchronisation des évènements autour de 2040 se produisant dans chacune des trois projections climatiques effectuées avec RCAO. Cette anomalie de circulation a pour origine les champs atmosphériques provenant d'une projection climatique unique d'un MCCG utilisée comme données de pilotage pour toutes les projections de RCAO. Au-dessus du Secteur Pacifique de l'Océan Arctique, une anomalie dans le transport de la glace de mer, poussant la glace de la côte de l'Alaska vers le centre de la mer de Beaufort provoque une rétroaction positive glace de mer-albédo (Sea ice-albedo feedback) favorisant une fonte plus prononcée de la glace durant la même période.
Le second aspect traité dans cette thèse a pour objectif d'évaluer la sensibilité des régimes thermiques et hydrauliques du sol des continents bordant 1 'Arctique, donc par conséquent le pergélisol, à la formulation du modèle et de la neige ainsi que leur impacts sur le climat de surface en Arctique. Plus précisément, nous évaluons la sensibilité des régimes thermiques et hydrauliques du sol à la configuration verticale et la profondeur totale de la colonne de sol, à l'ajout d'un paramétrage pour la représentation de la matière organique ainsi que différentes formulations de la relation entre la conductivité thermique et la densité de la neige à l'aide d'expériences en mode non-couplé du schéma de sol Canadian LAnd Surface Scheme (CLASS). Les résultats démontrent des améliorations successives de la simulation de la température du sol résultant de l'augmentation de la profondeur totale de la colonne de sol, de l'implémentation du paramétrage de la matière organique du sol ainsi que d'une diminution de la conductivité thermique de la neige. Les effets de ces améliorations apportées au schéma de sol sur le climat simulé, en particulier sur le bilan énergétique de surface, sont analysés plus en profondeur à l'aide d'expériences effectuées avec le Modèle Régional Canadien du Climat de cinquième génération (MRCC5). L'implémentation du paramétrage de la matière organique du sol a pour effet en augmentation marquée des flux de
chaleurs sensible et latente dont les proportions respectives sont fonctions de la disponibilité de l'humidité du sol et du niveau de saturation. Quoique les différences obtenues dans les flux turbulents de surface soient statistiquement significatives, peu de changements sont notés dans le climat de surface au-dessus des régions couvertes par du pergélisol continu ou discontinu. Les résultats du MRCC5 montrent que la variabilité interannuelle de la couche active du sol (CAS; i.e. la profondeur de dégel maximale annuelle) est directement liée aux variations de la température de l'air en surface et montre une dépendance annuelle. La surestimation de la profondeur de la CAS est fort probablement causée par la présence de biais chauds observés dans la climatologie simulée du MRCC5 puisque les tendances simulées ne montrent pas de différences significatives avec celles des observations.
Mots-clés:
ABSTRACT
The climate simulation of the Arctic region presents distinct challenges because of the complexity of processes and feedbacks between the various components of the climate system. This thesis focuses on understanding sorne selected aspects of the Arctic climate, particularly the interactions and feedbacks between the major components of the Arctic climate system and how they are affected by climate change. To this effect, firstly, the physical mechanisms responsible for the Rapid lee Loss Events (RILEs), i.e. the abrupt reduction of the September sea ice cover, in the Rossby Centre Ocean-Atmosphere (RCAO) regional climate mode! simulations are investigated. Two major processes, occurring at different timescales, are found responsible for the RILEs in the three RCAO climate projections considered in this study: the long-term thinning of the sea ice leading to increased vulnerability of the ice cover, and the anomalous atmospheric and oceanic heat transport through the Atlantic Sector of the Arctic Ocean. Investigation across the three RCAO projections reveals that a strong large-scale atmospheric circulation anomaly originating from the driving GCM realization propagating through the Atlantic lateral boundary of the regional mode! is responsible for the synchronicity of the simulated RILEs around 2040. Over the Pacifie Sector of the Arctic Ocean, anomalous sea ice drift from the Alaska coast towards the Beaufort Sea triggers a sea ice-albedo feedback leading to increased sea ice melt over the same period.
The second major aspect investigated in this thesis is the sensitivity of the Arctic soi! thermal and moisture regimes over the continental areas surrounding the Arctic Ocean, and therefore near-surface permafrost, to soil and snow formulations in land surface models and their impact on the surface climate. More precisely, the sensitivity of the soi! thermal and moisture regimes to soil layer configuration and depth, representation of soi! organic carbon ( organically rich soils) and snow conductivity formulation are explored in stand-alone simulations with the Canadian LAnd Surface Scheme (CLASS). Results showed major improvements of the simulated soil temperatures and a reduction of the annual maximum thawing depth with deeper soi! mode!, representation of soi! organic carbon and modified snow thermal conductivity. The impact of the above improvements on the surface climate, particularly surface energy partitioning, is further investigated using the fifth-generation of the Canadian Regional Climate Mode! (CRCM5). The implementation of the soi! organic carbon increases both latent and sensible heat fluxes, as function of the available soil moisture and saturation leve!. Despite statistically significant changes in the surface energy partitioning, little significant changes were noted in the surface climate over the continuous and discontinuous permafrost region. The inter-annual variability of the active layer thickness (AL T; i.e. the maximum annual thaw depth) within the CRCM5 experiments is found tightly linked with the surface air temperatures and shows yearly dependence. The overestimation of the simulated ALTs is likely caused by a warm bias noted in the CRCM5 surface climate, while simulated trends in surface climate are not significantly different from those observed.
Key words:
INTRODUCTION
"The Aretie
biologieal, climatologie
,
hydrologie
subsystems and
th
eir
thermal r
eg
imes are Jully
coupled
and
cannat
be
complete/y
understood or
isolat
e
d individually.
(. .
.) No single
pi
e
ce
of the
system
is independent,
and to
Jully
understand even
a part
of
the
system, we
ne
e
d to understand
the whole. "
- Hinzman et al. (2005)
General context
In the past decades, the Arctic climate has shown sorne undeniable signs of change. The Arctic average annual temperatures have already risen by about 2
oc
to 3oc
since the 1950s and the winter temperatures by up to 4 °C (ACIA 2004) with a more pronounced warming over land (Chapman and Walsh 2007). Although large inter-annual to inter-decadal variability in temperatures is present in the Arctic (ACIA 2004), significant part of the warming in the Polar Regions was attributed to human influence (Gillett et al. 2008).The Arctic region is expected to warm strongly as a result of the anthropogenic elima te change, mainly due to the positive feedbacks associated with a decrease of the surface albedo caused by the shrinking snow and ice cover. Climate change projections realized with coupled atmosphere-ocean general circulation models (AOGCMs) for the 2151
Century suggest maximum warming for the Arctic region (IPCC AR4 2007; ACIA 2004). Although ali models agree on the warming of the Arctic, large uncertainties remains as can be seen in the large spread amongst the individual mode! projections (ACIA 2004).
Understanding the environmental conditions in the Arctic is a non-trivial task. The isolated location and rigorous climate pose supplementary challenges for observational study of the climate and the environment. A growing interest exists to understand the Arctic climate and its interactions with the different ecosystems. The Arctic countries are also interested in the evolution of the Arctic climate to assure the protection of its unique habitats or for economie development. The economie development might threaten the unique and fragile ecosystems of the region. Therefore, the scientific community strongly recommends that
more research be conducted to insure a durable exploitation of the natural resources of the Arctic, with limited success until now.
Studying the Arctic climate is challenging due to the presence of large natural variability combined with the effects of increased greenhouse gases concentration due to human activity. The combination of both signais and the limited availability, both in space and time, of in-situ observations of the Arctic pose problems and therefore the numerical modelling approach offers sorne advantages.
The overall goal of this thesis is to address sorne uncertainties m the actual understanding of different aspects of the Arctic climate, namely the Rapid lee Loss Events and the evolution and sensitivity of near-surface permafrost. The main tools used for this are Regional Climate Models (RCM) and observation datasets where available. A brief description of the Arctic climate components, their interactions and representation in climate models is given below to better understand the context in which these studies were performed.
The Arctic climate system
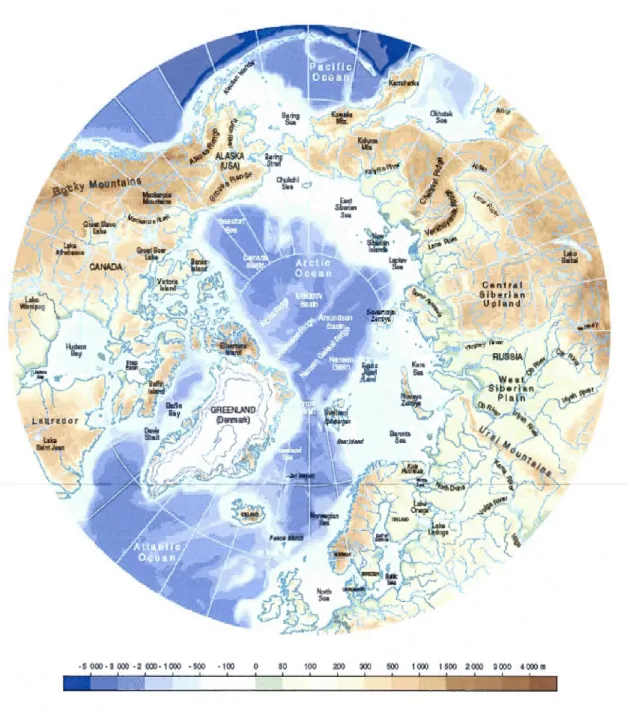
The most fundamental characteristic of the Arctic is the 24-hour summer daylight or winter darkness with the nurnber of days in these extremes increasing with latitude (Serreze and Barry 2005). The geographical configuration of the Arctic region is characterized by a central ocean, nearly enclosed by the continental masses of North America and Eurasia (Fig. I.l ), reducing the oceanic exchanges with the lower latitudes. The multiple interactions between the atmosphere, land and ocean make the Arctic an interesting but challenging region to study.
The Arctic Ocean co vers significant are a of the northem hemisphere high latitudes and plays a major role in defming the Arctic climate. The main singularity of the Arctic Ocean compared to the other oceans of the world is the presence of sea ice and its variability. The sea ice greatly affects the surface heat and moisture exchanges between the ocean and the atmosphere due to its important insulating properties, thereby modulating the climate (Washington and Meehl 1996). Due to the high albedo of the sea ice and snow compared to
3
open water, sea ice also acts as a reflective barrier limiting the absorption of incoming solar energy within the Arctic climate system (Peixoto and Oort 1992). Since sea ice is sensitive to changes in the ocean and the atmosphere temperatures, it acts as a good proxy of the variability in the thermal state of the region. The Arctic sea ice not only affects the atmospheric boundary layer by modulating the energy exchanges, it also has an impact on the ocean near-surface stratification. Indeed, the sea ice formation and melt affect the ocean surface layer stratification by the release of brine and freshwater, respectively, modulating the water density in the ocean surface layer (Serreze and Barry 2005).
The ocean surface currents and sea ice motion are dependent on the near-surface winds and therefore the regional atmospheric circulation and its variability (Rigor et al. 2002). The atmospheric large-scale circulation in the Arctic is characterized by three centers of action: the Icelandic Low, the Aleutian Low and the Siberian High with its extension into the Arctic (Beaufort High). The variability in the intensity of these centers of actions has an important influence not only on the near-surface circulation, but also on the poleward transport of heat and moisture from the lower latitudes (Hurrell et al. 2003). Sea ice distribution in the Arctic Ocean is a iso a direct consequence of the near-surface winds, with ice convergence leading to thicker ice along the Canadian Arctic Archipelago (Bourke and Garret 1987) and important sea ice exports through Fram Strait (Kwok and Rothrock 1999; Dickson et al. 2000; Hilmer and Jung 2000; Dickson et al. 2007; Condron et al. 2009; Wang et al. 2009; Tsukernik et al. 2010). The sea leve! pressure patterns exhibit large inter-annual to inter-decadal variability. The dominant patterns of variability are commonly know as the North Atlantic Oscillation (NAO), the Arctic Oscillation (AO) or the Northern Annual Mode (NAM), depending on the region over which the empirical orthogonal function analysis (EOF) is performed. The EOF analyses are used to extract the dominant modes of variability of the sea-level pressure over the high latitudes. Although there are sorne limitations in the physical interpretation of such mathematically derived patterns (Tremblay 2001; Hurrell et al. 2003), the EOF analysis showed great capability in re la ting to physical mechanisms of the Arctic variability, through changes in the sea ice motion (Karcher et al. 2005) and the variability of the second EOF pattern, the dipole anomaly, strongly correlated with the sea ice exports through Fram Strait (Wang et al. 2009), surface temperature anomalies over land (Hurrell et al. 2003), summer cyclone activity in the Nordic Seas and in the Central Arctic (Serreze and Barrett 2008;
Simmonds et al. 2008), precipitation over the Arctic regwn (Peterson et al. 2006), the freshwater content of the Beaufort Gyre (Proshutinsky et al. 2009; Condron et al. 2009), the river discharge in the Arctic (Peterson et al. 2002) and the observed salinity of the Siberian shelves (Steele and Ermold 2004).
The northem portion of the continental masses of North America and Eurasia are characterized by low vegetation with a marked latitudinal gradient from the Boreal forest in the southem part of the Arctic land, towards tundra in the northemmost latitudes and along the Arctic coastal regions. The limited annual-mean solar radiation, cold temperatures and small amount of annual precipitation act as limiting factors for the growth of vegetation.
Due to the cold temperatures in the Arctic, permafrost - defined as ground that stays frozen for 24 consecutive months - covers approximately one quarter of ali the exposed land of the Northem Hemisphere (Zhang et al. 1999). The presence of permafrost affects significantly the hydrology by limiting the soi! infiltration capacity, thereby directly influencing the drainage system. Soi! temperatures, bence permafrost, are sensitive to changes in the near-surface air temperatures and snow cover and, as for sea ice, act as a good proxy to study the long-term changes in the climate.
Observed climate variability and climate change in the Arctic
This section briefly describes the climate variability and the observed climate change in the Arctic region. The limited availability of observations in time and space, especially before the satellite era, makes the analysis of such observational data a challenge, since the signais of inter-annual variability and climate change are combined in most of the available time series. Nevertheless, clear signs of accelerated changes were observed over the recent years and sorne of the important findings are brie fly summarized here.
The September Arctic sea ice cover has shown significant reduction trends with estimates of -12.9% per decade over the 1976-2006 period (Stroeve et al. 2012). Minimum historical September sea ice cover were observed in 2007, 2011 and 2012, showing an acceleration in the sea ice cover decline over the Arctic (Comiso et al. 2008; NSIDC). More importantly, sea ice thickness and volume have been rapidly decreasing over the past decades
5
(Kwok and Rothrock 2009; Kwok et al. 2009), as seen also in the marked decrease in thick perennial sea ice volume since the 2000s (Nghiem et al. 2007). The anomalous sea ice motion responsible for Fram Strait ice exports is primarily driven by sea-level pressure anomalies (Tsukemik et al. 201 0) illustrating the strong physical coup ling between the sea ice and the atmosphere. Although large-scale atmospheric anomalies and upward trend in the NAM index play a role in the sea ice cover reduction, they cannot account entirely for the recent trends (Deser and Teng 2008).
Different mechanisms are responsible for the decrease in sea ice for different regions of the northem hemisphere high latitudes. The changes in the sea ice edge location over the Barents Sea are related to an increase in the sea surface temperatures (SSTs) combined with enhanced southerly winds, while changes over the Bering Sea are mainly influenced by the anomalies in the easterly winds (Francis and Hunter 2007). Over the Pacifie Sector of the Arctic Ocean, detailed analysis of the September 2007 sea ice cover minimum showed enhanced heat transport through Bering Strait (Wood gate et al. 201 0) likely causing earl y melt along the Alaska coast and triggering a sea ice-albedo feedback. Reduced cloudiness over the region enhanced the ocean absorption of solar radiation in 2006-2007 (Kay et al. 2008), increasing the heat content of the ocean and energy used for bottom melting of the ice. These complex physical mechanisms and interactions are difficult to assess solely based on observations due to their limited availability, especially for ocean and sea ice. Nevertheless, Perovich et al. (2008), using ice mass balance buoy observations, showed large amounts of bottom me !ting of the sea ice in the Beaufort Sea in the summer of 2007, direct! y linked to the increased heat content of the ocean caused by enhanced absorption of solar radiation. Over the Central Arctic Ocean, sea ice cover reduction is responsible for a surface-based amplification of the lower tropospheric warming over the 1989-2008 period (Serreze et al. 2009; Screen and Simmonds 2010). This Arctic amplification due to sea ice retreat is another illustration of positive feedbacks enhancing the warming and further reducing the sea ice cover.
The combination of observational evidence on the recent sea ice cover and thickness suggests a growing non-linear response of sea ice cover and volume to extemal climate forcing (Fig. I.2). With the extensive open water observed in recent Septembers, the Arctic
Ocean shows increasing proportion of thin first-year ice in spring (Maslanik et al. 2007). The dynamical forcings acting on the ice by the winds, the ocean circulation and waves more effectively break the thinner first-year ice, leading to a more fragmented sea ice cover early in spring. This increased fraction of open water allows for more shortwave radiation to be absorbed at the ocean's surface, thus warming the upper ocean water, increasing the sea ice melt from at the ocean-ice interface during spring and summer. These interactions, supported by observational evidence, strongly suggest an increased contribution of the sea ice-albedo feedback in the recent years minimum observed in the sea ice cover and accelerated rate of decline (Lindsay and Zhang 2006; Perovich et al. 2007, 2008). Finally, as the Arctic climate bas been warming for ali seasons (Serreze et al. 2009), the likelihood of cold conditions is diminished. These warmer conditions decrease the possibility of temporary recovery of the sea ice cover and thickness through natural climate variability (Stroeve et al. 2012).
Over land, the permafrost temperatures have increased by up to 3
o
c
since the 1980s in the Arctic (Lemke et al. 2007). Large spatial variability of the warming is observed across the Arctic from maximal increases of 3oc
to 4o
c
in the coastal area of Alaska, to smaller increases between 0.3o
c
to 1o
c
in the Yukon River valley (Osterkamp 2007). Across the Arctic, permafrost temperatures generally increased with the exception of Northem Québec sites that showed cooling of the order of -0.05o
c
yf1 from the mid 1980s to early 1990s (Allard et al. 1995), in good agreement with surface temperature changes. Despite the cold annual temperatures in the Arctic, sorne regions, especially in Alaska, showed signs of permafrost degradation clearly visible from aerial photographs (Jorgenson et al. 2006). Observational studies demonstrated that permafrost temperatures are primarily sensitive to changes in the near-surface air temperature and in the length of the freeze and thaw seasons, while snow cover and duration play an important but secondary role (Zhang et al. 2007; Lemke et al. 2007; Frauenfeld and Zhang 2011).The impacts of near-surface permafrost degradation are manifold. The thawing of ice-rich permafrost - where large fraction of the soi! volume is occupied by ice - causes subsidence of the soi! surface, dramatically changing the landscape. The thawing of ice-rich permafrost can lead to the formation of thermokarst ponds, which bas impacts on the vegetation cover by flooding the roots and destroying the trees, transforming forested areas
7
into bogs (Hinzmann et al. 2005).
Permafrost degradation can also dramatically change the surface and sub-surface hydrology. lee-rich permafrost prevents the infiltration of surface waters, increasing the surface soil moisture. If the permafrost degrades, soil water can in sorne cases infiltrate and reach the groundwater network causing partial or complete drainage of lakes (Y oshikawa and Hinzmann 2003; Smith et al. 2005). Drying of lakes and ponds changes the redistribution of surface energy from latent to sensible heat fluxes and thus feedback on the near-surface atmospheric conditions.
Rivers can also be affected by the changes in a1r temperature, precipitation and permafrost degradation. Over the 1936-1999 period, Peterson et al. (2002) showed a 7% increase in the river discharge from the six largest rivers across the Arctic. The increased discharge was related to the changes in the NAO and to the global temperature increase, showing the interdependence and complexity of the Arctic climate system response to changes in the natural variability and the anthropogenic climate change. Inconsistencies between the changes in river discharge and in precipitation raised questions about the quality of the observed fields, especially for the Yenisey River where the increased discharge could not be explained by the observed decrease in precipitation (Berezovskaya et al. 2004). Such inconsistencies are difficult to ascertain solely based on observations due to the limited networks of precipitation gauges and the quasi-absence of reliable data on other hydrologie parameters such as the evaporation, available only at sorne few measured stations and subject to large uncertainties in mode! estimates. Moreover, important regional differences exist in river discharge trends across the Arctic, with upward trends over Siberia, while North American Rivers show downward trends in the Hudson Bay region (McClelland et al. 2006; Déry and Wood 2005; Déry et al. 2005; Déry et al. 2009). Changes in the river discharge are also sensitive to the accelerated glacier melt occuring in the high latitudes. As such, river basins with an important glacial component generally show positive trends in runoff while basins with smaller or no glaciers generally show decreasing trends (Hinzmann et al. 2005). Finally, changes in river discharge might also affect the Arctic Ocean by changing the freshwater fluxes and its spatial distribution into the surface layer of the ocean, thereby changing the water density, which is just another illustration of the potential feedbacks
between the different climate components (Peterson et al. 2006).
Soil biological processes are also sensitive to changes in the atmosphere and soil temperatures and to permafrost degradation. In the Arctic, cold temperatures inhibit the decomposition of dead vegetation, forming over time important peat deposits, reaching depths of over 30 rn in sorne cases (Tamocai et al. 2009). This accumulation results in the presence of large amounts of carbon sequestered in the Arctic soils, evaluated at -1672 Pg of carbon, with approximately 88% of that carbon located in perennially frozen soils and deposits (Tamocai et al. 2009). While frozen, this carbon is relatively inactive but represent one of the least understood but important potential carbon-climate feedbacks because of the magnitude of the carbon pool it represents (Schuur et al. 2008). Since most of the microbial activity occurs in the seasonally thawed active layer (Schuur et al. 2008), increases in temperatures and permafrost degradation will increase the decomposition of the soil organic carbon, released in carbon dioxide or methane form depending on the type of decomposition, i.e. aerobic or anaerobie. The carbon transfer from the soil carbon pool towards the atmosphere is dependent on many factors, with the changes in the soil temperatures playing a primary role (Schuur et al. 2008; O'Connor et al. 2010).
In summary, the Arctic Climate and its changes are composed of complex interactions and feedbacks between most of its components. Although the major interactions present between the atmosphere, ocean and land components are mostly addressed by the physics of climate, the understanding of local scale feedbacks requires a multidisciplinary approach involving hydrology, glaciology and biology.
The main challenge in the study of the Arctic climate and climate changes resides in the limited observational networks and the short time period for which these observations are available. Prior to the satellite era, the observational data was mostly available from few long-term stations dispersed in the Arctic region or through field campaigns such as the Arctic lee Dynamics Joint Experiment (AIDJEX) campaign in the 1970s and the Russian North Pole Drifting Station program. The combination of a sparse observational dataset and high variability makes it difficult to distinguish between the signais of climate variability and climate change with confidence (ACIA 2004).
9
In this context, the development of numerical models significantly aided comprehension of the key physical processes and mechanisms that determine the Arctic climate. An important advantage of the mode ling approach over direct observations is that it provides continuous data in space and time of physically coherent variables essential to study the evolution of various components of the climate system. Although numerical models were traditionally developed separately for various major climate components such as ocean and sea ice, atmosphere, land surface, more efforts are now being dedicated to the interactive coup ling of the se components to better understand the interlinkages and feedbacks.
Scientific objectives and thesis presentation
This thesis is composed of two main chapters, each representing a paper accepted or submitted for publication in a peer-reviewed journal. The first chapter, entitled "Causes and consequences of mid-21 st Century Rapid Ice Loss Events simulated by the Rossby Centre Regional Atmosphere-Ocean model" published in Tellus A, is an analysis of the factors and mechanisms responsible for the Rapid Ice Loss Events (RILEs) as simulated in three climate projections of the regional model from the Swedish Meteorological and Hydrological Institute (SMHI). The second chapter, entitled "On the simulated Arctic near-surface permafrost and climate sensitivity to soil and snow formulations" focuses on the evaluation of the near-surface permafrost and its sensitivity to the representation of soil organic carbon, soil column depth and snow thermal conductivity using a physically based land surface scheme and a regional climate model- the fifth-generation of the Canadian Regional Climate Model (CRCM5). These studies are part of a larger effort at the Centre ESCER (Étude et Simulation du Climat à l'Échelle Régionale) at Université du Québec à Montréal (UQAM) to develop a fully coupled regional climate mode! that will include, in the future, ali physical components of the Arctic Climate system. Work is underway by colleagues at ESCER to develop and implement a lake-river system, dynamic glacier mode! and to achieve an coup led atmosphere-ocean system. A brief introduction and motivation for each of the chapters is presented below.
As presented earlier, Rapid Ice Loss Events (RILEs) were observed in 2007, 2010 and 2012, mainly occurring over the Pacifie Sector of the Arctic Ocean. The AOGCMs
participating m the World Climate Research Programme (WCRP) Coupled Mode! Intercomparison Project Phases 3 and 5 (CMIP3, CMIP5) underestimate the observed decreasing trends in sea ice co ver (Stroeve et al 2007, 2012). Although improvements in the representation of the sea ice cover were achieved in CMIP5, the models do not appear to agree on when the Arctic Ocean might become seasonally ice-free (Stroeve et al. 2012). In sorne models, the simulated transition from perennial sea ice cover to nearly ice-free summers occurs in an abrupt and short transition period. During these transition periods, the simulated decreasing trends in summer sea ice cover are similar to the observed trends over the past decade. Amongst the CMIP models, only few models show such RILEs, but usually around the middle of the 21 st Century (i.e. Rolland et al. 2006), while trends over the recent decade are generally underestimated. Understanding the physical mechanisms leading to such RILEs could improve our understanding of the sea ice decline of the last decade and is necessary for climate mode! improvements. In the context of future climate projections, the state of the Arctic Ocean sea ice cover will play a major role in defining the climate change of the region, and it is essential to understand its interconnections to the global climate in order to reduce the uncertainties associated with future projections.
In that context, the Rossby Centre Atmosphere-Ocean (RCAO) regional climate mode! is one of the few models to simulate such RILEs. Three climate projections were performed over the 1960-2080 period driven at the atmospheric lateral boundary conditions (LBC) by the same realization of the Max Planck Institute's AOGCM ECHAM5-MPIIOM. Results showed sea ice loss events occurring around 2040 in each projection, although no RILEs were present in the ECHAM5-MPI/OM projection. The common LBCs and the noted synchronicity between the events in each projection allowed an in-depth study of the physical mechanisms causing the events, as weil as the role played by the extemal forcing imposed at the LBCs of the RCM.
The rapid decrease of sea ice cover could also have important potential impacts on other parts of the Arctic climate system. Sea ice thinning and melt could enhance the beat transfer from the ocean towards the atmosphere especially in autumn due to a later freeze-up at the ocean's surface. This increased beat and moisture in the atmosphere could potentially be advected over land, therefore increasing the energy transfers between atmosphere and
11
land. Lawrence et al. (2008) noted that the CRUTEM3 temperature data (Jones et al. 2006) in autumn of 2007 was the warmest over the previous 30 years with a significant increase of 2.3
o
c
over Western Arctic. Using the Community Climate System Model (CCSM3; Meehl et al. 2006), Lawrence et al. (2008) also noted that the simulated warming trend over land, in consequence to RILEs, was 3.5 times larger in transient climate change projections compared to periods outside of rapid ice Joss. This warming signal propagated approximately 1 ,500 km inland, influencing the permafrost on a pan-Arctic scale. Complementary experiments using the Community Land Mode! (Oleson et al. 2008) showed acceleration of soi! heat accumulation during RILEs, directly influencing the warm permafrost areas and hastening the permafrost degradation.Due to sorne limitations rn RCAO representation of near-surface atmospheric variables, especially over land (see section 1.4.3.3) and its shallow 2.2 rn deep land surface scheme (Samuelsson et al. 2006), it was decided to investigate the simulation of near-surface permafrost using the fifth version of the Canadian Regional Climate Mode! (CRCM5) coupled to the Canadian LAnd Surface Scheme (CLASS). CLASS provided important advantages to study permafrost as its formulation includes a flexible soi! column depth capability, crucial to represent high latitude soi! processes. Although the CRCM5 isn't coupled with an ocean mode!, it is planned to include such capability in the near future, therefore motivating this study. Moreover, the first simulation results using the CRCM5 undeniably showed the necessity to improve high latitude soi! representation due to an underestimation of simulated near-surface permafrost using CLASS standard configuration.
The objective of the second paper is therefore to assess sensitivity of the near-surface permafrost and surface climate to soil and snow formulation. Mineral soils are generally not representative of the land coverage in the Arctic where organically rich soils are present over large areas. The soi! organic carbon (SOC) has very different thermal and hydraulic properties compared to mineral soils and must be taken into account in any land surface model (LSM) to get realistic representation of the annual cycle of soi! temperatures. The SOC greatly modifies the thermal and hydraulic properties of the soi! column due to its high porosity, low thermal conductivity and relatively high heat content (Beringer et al. 2000; Letts et al. 2000). Recent studies (Nicolsky et al. 2007; Lawrence and Slater 2008; Rinke et
al. 2008; Dankers et al. 2011) demonstrated the need to include SOC in LSMs for improved simulations of soi! thermal and moisture regimes, hence near-surface permafrost.
The presence of SOC can have significant impact on the surface energy balance by increasing the energy flux towards the atmosphere, caused by lower thermal conductivity and by impacting the partitioning of this energy into latent and sensible heat fluxes. Very few studies have addressed the impact of SOC on the coup led land-atmosphere system. Lawrence et al. (2008) and Rinke et al. (2008) obtained opposite impacts of SOC in their respective coupled land-atmosphere models. Results of Lawrence et al. (2008) show large increases in the sensible heat flux, leading to increased near-surface air temperatures, a deepening of the atmospheric boundary layer and a decrease in low-level clouds. Rinke et al. (2008) obtained increased latent heat flux, decreased air temperatures and increased low-level clouds. These contradictory results raised important questions on the sensitivity of the surface climate to the implementation of SOC.
Permafrost warming (and degradation) has been observed in multiple regions across the Arctic. The use of numerical modeling to assess the Pan-Arctic permafrost changes is important, given the limited number of observations. Although sorne studies are available on such scales, most of them were performed using either LSMs driven by observational datasets, reanalysis products or atmospheric fields from general circulation models (GCM), neglecting the potential feedbacks arising from the land-atmosphere interactions. The objectives of the second chapter of this thesis are twofold. The first objective is to assess the sensitivity of the simulated Pan-Arctic soil temperature and moisture regimes to the LSM column depth, to the implementation of SOC parameterization and modified snow conductivity. This first objective is performed using the Canadian Land Surface Scheme (CLASS) driven by reanalysis, therefore in stand-alone mode, neglecting the land-atmosphere interactions and feedbacks.
The second objective is to study the impact of the improvements to CLASS within the coupled framework using the fifth-generation Canadian Regional Climate Mode! (CRCM5) on the simulated near-surface permafrost, surface climate and land-atmosphere interactions. Analysis of the changes in the surface energy partitioning due to the implementation of the SOC parameterization contributes to reducing the uncertainties noted in previous studies by
13
Lawrence et al. (2008) and Rinke et al. (2008). Lastly, evaluation of the CRCM5 ability to reproduce the observed warming trend over the Arctic and its relation to the permafrost temperature and active layer thickness is a crucial step prior to considering any climate projections.
\
\
-50((\-~ (o)) -2 (((\-100) -500 -1CO so 100 <1:Q ~l 50) 10)) 1.;1)0 20ll 9 C>JO 41lll m
Figure L 1: Topography and bathymetry of the Arctic based on the ETOPOS data set, NOAA 1988 (AMAP 1998).
More open water in September
Warmer air temperatures in ali seasons (GHG forcing}
Enhanced lee-albedo feedback
Warmer autumn temperatures
Earlier development
of open water
Thlnner spring lee
Figure !.2: Illustration of mutually supporting processes favoring acceleration of the September sea ice trend (Stroeve et al. 2012).
CHAPTERI
CAUSES AND CONSEQUENCES OF MID-21
51CENTURY RAPID ICE LOSS
EVENTS SIMULATED BY THE ROSSBY CENTRE REGIONAL
ATMOSPHERE-OCEAN MODEL
This work is published in the peer-reviewed journal Tellus A.
The
detailed
reference
lS:Paquin, J.-P
.,
R.
Doscher,
L. Sushama, T.Koenigk. 2013
. "Causes
and consequences
ofmid-21
51Century Rapid lee Loss Events simulated by the Rossby Centre Regional
Atmosphere-Ocean Model".
Tellus A, 65,
http:
//
dx.doi.org/1 0.3402
/
tellusa
.v
65i0.19110
AbstractRecent observations and modeling studies suggest that the Arctic climate is undergoing
important transition. One manifestation of this change is seen in the rapid sea ice cover
decrease as experienced in 2007 and 2012. Although most numerical climate models cannat
adequately reproduce the recent changes, sorne models produce similar rapid ice Joss events
(RILEs) during the mid-21 st Century. This study presents an analysis of four specifie RILEs
clustered around 2040 in three transient climate projections performed with the coupled
Rossby Centre regional Atmosphere-Ocean mode! (RCAO). Analysis shows that long-term
thinning causes increased vulnerability of the Arctic Ocean sea ice cover. In the Atlantic
sector, preconditioning (thinning of sea ice) combined with anomalous atmospheric and oceanic beat transport cause large ice Joss, wh ile in the Pacifie sector of the Arctic Ocean sea ice-albedo feedback appears important, particularly along the retreating sea ice margin. Although maximum sea ice Joss occurs in fall, response in surface air temperature occurs in
early winter, caused by strong increase in ocean-atmosphere surface energy fluxes, mainly the turbulent fluxes. Synchronicity of the events around 2040 in the projections is caused by a strong large-scale atmospheric circulation anomaly at the Atlantic lateral boundary of the regional mode!. The limited impact on land is caused by vertical propagation of the surface beat anomaly rather than horizontal, caused by the absence of low-level temperature inversion over the ocean.
-l.llntroduction
Climate change, induced by increased anthropogenic emissions of greenhouse gases, is
one of the greatest environmental issues today. These changes are being experienced
particularly intensely in the Arctic, where the temperatures have risen at almost twice the rate
of the rest of the world in the past few decades (ACIA 2005). The climate change projections
realized with coup led general circulation models for the 2151
Century for the region suggest further warming. It should be noted though that the uncertainties in the projections for the
Arctic are larger compared to those for lower latitudes, as shawn by the large spread amongst
models that participated in the third World Climate Research Program's (WRCP) Coupled
Madel Intercomparison Project (CMIP3). Understanding the changes in the Arctic climate is
crucial not only for regional environmental and social issues, but also for global climate due
to interconnections between the Arctic and global climates.
The Arctic sea ice cover and its thickness, due to the relation to atmospheric and oceanic temperatures, is a sensitive indicator of climate change in the region. According to Stroeve et al. (2007), the September Arctic sea ice extent has decreased during the 1979-2006 period at
rates of 9.1% per decade. The recent years, however, showed accelerated summer sea ice loss
with 2007, 2011 and 2012 showing historical minimum values in the satellite observation era (Comiso et al. 2008; NSIDC). Nghiem et al. (2007) using observations and a drift-age madel suggested large acceleration in the rate of decrease of thick perennial (multi-year) ice
reaching unprecedented values of 23% between March 2005 and March 2007. The transition
from thicker perennial ice towards thinner first-year ice over the 2006-2007 period made the
ice more vulnerable, leading to the summer historical minimum values of 2007 (Nghiem et
al. 2007).
In addition, a number of other mechanisms also contributed to this rapid observed decrease in sea ice extent. The large-scale atmospheric circulation played an important role; for example, Deser and Teng (2008) and Wang et al. (2009) showed that trends in sea ice caver over the marginal ice zones can be linked to the Northem Annular Mode (NAM) through the surface wind anomalies. This circulation anomaly strengthened the transpolar-drift, with anomalous
meridional wind blowing from the western to the eastern Arctic, th us enhancing export of sea
19
increased inclusion of perennial (thick multi-year) ice in the transpolar drift, leading to massive ice volume exports through Fram Strait during the 2006-2007 period. However, the analysis by Deser and Teng (2008) concluded that the circulation anomalies couldn't explain the overall summer and winter trends in the sea ice cover.
Kay et al. (2008) studied cloud cover and its potentiallinks to the rapid decrease in sea ice during the 2006-2007 period. They report a 16% decrease in summertime cloudiness over the Western Arctic from satellite and ground-based data in 2006 and 2007, which leads to an increase in downwelling shortwave radiation of32W/m2, while little changes in downwelling
longwave radiation ( -4 W 1m2) were observed. Analysis of the changes in clouds and radiation over the summer melt season showed the potential to increase surface melting by 0.3 rn or a 2.4 K warming of the sea surface temperature, energy potentially used for bottom melting of the ice. Although this anomal y of reduced cloudiness is not unprecedented in records, Kay et al. (2008) suggests that the presence of thinner sea ice over the region made the system more vulnerable. This suggests that, in the future, anomalies in cloud cover and radiative fluxes might play an increasingly important role in regulating summer sea ice extent. Observations of the ice mass balance over the Beaufort Sea confirmed a large increase in the bottom mel ting of the ice, main! y in 2007, caused by warmer ocean temperatures due to enhanced shortwave absorption, triggering an ice-albedo feedback and accelerated the sea ice melt (Perovich et al., 2008).
Investigation of the Arctic climate using coup led general circulation models showed that none of the models contributing to CMIP3 were able to reproduce the observed acceleration of the Arctic sea ice Joss. Stroeve et al. (2007) clearly showed that CMIP3 coupled general circulation models underestimate the sensitivity of the Arctic sea ice to extemal forcing caused by the increase in greenhouse gas concentration. Analysis performed with the Community Climate System Mode! version 3 (CCSM3; Collins et al., 2006) showed rapid decreasing trends, suggesting nearly ice-free conditions by approximately 2050 (Holland et al., 2006, hereafter H06), while other models in the CMIP3 ensemble do not reach such state by 2100 (Stroeve et al., 2007). These results highlight the existing uncertainties in the simulation of the Arctic climate and the need for further investigation.