0886-7798/04/$ - see front matter䊚 2003 Elsevier Ltd. All rights reserved. doi:10.1016/S0886-7798(03)00106-8
Use of multi-criteria decision-aids for risk zoning and management of
large area subjected to mining-induced hazards
M.M. Merad , T. Verdel *, B. Roy , S. Kouniali
a b, a cLAMSADE, University of Paris IX-Dauphine, Paris, Cedex F-75775, France
a
LAEGO, Ecole des Mines-Nancy, Parc de Saurupt, Nancy, Cedex F-54042, France
b
INERIS, BP2, Verneuil-en-Halatte F-60550, France
c
Received 26 April 2003; received in revised form 19 July 2003; accepted 29 August 2003
Abstract
The end of iron-mining operations in France’s Lorraine region has raised the problem of post-mining management. Collapses and subsidence have recently occurred in this region, which focused on the necessity to develop a specific methodology for risk zoning. The proposed methodology is based on the multi-criteria decision-aid approach called ‘ELECTRE TRI’, with aim to assign zones at risk into predefined classes. It allows experts opinions, qualitative and quantitative criteria and uncertainties to be taken into account.
䊚 2003 Elsevier Ltd. All rights reserved.
Keywords: Risk; Public safety; Subsidence; Uncertainty; Multi-criteria
1. Introduction
Mine subsidence events have recently occurred in the Lorraine iron-mining basin(North-eastern France) caus-ing major damages to surface buildcaus-ings and infrastruc-tures (Deck et al., 2003). These events have raised widespread awareness of the severity of human, techni-cal, financial and legal risks due to the end of mining activities. The Lorraine iron-mining basin, which covers a surface area of 1150 km , had been mined for more2 than a century (Varoquaux, 1995) up until 1997 by reliance upon the ‘room and pillar’ caving method under urban areas in order to prevent the ground from subsi-dence. This‘technical’ prevention strategy, however, has failed several times throughout history and, consequent-ly, it has now become necessary to establish a ‘mana-gerial’ prevention strategy based on risk analysis. According to natural hazard theory, risk appears wher-ever and whenwher-ever assets are subjected to hazards; it is usually defined as ‘the expected potential loss due to a particular hazard for a given area and reference period’ (UN, 1992) and can be mathematically defined asthe combination of hazard and vulnerability (UN, 1992;
*Corresponding author.
E-mail address: [email protected](T. Verdel).
Varnes, 1984). In France, Risk Prevention Plans (RPPs) have been adopted to control risks due to ground movement (MATE, 1999). Such plans consist of pro-ducing four principal outputs: an informative report about the natural phenomena; a hazard map (givesthe contoursof the area subjected to given levelsof haz-ards); an assets evaluation (whether formalized or not on a map); and a risk map (superimposition of hazard and assets maps). In practice, RPPsare commonly prepared using the ‘typical configurations’ method (Didier, 1999), which entailsidentifying within the study area a limited number of rupture scenarios, called ‘configurations’. A hazard level is then ascribed to each configuration. Afterwards, homogeneouszonesare established according to these configurations in order to produce a hazard map. Despite the advantages associated with the ‘typical configurations’ method, which serves to formalize expert approach, some imperfections still remain. Firstly, when thismethod isplaced into practice, it only providesa hazard map, not a risk map. Secondly, the hazard map established is extremely dependent upon the knowledge and experience held by the engineer in charge. Thirdly, the method hasbeen developed for low extended area(quarries) rather than large extended area (mining basin). Lastly, uncertainties, inaccuracies and
Fig. 1. Risk induced by the presence of a mine and assets on the ground surface.
Fig. 2. Surface impactsdue to mining collapse.
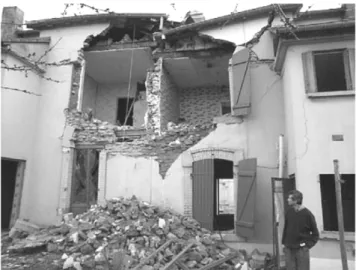
Fig. 3. Example of a house damaged by mining subsidence(Auboue,´ France, 1996).
incomplete knowledge are not explicitly identified nor taken into account. In order to overcome these shortcom-ings, we are proposing herein another method, based on a multi-criteria decision-aid approach, for prioritising zonesat risk.
2. Multi-criteria, decision-aid methods for risk analysis
The zones at risk studied lie in urbanized areas within France’sLorraine region, which had been mined using the ‘rooms and pillars’ method. These zones span a land area of over 20 km . The ‘roomsand pillars’ method2 consists of extracting ore in the rooms and then leaving pillarsto support the weight of the overlying ground (see Fig. 1).
Mining works, however, can present a danger to people and buildingswhen pillarsfail to withstand ground loads. Such a rupture can induce a gradual settlement of the surface, called subsidence (Fig. 2a),
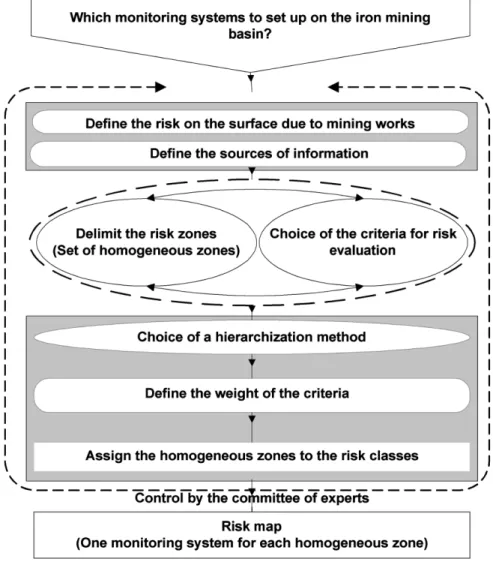
Fig. 4. General principle underlying the chosen risk analysis method. or a more brutal settlement called collapse (Fig. 2b),
which consists in an instantaneous drop of the entire overlying ground(Whittaker and Reddish, 1989). These phenomena may, in certain instances, produce dramatic consequences (ruin) on surface buildings (Fig. 3) and infrastructures.
Within such a context, risk analysis proves to be a complex decision-making problem where the available information isuncertain (missing information, such as geological data) and imprecise (mining worksmaps) and where knowledge isincomplete(e.g. soil–structure interaction). Multi-criteria, decision-aid methods can help overcome these limitations because they basically include mathematical mechanisms to manage these aspects. One such method called ELECTRE(Roy, 1985; Roy and Bouyssou, 1993) iswidely used in France and Europe for resolving decision-type problems involving institutions and experts(Roy and Bouyssou, 1993). We would like to emphasize the feasibility, advantages and difficultiesencountered when adapting the ELECTRE method to the prioritisation of zones subjected to mining subsidence or collapse. The application of the proposed
methodology requires the assistance of a committee of experts to handle complexity issues. The general prin-ciple underlying thismethodology hasbeen depicted in Fig. 4.
The committee of expertscalled upon for the present purposes has defined four risk classes, given that an appropriate monitoring device must be set up for the identified zonesasa function of estimated risk level. By convention, Class 1 corresponds to the highest risk level and Class 4 to the lowest. A permanent monitoring system must be introduced for all Class 1 zones, while only reference levelling (topographic surveys) is required for Class 4 zones (see Table 1). The aim of thismethod isto identify and categorize homogeneous zones into these four predefined risk classes.
The first step consists in selecting the studied risk (collapse or subsidence) among those available (col-lapse, subsidence, pollution, sinkholes, slope instabili-ties, etc.). Thischoice will then influence the second step, which entails choosing the criteria applied to provide information on the risk and, similarly, to identify homogeneouszonesover the study area; homogeneous
Table 1
Monitoring measures for the four risk classes
Risk classes Monitoring measures
1 Long term continuousmonitoring based on the recording of underground
microsismic activity.
2 In depth investigation including geological boring if necessary.
3 Reference and annual levelling.
4 Reference levelling.
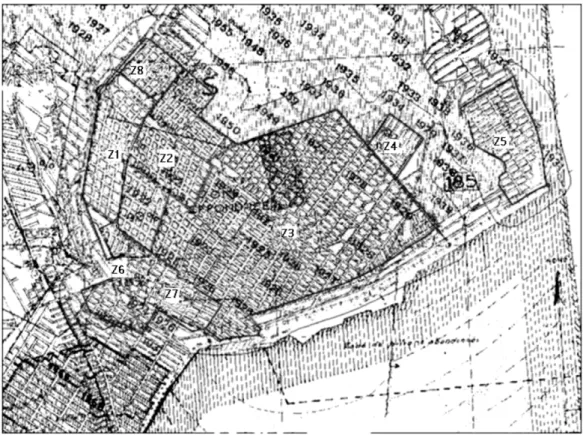
Fig. 5. Mining worksmap divided into homogeneouszones(Z to Z ).1 8 zones are those whose intrinsic characteristics (i.e.
valuesof the selected criteria) are identical (see Figs. 5 and 6). The last step consists of choosing a prioritisation method for analysing these homogeneous zones, i.e. moving from a partial evaluation of the zone on each criterion to a global evaluation of the entire zone(level of risk) (Fig. 7) based on all criteria.
In the following sections, we will examine in greater detail how risk zones are selected, how a set (family) of criteria and sets of weights are defined, and how the ‘ELECTRE TRI’ method isintegrated for prioritising zonesat risk.
3. Selection of zones at risk and choice of evaluation criteria and weighting sets
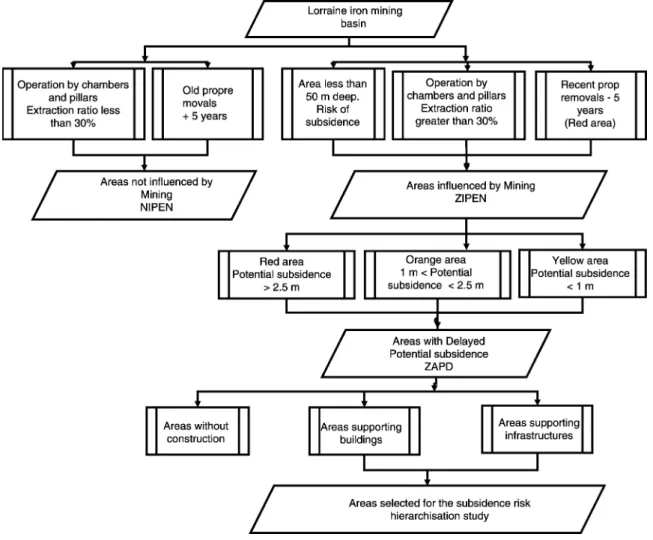
The procedure used to select zones at risk is illustrated
in Fig. 8. In addition to thisschematic approach, the zones must satisfy two selection tests defined by the committee of experts: (1) the stress applied on pillars must be greater than or equal to 7.5 MPa (no pillar rupture isexpected below thisvalue); (2) zone width must exceed 0.9=H, where H represents depth from the
operating wall (no significant effects on surface below thisvalue). If these conditions are not fulfilled, it is considered that the selected zone presents no danger and monitoring is not necessary in such cases. The same conclusions are valid for zones with no surface assets.
Let Z be the set of zones at risk and Z be a zonei
such that Z gZ, withi is1, «, m, where m represents
the number of zones.
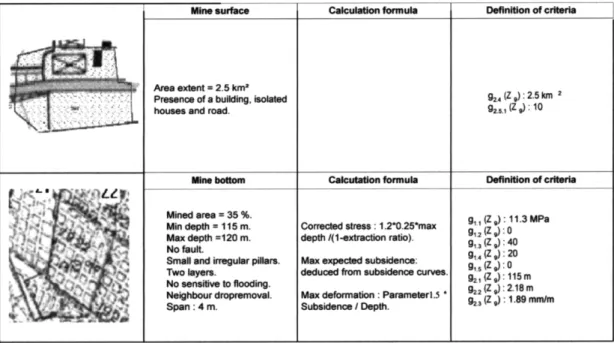
The data available for each zone can be either quantitative(stress applied to pillars, depth, zone extent, etc.) or qualitative (presence of faults, superposition of
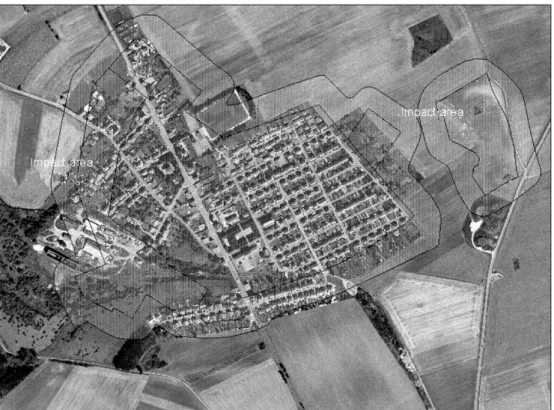
Fig. 6. Aerial photograph of assets above mining works shown on Fig. 5, with the contours of zones Z to Z .1 8
Fig. 7. Results of the risk analysis by zone. pillars, sensitivity to flooding, etc.). The risk due to
mining subsidence is therefore represented in a multi-criteria form. Due to the extent of the basin studied and
the objectivesinherent in risk mapping, relevant data are synthesized through a family of criteria that may be defined on each zone selected for the prioritisation study.
Fig. 8. Identification and selection of zones for prioritisation. These criteria are implemented in conjunction with and
under the supervision of a committee of experts. These criteria taken as a whole form a consistent family(Roy, 1985), meaning that:
– Two zones with identical criteria values are assigned to the same risk class: the criteria family is said to beexhaustive;
– A zone on which the value on one criterion isreduced (in terms of decreasing risk) cannot be assigned to a lower class (higher risk) than that initially assigned: the criteria family issaid to beconsistent;
– A zone cannot be assigned to a class when one criterion isremoved from the criteria family: the criteria family issaid to benon-redundant.
The variouscriteria used have been grouped into two headings: ‘susceptibility of the mine to collapse’ and ‘surface sensitivity’(see Table 1). The first refers to the ‘probability of rupture’ and the second to both the ‘intensity of the rupture’ and the ‘value and vulnerability of assets’.
Let g be a criterion within the family of criteria,j
where js1,«n and n isthe number of criteria. A
qualitative or quantitative scale is then defined for each criterion g . The quantitative criteria g , g , g , gj 1.1 2.1 2.2 2.3 andg2.4(Table 2) are evaluated in their own units. For example,g , which denotes the stress applied on pillars,1.1 isgiven in MPa andg , representing depth, in m. The2.2 remaining criteria are qualitative and expressed in vari-ous appropriate scales. The ‘superimposition of pillars’ criterion can take the following status: (0) a mined layer;(10) two layers with well superimposed pillars or a thick intermediate layer(G7 m); (20) two layerswith poorly-superimposed pillars or a thin intermediate layer (-7 m). Thiscodification (0, 10, 20) doesnot connote any numerical significance(Roy, 1985) and other coding systems, such as (6, 7, 8), could also be used.
Two types of surface assets are considered for each zone Z : buildings and infrastructures. This distinctioni
makes it necessary to apply different criteria to evaluate the risk for Z according to surface occupancy. If Z isi i
Table 2
Family of criteria
No. Criterion Nature Unit Codes Direction of
risk increase G1. Susceptibility of the mine to collapse
g1.1 Corrected mean stress Quanti. MPa
0.25=H k=
1yt q
applied on pillars
g1.2 Existence of fault Quali. (code) 0: no; 10: yes. q
g1.3 Superimposition of pillars Quali. (code) 0: only one mined layer; q 10: two well superimposed layers
or thick intermediate layer(G7 m);
40: two bad superimposed layers or thin intermediate layer(-7 m).
g1.4 Size and regularity of Quali. (code) 0: large pillars; q
pillars 10: small regular pillars;
20: small irregular pillars.
g1.5 Sensitivity of rock to Quali. (code) 0: no sensitivity; q
flooding(depending on the 10: sensitive;
rock type) 20: very sensitive;
30: highly sensitive. G2. Surface sensitivity
g2.1 Depth of the top mined layer Quanti. m Given on maps. Called H. y
g2.2 Maximum expected Quanti. m Deduced from subsidence models. q
subsidence CalledA .m
g2.3 Expected surface Quanti. mmym
Am ´maxs1.5=
H q
deformation(deduced from
subsidence models)
g2.4 Zone extent Quanti. km2 Given on maps. q
g2.5.1 Vulnerability of building Quali. (code) 5: commercial zones; q 10: isolated houses;
20: grouped houses; 30: long buildings; 40: urban area.
g2.5.2 Vulnerability of roadsQuali. (code) 0: no road; q
10: local road; 20: national road; 30: highway.
g2.5.3 Vulnerability of railwaysQuali. (code) 0: no line; q
10: standard line; 20: speed line; 30: high speed line.
g2.5.4 Vulnerability of bridgesQuali. (code) 0: no bridge; q
10: presence of bridge.
g2.5.5 Vulnerability of variousQuali. (code) 0: no network; q
networks10: electricity network; 20: water network; 30: gasnetwork.
g1.1 to g1.5 and g2.1 to g2.5.1; if, however, Z isa zonei
with infrastructures, the criteria would be g1.1 to g ,1.5
g2.1 to g2.4 and g2.5.2 to g2.5.5. Table 3 givesa detailed example of the evaluation of a zone with buildings.
Note that due to the ultimate ‘Public safety’ purpose of this risk analysis, buildings have been considered more sensitive than infrastructures. If both buildings and infrastructures are present on a given surface zone Z ,i
then the criteria for zoneswith buildingsare to be employed.
4. From partial to global risk evaluation
4.1. Choice of a method for prioritising zones at risk
Several multi-criteria, decision-aid methods can be used to progress from a partial evaluation of the risk on
Fig. 9. Four risk classes separated by three low profiles Pr .h Fig. 10. Principal position of class profiles Pr on each criterionh g .j
each criteriong to a global risk evaluation based on alli
criteria (Roy, 1985; Roy and Bouyssou, 1993). One of the most frequently used methods is the ‘weighted mean
method’, which providesa complete order and enables differentiating the weight of criteria. It is possible, for example, to ascribe a particular criteriong with a greaterj
weight, hence a greater role in determining the class assignment. This method, however, imposes certain strict constraints, such as the numerical evaluation on each criterion g and leads to compensation effects sincej
equal evaluation differences correspond to equal risk variation measurements (Roy, 1985). Furthermore, the weighted mean method doesnot easily accommodate uncertainties and inaccuracies. These elements make ‘ELECTRE’-type methodsand ‘ELECTRE TRI’ in par-ticular, applicable. ELECTRE TRI isappropriated to sort zones Z into four predefined, mutually exclusivei
Fig. 11. Three comparison set-ups between Z and Pr .i h
Table 4
Weighting sets selected by the experts committee, for the prioritisation of zones at risk under buildings and under infrastructures
Criterion g1.1 g1.2 g1.3 g1.4 g1.5 g2.1 g2.2 g2.3 g2.4 g2.5.1 g2.5.2 g2.5.3 g2.5.4 g2.5.5
Weightsfor zones 5 1 1 1 5 1 1 20 1 10 – – – –
with buildings
Weightsfor zones 5 1 1 1 5 1 1 20 4 – 4 4 4 2
with infrastructures
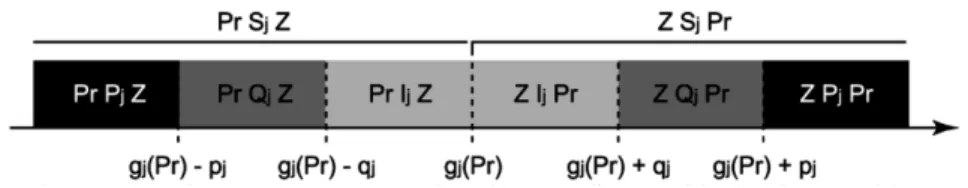
Each risk class h (hg{1,2,3,4}) isdelimited by a threshold profile Prh (see Fig. 9). A class profile Pr ish
a virtual zone representing an entry standard into a risk class. Each profile Pr takes a value on each criterionh
gj (Fig. 10). Since Class 1 is the highest risk class, profile Pr ‘displays a risk at least as high as’ Pr for1 2 every criterion. Thisiswritten Pr S Pr . In turn, Pr1 2 2 ‘displays a risk at least as high as’ Pr for every criterion3 (Pr S Pr ).2 3
For each criteriong it is possible to compare a zonej
Z with a profile Pr . Thisiscalled a partial comparison.i h
It is thus partially possible to determine if zone Z liesi within risk class h. In this comparison process,
uncer-tainty on criteria valuescan be taken into account(with ELECTRE TRI) through two thresholds: the indifference thresholdq and the preference threshold pj j(see Appen-dix A and Fig. 11).
In order to assign zones to risk classes (to go from a partial assignment to a global assignment), we have chosen the ‘ELECTRE TRI’ pseudo-disjunctive proce-dure(see Appendix A). Thisprocedure isbased on the calculation of a credibility index s and itscomparison with a parameter l. Intuitively, l represents a desired majority of decision-making criteria(Roy and Bouyssou, 1993). There are only three possible situations (Yu, 1992):
1. Indifference: s(Z ,Pr )Gi h l and s(Pr ,Z )Gh i l, which isdenoted Z I Pri h(with Z and Pr being equivalent);i h
2. Strict preference(risk strictly higher than):
2.1.s(Z ,Pr )Gi h l and s(Pr ,Z )-h i l, which isdenoted Z P Pri h (Z exhibitsgreater risk than Pr );i h
2.2.s(Pr ,Z )Gh i l and s(Z ,Pr )-i h l, which isdenoted Pr P Zh i(Pr exhibitsgreater risk than Z );h i
3. Incomparability: s(Z ,Pr )-i h l and s(Pr ,Z )-h i l, which isdenoted Z R Pr , meaning that Z and Pri h i h
are incomparable.
In cases where Z P Pr or Z I Pr , Z is assigned toi h i h i
the class with Pr representing the lower profile of theh
class h. The use of the pseudo-disjunctive procedure
within the ELECTRE TRI method impliesthat when comparison between a zone and a profile proves impos-sible (due to incomparability), the zone also gets assigned to the class where Pr is the lower profile.h
For each zone, the assignment procedure starts by a comparison with the lower profile (Pr ) and endswhen3 a profile isstrictly preferred to the zone (Pr P Z ), inh i
which case Z is assigned to classi hq1.
4.2. Choice of weighting sets for the criteria family
The choice of criteria-specific weightings requires the input of expert opinion. Two methodswere used to determine such weighting sets. The first consists of holding a meeting of the expert committee and discuss-ing the criteria until a consensus is reached regarddiscuss-ing the weight of each criterion. The second, known as the ‘cardsmethod’ (Arondel and Girardin, 2000; Roy and Figuera, 2002), iswell-adapted to ELECTRE-type meth-ods and facilitates communication and discussion between experts. The operating approach consists of associating a card with each criterion. Experts are then individually asked to: sort the criteria from the least important to the most important, with the possibility of placing criteria at the same rank; insert blank cards to indicate the relative importance among criteria from one rank to the next; and specify the ratio of the highest weight to the least weight assigned the criteria. This revised Simos method (Roy and Figuera, 2002) has many advantages, namely preventing criteria from being eliminated by a zero-weight assignment and incorporat-ing the variousweightincorporat-ingsascribed by participantsasa function of their interests and skills. This method was used to obtain one weighting set for zones with buildings and another set for zones with infrastructures(see Table 4). The weight of criterion j isdenoted k .j
Table 5
Evaluationsof zoneson each criterion Zone Criterion g1.1 g1.2 g1.3 g1.4 g1.5 g2.1 g2.2 g2.3 g2.4 g2.5.1 Z1 5.8 10 0 20 0 35 2.37 6.8 3.6 20 Z2 4.8 0 40 0 0 70 1.28 1.83 0.2 10 Z3 9.7 10 10 0 30 200 1.67 0.84 7.4 30 Z4 10.4 10 10 10 30 203 1.68 0.83 9.0 20 Z5 9.7 0 10 0 10 222 1.2 0.54 1.8 20 Z6 9.8 10 0 20 0 50 1.27 2.54 6.7 20 Z7 12.3 0 0 0 30 155 0.96 0.61 14.1 10 Z8 11.2 10 0 0 30 180 0.71 0.39 6.4 20 Z9 11.3 0 40 20 0 115 2.18 1.89 2.5 10 Z10 11.0 10 0 10 30 170 0.31 0.18 2.6 20 Profile Pr1 14 10 40 20 20 110 1.8 1 35 30 Pr2 10 10 10 10 10 150 1.4 0.82 20 20 Pr3 8 0 10 10 10 190 1 0.63 6 20 Threshold Q 0.05 0 0 0 0 10 0.1 0.05 0.5 0 P 0.1 0 0 0 0 20 0.2 0.09 1 0 Weights5 1 1 1 5 1 1 20 1 10 Table 6
Credibility indices s(Z , Pr ) and s(Pr , Z ) for the ten study zonesi h h i Pr3 Pr2 Pr1 Assignment of zones s(Z , Pr )i h to risk classes s(Pr , Z )h i ls0.65 Z1 0.717 0.717 0.500 Class 1 0.500 0.522 0.544 Z2 0.500 0.478 0.478 Class 1 0.522 0.522 0.544 Z3 0.956 0.913 0.348 Class 2 0.087 0.674 0.891 Z4 0.972 0.935 0.130 Class 2 0.283 0.891 0.891 Z5 0.565 0.456 0.000 Class 4 0.891 1.000 1.000 Z6 0.848 0.826 0.500 Class 1 0.383 0.522 0.544 Z7 0.717 0.239 0.109 Class 3 0.739 0.783 0.891 Z8 0.500 0.456 0.130 Class 4 0.739 0.783 0.891 Z9 0.630 0.609 0.489 Class 1 0.391 0.391 0.565 Z10 0.500 0.478 0.130 Class 4 0.717 0.783 0.891
expert committee has assigned considerable importance to both the expected surface deformation (g ) and2.3 building vulnerability (g2.5.1) criteria, by ascribing weights of 20 and 10, respectively, which represent 43% and 22% of total criteria family weight. Such a decision suggests that these two criteria play a determinant role in the choice of the risk class.
Note that a single criterion with a low weight may be sufficient to change the decision made by the ‘strong-est’ criterion in the family, provided it is contradictory and imposes a ‘veto’(Roy, 1985; Yu, 1992), asshown below.
5. Implementation of the ‘ELECTRE TRI’ method
This section will describe the prioritisation method for zones at risk through a ten-zone sample (Table 5). In practical terms, the method is capable of handling many more zones; up until now, we have actually applied it on over 300 zones.
All ten zonesincluded in Table 5 contain buildings. Parametric studies have allowed identifying indifference and preference thresholds for each quantitative criterion. In order to specify the appropriate monitoring system for each zone in Table 5, it is necessary to define entry conditions for risk classes. A statistical data analysis of an assignment sample of 52 zones under buildings and 69 zones under infrastructures helped establish these conditionswhich have then been validated by the committee of experts.
The ELECTRE TRI method wasused in conjunction with the ELECTRE TRI software, Version 2.0 (Mous-seau et al., 1999). Thissoftware reliesupon two
proce-dures for risk class assignment: the pessimistic procedure and the optimistic procedure. The pseudo-disjunctive procedure mentioned above (Section 4.1) corresponds to the optimistic procedure in the software.
The two credibility indices s(Z ,Pr ) andi h s(Pr ,Z )h i
were calculated for each of the ten zonesand are presented in Table 6.
These credibility indices are then compared to param-eterl(see Section 4.1) which must be greater than 0.5. Thisvalue of l meansthat at least 50% of the criteria family accreditsthe entry of the zone Z into thei
considered risk class. In practice, the value of l hasto be greater than (1-highest weightytotal weight), i.e. above 0.57 in our case. With this minimum l value, assignment of a zone to a risk class needs the agreement of more than one criterion within the criteria family (thisvalue preventsthe most weighted criterion from being the only one to decide the assignment class). No value of parameter l higher than 0.57 isbetter than another. In this example, we have tested six values: 0.60, 0.65, 0.70, 0.75, 0.80 and 0.85.
For purposes of illustration, let’s consider zone Z8 and ls0.65. We first calculate the credibility indices and then proceed with risk class assignment. The com-parison procedure begins with the low profile Pr of3 Class 3. Z and Pr assume the values 11.2 MPa and 88 3 MPa on criterion g , respectively. From Table 5, we1.1
Table 7
Agreement and disagreement indices for the comparison between Z and Pr on each criterion8 3
Criterion Weight of Z S Pr8 3 Pr S Z3 8 Relation
criterionkj
Agreement Disagreement Agreement Disagreement between Z8 indexcj indexdj indexcj indexdj
and Pr3 g1.1 5 1 0 0 0 Z )Pr8 3 g1.2 1 1 0 0 0 Z )Pr8 3 g1.3 1 0 0 1 0 Z -Pr8 3 g1.4 1 0 0 1 0 Z -Pr8 3 g1.5 5 1 0 0 0 Z )Pr8 3 g2.1 1 1 0 0 0 Z )Pr8 3 g2.2 1 0 0 1 0 Z -Pr8 3 g2.3 20 0 0 1 0 Z -Pr8 3 g2.4 1 1 0 1 0 Z I Pr8 3 g2.5.1 10 1 0 1 0 Z I Pr8 3 Table 8
Sensitivity analysis for all 10 study zones
Zone Assignment of zone to risk Sensitivity Class(ls0.65) analysis
Z1 Class 1 Classes 1 and 2
Z2 Class 1 Classes 1 and 2
Z3 Class 2 Stable
Z4 Class 2 Stable
Z5 Class 4 Classes 3 and 4
Z6 Class 1 Classes 1 and 2
Z7 Class 3 Classes 3 and 4
Z8 Class 4 Classes 3 and 4
Z9 Class 1 Classes 1 and 2
Z10 Class 4 Stable
observe that Z ispreferred to Pr asfar ascriterion8 3
g1.1 isconcerned. Thus, the agreement index
c1.1(Z ,Pr )s18 3 and the disagreement index
d1.1(Z ,Pr )s0 (see Appendix A). We now proceed in8 3 the same manner for all criteria and for the two comple-mentary assertions ‘Z displays a risk at least as high as8 Pr ’3 (Z S Pr ) and ‘Pr displays a risk at least as high8 3 3 asZ ’8 (Pr S Z ) asshown on Table 7.3 8
Since no veto has been used in the present study(see Appendix A), all disagreements are equal to 0 (Table 7). The credibility indices s(Z ,Pr ) and8 3 s(Pr ,Z )3 8 thereby have the following values:
k c Z ,Prj j
Ž
8 3.
8
jgF s Z ,Pr sŽ
.
c Z ,Pr sŽ
.
s0.50-0.65 8 3 8 3 kj8
jgF k c Pr ,Zj jŽ
3 8.
8
jgF s Pr ,Z sŽ
3 8.
c Pr ,Z sŽ
3 8.
s0.74)0.65 kj8
jgFConsequently, Pr3 is strictly preferred to Z , the8 procedure is stopped and Z is than assigned to Class 4.8 To understand how this comparison procedure may proceed with other profiles, let’s now consider the example of zone Z . It hasbeen determined that when1 thiszone iscompared with the low profile Pr of Class3 3, the credibility index s(Z ,Pr )s0.72)0.65, while1 3
s(Pr ,Z )s0.50-0.65. Consequently, Z can be placed3 1 1 in Class 3. If we were to continue the comparison with the low profile Pr of Class 2, the credibility indices2 would be: s(Z ,Pr )s0.72)0.65 and1 2 s(Pr ,Z )s2 1 0.52-0.65. Z can thusbe placed in Class2 aswell. A1 comparison between Z and the low profile Pr of Class1 1 1 revealsthat: s(Z ,Pr )s0.50-0.65 and1 1 s(Pr ,Z )s1 1
0.54-0.65. Z and Pr are thereby incomparable and1 1 Z can then be assigned to Class 11 (according to the pseudo-disjunctive procedure).
By proceeding in the same manner for all zones with
ls0.65, zones Z , Z , Z and Z are assigned to Class1 2 6 9 1, zonesZ and Z to Class2, Z to Class3, and zones3 4 7 Z , Z and Z5 8 10to Class 4.
The robustness of the classification must, however, be demonstrated by analysing the sensitivity to the change of parameterl, the weighting sets, the thresholds and profiles (Roy and Bouyssou, 1993). The results from such a study are summarized in Table 8, which reveals that the classification of zones Z , Z and Z3 4 10 remains insensitive to parameter changes. The classifi-cation of other zones oscillates between two successive classes(see Table 8).
We have only shown results for ls0.65. If l were ascribed too high a value (e.g. 0.85), the principle of maximum caution would become exacerbated. Under such conditions, most comparisons conducted between zonesand profileswould conclude with their incompa-rability and would assign zones to Class 1 by virtue of the pseudo-disjunctive procedure.
6. Conclusion
In early risk-related decision-making phases, methods and tools are necessary to manage incomplete, inaccurate and heterogeneousinformation. However, all thisavail-able information must be combined in a rational way capable of assisting the decision-maker in risk preven-tion efforts(Dikau et al., 1996; Montovani et al., 1996; Soetersand Van Westen, 1996; Wu et al., 1996). Decision-aid methods are helpful in using and formally presenting available information in order to provide decision-makers and users with a common basis for discussing and resolving problems. In the case of the Lorraine iron-mining basin, analysis of the risk due to mining subsidence is a limited-data decision problem, in which the decision consists of choosing appropriate monitoring systems for all zones concerned. The ‘ELEC-TRE TRI’ multi-criteria, decision-aid method is of considerable utility in this context for prioritising zones at risk. Analyses have been based on several parameters and are therefore inherently multi-criteria. The ELEC-TRE TRI approach is based on comparison between study zones and the entry conditions (profiles) of predefined risk classes. This comparison is conducted for each criterion (partial comparisons) and all criteria are then synthesized into a single global conclusion regarding the entry(or non-entry) of a zone into a class. The reliability of the resultsprovided isan important point for further study. The robustness of risk-zoning depends on several factors, including the accuracy of inputs, the definition of profiles and preference thresh-olds, and the weighting set. Sensitivity analyses are easy to carry out with ELECTRE TRI, which have up until now enabled classifying over 320 zones within the Lorraine iron-mining basin.
7. Nomenclature
Z :i Zone at risk.
S: Means‘«displays a risk at least as high as«’.
Z S Pr : Means ‘Z displays a risk at least as high asi h i
Pr ’.h
g :j Performance function of the criterionj. Used
to provide a quantitative or qualitative evaluation on thiscriterion.
gj(Z ):i Value ofg on the zone Z .j i
k :j Weight of criterionj.
Pr :h Low profile of the classh. Thisprofile
represents a limit between two successive classesh and (hq1).
q and p : Indifference and preference thresholds. Usedj j
to take uncertainty into account on the criterionj.
v :j Veto threshold on the criterionj. Used to
allow the criterion j to put a veto on the assignment of a zone into a class.
s(Z ,Pr ): Credibility index of the assertion Z S Pr .i h i h
Level of confidence of the assertion ‘Z is ati
least as risky than Pr ’.h
l: Minimum ratio of criteria required to validate the assertion Z S Pr .i h
Appendix A:
A.1. Indifference and preference thresholds
The indifference threshold q and the preferencej
threshold p are defined asfollowsj (see Fig. 11): – If Ngj(Z )yg (Pr )N islessthan q , the difference isi j h j
considered as insignificant; it can then be stated that zone Z and the low profile of classi h, Pr , areh
indifferent for the given criterion (Roy, 1985; Yu, 1992);
– If Ngj(Z )yg (Pr )N isgreater than q , the differencei j h j
is considered as significant; if gj(Z ) isgreater thani
gj(Pr ), it will then be stated that the risk for zoneh Z isstrictly greater than that for the low profile ofi
class h, Prh (otherwise, the risk for Pr is strictlyh
greater than that for Zi) (Roy, 1985; Yu, 1992); – If the preference threshold p isnot equal to thej
indifference threshold q , the interval between thesej
two valuesrepresentsan ambiguity range over which it is presumed that the risk is higher even though the difference Ngj(Z )yg (Pr )N cannot be genuinely con-i j h
sidered as significant. It will then be stated that the risk for zone Z is slightly higher than that for thei
low profile of class h, Prh (otherwise, the risk for
Pr isstrictly higher than that for Zh i) (Roy, 1985; Yu,
1992).
By convention, if a zone isindifferent with a low profile in a given class, the zone is assigned to this class; it will be said that the risk class is closed at the bottom.
In ideal cases, where the evaluation of zone Z oni
each criterion isbetween the evaluation of Prh and Prhy1, then Z is assigned to classi h. However, thiscase
israrely encountered (Roy, 1985). Thisiswhy we introduce the credibility index.
A.2. Credibility index
Thisindex isbuilt with all criteria and used to estimate the credibility of the assertion: ‘the risk level of Z isat least ashigh asthat of Pr ’i h (Z S Pr ) (ori h
‘the risk level of Pr is at least as high as that of Z ’h i
(Pr S Z )). It isdenotedh i s(Z ,Pr ) (ori h s(Pr ,Z )) andh i
may be equal to valueslying between 0 and 1 (Roy, 1985). When thisindex equals0, the assertion is completely rejected either because no criterion satisfies it or because a criterion is in a position to veto. If the
Fig. 12. Partial agreement indexc and disagreement index d .j j
index equals 1, the assertion is completely accepted, which meansthat no criterion isin opposition. Between 0 and 1, the credibility index isbased on two other component indices: an agreement index and a disagree-ment index(see Fig. 12).
The agreement index isa weighted mean of the partial agreement indicesand iscalculated asfollows:
k c Z ,Prj j
Ž
i h.
8
jgF c Z ,Pr sŽ
i h.
kj8
jgFwhere F isthe set of criteria numbersand c the partialj
agreement index on criterionj (Fig. 12).
When the assertion ‘the risk for Z is at least as highi
asthat for Pr ’ isrejected for a criterion, the partialh
agreement index for thiscriterion isequal to 0. The agreement index therefore only takesaccount of those criteria for which this assertion is not rejected.
The partial disagreement indexdj(Z ,Pr ) iscalculatedi h
for criteria that reject the assertion ‘the risk for Z is ati
least ashigh asthat for Pr ’ and isdefined asfollows:h
d Z ,Pr s1j
Ž
i h.
µ
∂
v g PrjŽ Ž
j h..
ymin g Z yg Pr ,v g PrjŽ
i.
jŽ
h.
jŽ Ž
j h..
yµ
∂
v g PrjŽ Ž
j h..
ymin g Z yg Pr ,p PrjŽ
i.
jŽ
h.
jŽ
h.
where vj(g (Pr )) denotesa veto threshold for criterionj h
g , related to profile Pr . When the risk level of zonej h
Z for criterioni g issj ignificantly lower than that of profile Prh for the same criterion (g (Pr )yg (Z ))j h j i
vj(g (Pr )), the assertion ‘the risk level for Z is at leastj h i
ashigh asthat for Pr ’ must be rejected andh dj(Z ,Pr )si h
1 (Roy, 1985). When the assertion is validated on
criterion g , thisindex isequal to 0. Such a case arisesj
when the difference between the risk level of Z andi
that of Pr on the considered criterion is less than theh
preference thresholdpj(Pr ). Between these two values,h
the index increasesasa function of the value of the difference between the risk level of Z and that of Pri h
(Yu, 1992) (Fig. 12).
In light of the above discussion, the credibility index isdetermined asfollows:
– s(Z ,Pr )sc(Z ,Pr ), in the absence of disagreeingi h i h
criteria;
– s(Z ,Pr )s0, if a disagreeing criterion imposes itsi h
veto on the assertion: ‘the risk level of Z is at least1 ashigh asthat of Pr ’;h
– s(Z ,Pr )-c(Z ,Pr ), if 'jyd (Z ,Pr ))c(Z ,Pr ).i h i h j i h i h
The credibility index isthusdefined asfollows: 1yd Z ,Prj
Ž
1 h.
s Z ,Pr sŽ
i h.
c Z ,PrŽ
i h.
2
, 1yc Z ,PrŽ
i h.
jgF where: ¯ Fs jgFyd Z ,Pr )c Z ,Prµ
jŽ
1 h.
Ž
1 h.
∂
A.3. ‘ELECTRE TRI’assignment procedures
Two extreme rationalesmay be called upon when assigning a zone to a particular risk class: either Z isi
assigned to the lowest class given by a criterion or Zi
is assigned to the highest class given by a criterion. These two rationales correspond to a principle of cau-tion, which is minimized in the first case and maximized in the second. ELECTRE TRI offers two assignment procedures to attenuate these two extremes, namely a
pseudo-conjunctive procedure and a pseudo-disjunctive procedure. The pseudo-disjunctive procedure, inspired from the maximum caution rationale, istherefore well adapted to risk prioritisation. According to this proce-dure, the entry of a zone into a classisaccepted if the zone ispreferred (higher risk level), indifferent (equiv-alent risk level) or incomparable (risk level not com-parable) to the low profile of the class. With the pseudo-conjunctive procedure, the zone may enter into a classonly if it ispreferred or indifferent to the low profile of the class. The treatment of incomparability differsfrom one procedure to the other.
References
Arondel, C., Girardin, P., 2000. Eur. J. Oper. Res. 127 (3), 467–482. Deck, O., Al Heib, M., Homand, F., 2003. Eng. Struct. 25 (4),
435–448.
Didier C., 1999, Conference de la decennie internationale de la´ ´ prevention des catastrophes naturelles, June 17–19, Paris, Session´ 2, pp. 85–92.
Dikau, R., Cavallin, A., Jager, S., 1996. Geomorphology 15 (3–4), 227–239.
Ministere de l’Amenagement du Territoire et de l’Environnement,` ´ Ministere de l’Equipement, des Transports et du Logement, 1999,` Plansde prevention desrisquesnaturels´ (PPR)-Risques de
mou-vements de terrains-Guide methodologique, Paris, La Documenta-´ tion Francaise.¸
Montovani, F., Soeters, R., Van Westen, C.J., 1996. Geomorphology 15, 213–225.
Mousseau V., Slovinski R., Zielniewicz P., 1999, ELECTRE TRI 2.0a-Methodological guide and user’s manual, Document du LAM-SADE no 111, Paris.
Roy B., Bouyssou D., 1993, Aide multicritere a la decision: Methodes` ` ´ ´ et cas, Paris, Economica.
Roy, B., Figuera, J., 2002. Eur. J. Oper. Res. 139 (2), 317–326. Roy B., 1985, Methodologie multicritere d’aide a la decision, Paris,´ ` ` ´
Economica.
Soeters R., Van Westen C.J., 1996, Slope instability recognition, analysis, zonation, landslides, investigation and mitigation, Special report 247, Transportation Research Board, National Research Council, pp. 129–177.
United Nations, Department of Humanitarian Affairs, Internationally-certified glossary of basic terms related to Disaster Management, 1992.
Varnes D.J., International Association of Engineering Geology Com-mission on Landslides and Other Mass Movements on Slopes, 1984, Landslide Hazard Zonation: a review of principles and practice, United NationsEconomic, Scientific and Cultural Organ-ization, Natural HazardsSeries, No. 3, pp. 63–65.
Varoquaux J.A., 1995, Histoire d’une profession, Les Mines de Fer de France, Chambre syndicale desMinesde Fer de France, ISBN 2-907270-50-8.
Whittaker, B.N., Reddish, D.J., 1989. Subsidence: Occurrence, Pre-diction and Control. Elsevier.
Wu T.H., Tang W.H., Einstein H.H., 1996, Landslide hazard and risk assessment, Investigation and mitigation, Special report 247, Trans-portation Research Board, National Research Council, pp. 129– 177.
Yu W., 1992, Aide multicritere a la decision dans le cadre de la` ` ´ problematique du tri, Ph.D. Thesis, Universite de Paris-Dauphine.´ ´