HAL Id: hal-03095257
https://hal.mines-ales.fr/hal-03095257
Submitted on 28 Jan 2021
HAL is a multi-disciplinary open access
archive for the deposit and dissemination of
sci-entific research documents, whether they are
pub-lished or not. The documents may come from
teaching and research institutions in France or
abroad, or from public or private research centers.
L’archive ouverte pluridisciplinaire HAL, est
destinée au dépôt et à la diffusion de documents
scientifiques de niveau recherche, publiés ou non,
émanant des établissements d’enseignement et de
recherche français ou étrangers, des laboratoires
publics ou privés.
Synthesis of α-aminophosphonate based sorbents –
Influence of inserted groups (carboxylic vs. amine) on
uranyl sorption
Marwa Rashad, Ibrahim El-Sayed, Ahmed Galhoum, Marwa Abdeen, Hamed
Mira, Emad Elshehy, Suojiang Zhang, Xingmei Lu, Jiayu Xin, Eric Guibal
To cite this version:
Marwa Rashad, Ibrahim El-Sayed, Ahmed Galhoum, Marwa Abdeen, Hamed Mira, et al.. Synthesis
of α-aminophosphonate based sorbents – Influence of inserted groups (carboxylic vs. amine) on uranyl
sorption. Chemical Engineering Journal, Elsevier, In press, pp.127830. �10.1016/j.cej.2020.127830�.
�hal-03095257�
Synthesis of
α
-aminophosphonate based sorbents – Influence of inserted
groups (carboxylic vs. amine) on uranyl sorption
Marwa M. Rashad
a, Ibrahim E. El-Sayed
b,*, Ahmed A. Galhoum
a,*, Marwa M. Abdeen
c,
Hamed I. Mira
a, Emad A. Elshehy
a, Suojiang Zhang
d,e, Xingmei Lu
d,e, Jiayu Xin
d,e,
Eric Guibal
f,*aNuclear Materials Authority, P.O. Box 530, El-Maadi, Cairo, Egypt
bChemistry Department, Faculty of Science, Menoufia University, Shebin El-Kom, Egypt cHigher Institute of Engineering and Technology, HIET, Menofia, Egypt
dBeijing Key Laboratory of Ionic Liquids Clean Process, CAS Key Laboratory of Green, Process and Engineering, Institute of Process Engineering, Chinese Academy of Sciences, 100190 Beijing, China
eInnovation Academy for Green Manufacture, Institute of Process Engineering, Chinese Academy of Sciences, Beijing 100190, China fInstitut Mines Telecom – Mines Al`es, C2MA, Univ. Montpellier, 6 Avenue de Clavi`eres, F-30319 Al`es Cedex, France
Keywords: Uranyl ions Aminophosphonates Sorption isotherms Uptake kinetics Desorption Thermodynamics A B S T R A C T
A one-pot synthesis procedure is designed for preparing three α-aminophosphonates (R-H, R-COOH, and R-NH2);
through the reaction of amine precursors (aniline, anthranilic or o-phenylene diamine, respectively) with sali-cylaldehyde and triphenylphosphite, under controlled conditions. These materials are first characterized by elemental analysis, FTIR, 1H NMR, 31P NMR, BET, DLS, pHzpc, TGA and titration. In a second step, the sorption
properties are compared for U(VI) recovery from mildly acidic solutions. At the optimum pH (i.e., pH 4) the sorbents can be ranked according the series: R-H (1.057 mmol U g−1) > R-NH
2 (0.746 mmol U g−1) > R-COOH
(0.533 mmol U g−1
). The isotherms are fitted by the Langmuir equation. Uranium uptake is relatively fast: under selected experimental conditions, the equilibrium is reached within 90 min of contact. The kinetic profiles are indistinctly fitted by the model of resistance to intraparticle diffusion and the pseudo-first order rate equation. The study of sorption thermodynamics shows substantial changes between the sorbents: uranyl uptake is endothermic with R-H and R-NH2 sorbents, while the reaction is exothermic with R-COOH sorbent. The diversity
in functional groups and the speciation of uranyl in sulfuric acid solutions induce metal-binding through a combination of chelation and anion-exchange mechanisms (in function of pH). Sodium bicarbonate solutions achieve complete desorption of uranium from loaded-sorbents; the resins can be recycled for a minimum of 4–5 cycles with limited loss in efficiencies. The successful application of these resins for uranium recovery from acidic ore leachates demonstrates their promising properties for valorization of low-grade ores.
1. Introduction
The interest of research community for uranium recovery is driven by two key parameters. The importance of uranium for nuclear energy production and the near-future shortage of U-bearing resources make the topic economically relevant. In addition, the toxicity of uranium (and associated radionuclides) makes the treatment of effluents and groundwater (or surface waters) a hot environmental topic. Therefore, separation and recovery of uranium are significant for both reasonable utilization of uranium resources (especially low-grade mineralization)
and environmental protection [1–5].
Solvent extraction is recognized as an effective and competitive method for the extraction of uranium from concentrated solutions [6,7]. For more diluted effluents, sorption processes are more appropriate, including biosorbents [8,9], ion-exchange and chelating resins
[1,3–5,10], extractant-impregnated resins [11] because of fast kinetics, environmentally friendliness, good selectivity, high efficiency and re- usability.
Many sorbents have been successfully tested for uranium recovery such as inorganic materials (i.e., clay minerals, metal oxides,
* Corresponding authors.
appropriate dilution of the stock solution immediately prior to use. Uranium concentration was determined using Arsenazo III colorimetric method [22] and a UV–Visible spectrophotometer (Metertech Inc, model SP-8001, Taipei, Taiwan).
2.2. Synthesis of sorbents
Scheme 1 shows the synthesis route for the preparation of the resins, while Scheme 2 gives their suggested structures. Amine (aniline/ or O- phenylenediamine / or anthranilic acid) (1 mmol), salicylaldehyde (1 mmol), and triphenylphosphite (1 mmol) were dissolved in CH3CN (5
mL). The mixture was stirred at room temperature for 10 min before the Lewis acid catalyst (i.e., LiClO4, 20 mg) was added, at once. The mixture
was stirred at room temperature for 3 days [3]. The final products were collected by filtration, washed with acetonitrile and then air-dried to produce the corresponding α-aminophosphonates. In order to purify the
materials, the solids were recrystallized after being dispersed in chlo-roform or methanol. Finally, the dried powders were stored in a desic-cator, before use.
2.3. Characterization of materials
The elemental analysis (C, H, N) was determined using an automatic analyzer (CHNS Vario EL III-elementar analyzer, Elementar, Germany), at the Micro Analytical Unit (al-Azhar University, Egypt). Phosphorus content was specifically analyzed after chemical digestion in a sulfuric/ nitric solution followed by spectrophotometric analysis (absorbance measured at λ: 410 nm) [23,24]. The 1H NMR spectrum was recorded at
400 MHz in DMSO‑d6 using a JEOL ECA-500 II spectrometer (JEOL,
Tokyo, Japan) (at Analytical Lab, from Mansoura University, Egypt).
31PNMR spectrum was recorded at 162 MHz in DMSO‑d
6 using a
BRUKER spectrometer (JEOL, Tokyo, Japan) (at Analytical Lab, from Zagazig University, Egypt). The FTIR spectra were directly obtained, in the wavenumber range 4000–400 cm−1, using a ThermoFisher Nicolet
IS10 (Waltham, MA, USA spectrometer) (at Analytical Lab, from Man-soura University, Egypt). TG/DTA analyses were recorded using a thermogravimetric and differential thermal analyzer EXSTAR 6000 TG/ DTA 6300 N (Seiko Instruments Inc. (SII), Chiba, Japan). Experiments were performed under N2/O2 atmosphere, within the temperature range
20–1000 ◦C and at the ramp rate of 10 ◦C/min. Surface area and pore
volume were determined from nitrogen adsorption–desorption iso-therms using a Quantachrome Nova 3200 instrument (Quantachrome Instruments, Boynton Beach, FL, USA). The specific surface area and porous characteristics of sorbents were obtained by BET method and BJH method, respectively, under a degassing temperature of 80 ◦C for 3
h using a Belsorp-Max II (Microtrac BEL, now Microtrac MRB, Haan, Germany). The size distribution and zeta-potential of the nanocomposite were determined by diffraction light scattering using a Zetasizer Nano ZS (Malvern Instruments Ltd., Malvern, UK). The pH at zero-charge (pHPZC) of the three resins was determined by the pH-drift method
[25]: the resins were mixed, for 24 h, with a series of 0.1 M NaCl so-lutions at different pH values (pH0); the pHPZC corresponds to the
con-ditions for unchanged pH (i.e., pH0 =pHeq, equilibrium pH).
Scheme 1. Schematic route for the synthesis of α-aminophosphonates-
based sorbents.
mesoporous silica, metal–organic frameworks) [1,2,12], organic poly-mers (i.e., resins, cellulose, chitosan) [3–5,10], and carbonaceous ma-terials (i.e., activated carbon, carbon nanotubes, graphene oxides) [4,5]. Chelating resins are polymers bearing specific reactive groups that chelate metal ions. These chelating properties roughly obey the Hard and Soft Acid Base theory (HSAB) developed by Pearson [3–5,10,13]. Uranium is considered a hard acid that shows a higher affinity toward hard bases; therefore, chelating agents bearing O, N, and P groups are highly effective for the selective sorption of uranium ions (high capacity, selective separation) [2–5,10,14,15]. Particular attention was recently paid to the progress made in designing organophosphorus ligands. Indeed, these compounds have good metal-complexing properties that were widely used in water treatment, for the removal of radioactive and transition metals and for pollution control, at industrial scale [2–5,16]. More specifically, aminophosphonates have attracted continuous attention from the research community for the last decades [3,17–21]. However, there is still a need for developing new materials based on this type of chemical structure with selective functionalities, excellent extraction properties and high stability. There is also a need for better understanding how the substituents grafted on the ligand can either promote or degrade sorption performance. In the extraction of uranium from aqueous solutions, both in terms of solvent extraction and sorption on ion-exchange and/or chelating resins, the presence of phosphorus groups (TBP, phosphonate, aminophosphonate) revealed very efficient for the recovery of uranium from aqueous solutions. For this reason, the design of these resins was oriented to the grafting of phosphonate groups. However, the chemical environment of phosphonate groups may change the reactivity of these functional groups due to induction effects, acid-base effects or dual functionalities. This observation moti-vated the design of these new sorbents and the comparison of their global sorption properties (including desorption and selectivity issues). This study focuses on the synthesis of a new series of α
-amino-phosphonate-based sorbents. Three derivatives of α-aminophosphonate
are prepared using a one-pot synthesis procedure and direct reaction of amine precursors with salicylaldehyde and triphenylphosphite. The structure/activity relationship is studied through the evaluation of uranyl sorption properties while varying the chemical environment of grafted amine, from aniline (the ‘‘simplest’’ aromatic amine), to an-thranilic (amine ortho-substituted with a carboxylic acid or, o-amino-benzoic acid) and to O-phenylene diamine (ortho-aromatic diamine). The structural and functional characteristics of the three α
-amino-phosphonate derivatives are investigated by elemental analysis, FTIR,
1H NMR, 31P NMR, BET, DLS, TGA, and pHPZC. Uranium sorption
properties are investigated in batch. After pH optimization, uptake ki-netics are investigated and modeled using conventional equations. The sorption isotherms are investigated at different temperatures for eval-uating the thermodynamics of U(VI) sorption. The recycling of the sor-bents is investigated along five cycles of sorption and desorption; using sodium bicarbonate solutions as the eluent. In order to evaluate the selectivity of the sorbents, the resins are tested for U(VI) sorption from acidic leachates of polymetallic ore.
2. Materials and methods
2.1. Materials
Salicylaldehyde, aniline, anthranilic acid, O-phenylene diamine, triphenylphosphite were supplied by Sigma-Aldrich (Saint-Louis, MS, USA). Acetonitrile, and lithium perchlorate were obtained from Fluka AG (Buchs, Switzerland), and all other chemicals were Prolabo products (Prolabo, VWR, Fontenay-sous-Bois, France). Reagents were used as received. Uranium stock solution was prepared from UO2
(O-COCH3)2⋅2H2O (supplied by Sigma Aldrich, Saint-Louis, MS, USA); the
salt was dissolved in concentrated sulfuric acid under heating before being diluted with demineralized water until reaching the final con-centration of 1000 mg U L− 1. The working solutions were prepared by
2.4. Sorption and desorption experiments
Batch experiments were carried out by contact of a mass of sorbent (m, g) with a fixed volume (V, L) of aqueous metal-containing solution (C0, mmol U L−1), at initial pH value (pH0) in a conical flask. The sorbent
dosage, SD = m/V was set, unless specified, at 0.5 g L−1. The flasks were
maintained for 3 h under agitation (200 rpm), at room temperature (i.e., T: 25 ± 1 ◦C). After equilibration and phase separation (filtration
through 1.2 µm pore-size filter membrane), the residual uranium con-centration in the aqueous phase (Ceq, mmol U L−1) was determined. The
concentration of uranium in the sorbent (qeq, mmol U g−1) was
calcu-lated by the mass balance equation, qeq =(C0 - Ceq) × V/m. The dis-tribution ratio, D (L g−1), corresponds to D = q
eq/Ceq. The pH was not
adjusted during the sorption step but the equilibrium pH was recorded. Isotherm studies were investigated by mixing 0.01 g of sorbent with 20 mL of U(VI) solution at different initial concentrations (i.e., 0.1–1.30 mmol U L−1, at pH 4) and shaking for 2 h at 200 rpm. Uptake kinetics
was performed using a sorbent dosage of 0.5 g L−1 and a concentration
of 0.323 mmol U L−1 at 298 K: samples were collected under agitation at
fixed contact times. The residual metal concentration was determined, after phase separation.
Standard experimental conditions were set at T: 25 ± 1 ◦C and pH: 4
± 0.01; the contact time was fixed to 2 h. Preliminary studies have shown that an extended contact time (extended up to 24 h) dids not significantly change sorption performance. Sodium bicarbonate (0.05 M) and HCl (0.1 M) solutions were initially tested for uranium desorp-tion; the two eluents showed comparable desorption efficiencies. Being less aggressive, sodium bicarbonate (0.05 M) was chosen as the eluent for the continuation of the study of metal desorption. The contact time between the eluent and the metal-loaded sorbent was set to 90 min (under constant agitation). The sorption yield after regeneration for four additional cycles was compared to the value reached for the first cycle. The desorption efficiency (DE) (i.e., DE = CD ×V × 100/qd ×m) and regeneration rate (RE) (i.e., RE = qd ×100/qe) were calculated; where CD (mmol U L−1) is U(VI) concentration in eluate; qd (mmol U g−1) is the
sorption capacity for metal loaded material (before desorption experi-ment), qe (mmol U g−1) is the sorption capacity at the first cycle. The
distribution of the particle sizes of the different sorbents (analyzed by DLS) showed that the smallest particles can pass through the mem-branes. However, the side-aggregation (facilitated by the hydroxyl groups on the sorbents) may contribute to side-aggregation that artifi-cially grows the particle size while operating sorption. Actually, the weight loss at the first step was evaluated close to 3%, while it was negligible (below 1%) for the next cycles. This weak weight loss of sorbent can partially contribute to the slight decrease in sorption per-formance at sorbent recycling.
The fitting of uptake kinetics and sorption isotherms has been per-formed using conventional equations that are summarized in Table AM1 (see Additional Material Section). Parameters were obtained by non- linear regression analysis using Mathematica® software facilities.
2.5. Application to acidic ore leachate
The ore was collected on the site of El-Sella (Southern Eastern Desert, Egypt). This site is located Latitudes 22◦14′30// and 22◦18′36//N and
Longitudes 36◦11′45// and 36◦16′30// E, at a distance of about 60 km
at the southwest of Abu Ramad. Map AM1 (see Additional Material Section) reports the main geological characteristics of this site. Ac-cording to Ibrahim et al. [26], it is essentially composed of potash- feldspar, plagioclase, muscovite and biotite. Secondary minerals are sericite, kaolinite and chlorite. The uranium mineralization is mainly of the oxidized type where it consists essentially of secondary uranium minerals: uranophane, ß-uranophane and ß-autunite (uranium phos-phate mineral, (Ca(UO2)2(PO4)2.10-12H2O). Autunite is mainly
observed in shear zones, in addition to uranophane and beta- uranophane. Secondary uranium minerals occur either disseminated or as cavity filling. Some accessory minerals, such as monazite, fluorite and apatite, which are considered as the main sources for REEs
[3,26,27], have also been identified. Table AM2 reports the main con-stituents of the ore. The major oxides in the ore were quantified by the procedure of rapid silicate analysis [28]: the ore was dissolved in alka-line solution for SiO2 determination and in an acid solution for the
determination of MgO, TiO2, CaO, Al2O3, P2O5, Fe2O3 oxides (etc.).
Other elements were obtained by spectrophotometry (Si, Al, P, Mn, Ti), titration (Mg, Ca, Fe) or atomic absorption spectrometry (Na, K) [28].
Acidic leaching was processed in batch reactor after grinding the mineral and sieving the fraction below 100 mesh (149 µm). Sulfuric acid (50 g L−1, ~ 0.51 mol L−1) was mixed with grinded ore at 50 ◦C for 6 h;
the solid/liquid ratio was set at 1:3. After leaching operation, the ore was washed with demineralized water and the washing water was mixed with leachate to produce pregnant leaching solution (PLS). Metal con-centrations in the leachate solution were determined by titration for U to avoid the interference in spectrophotometry method [29,30]; where, uranium analysis was performed using the oxidimetric titration method against ammonium metavanadate (diphenylamine sulfonate being used as the indicator and uranium was reduced with ammonium ferrous sulfate just prior analysis) [29]. The composition of PLS is summarized in Table AM2. Uranium concentration in the leachate approaches 1026 mg U L−1; leaching yield reaches 86%. The pH of the leachate was 1.98.
In order to reduce the concentration of iron (by precipitation), the pH of PLS was raised to 3.5–4. Table AM2 shows the composition of PPLS (partially precipitated PLS).
Sorption test was carried out on PPLS solution with a pH controlled to 4 and with a sorbent dosage of 0.5 g L−1; the suspension was mixed for
3 h, at room temperature (i.e., 25 ± 1 ◦C). The filtrated sample was
analyzed for residual concentrations using atomic absorption spec-trometer (Solar Unicam 969 AAS, Thermo Scientific, Waltham, MA, USA).
Annex (see Additional Material section, AMS) shows the reproduc-ibility of sorption performances for pH effect, uptake kinetics, sorption isotherms and sorbent recycling. The replicates show good reproduc-ibility and the largest differences were reported for R-COOHG (tests having been performed with another production of R-COOH sorbent, new stock).
3. Results and discussion
3.1. Synthesis and characterization of new aminophosphonate sorbents
Scheme 1 illustrates the synthesis route for the preparation of
α-aminophosphonates. This simple one-pot reaction occurs between
amine compounds (whatever the precursor) and both salicylaldehyde and triphenylphosphite; LiClO4 is used as the catalyst for the conversion
into resins (with tentative structures represented on Scheme 2). Scheme AM1 (see Additional Material Section) shows the suggested mechanisms for the molecular interactions between the reagents for producing R-H (aniline precursor); similar process is suggested for the other sub-stitutions. The first step consists of the formation of an imine- intermediate, followed by the attack of this intermediate by nucleo-philic phosphite (leading to the formation of phosphonium ion). This reaction is catalyzed by the presence of the Lewis acid catalyst (i.e.,
Scheme 2. Structure of aniline-, anthranilic-, and o-phenylenediamine-
(a) 78.0% for R-H (i.e., 2.69 g for 3.45 g, the limiting agent is aniline),
(b) 76.0% for R-COOH (i.e., 2.95 g for 3.88 g, the limiting agent is 2-aminobenzoic acid), and
(c) 77.1% for R-NH2 (i.e., 2.82 g for 3.66 g, the limiting agent is
salicylaldehyde).
3.1.1. Elemental analysis
The elemental analysis of the α-aminophosphonate derivatives
con-firms the effectiveness of the reaction between amine-bearing com-pounds and triphenylphosphite: the presence of both N and P elements demonstrates the formation of aminophosphonate (Table 1).
The P content (weight percentage) in the sorbents is: 7.75%, 7.25% and 7.59% (i.e., 2.50 mmol P g−1, 2.34 mmol P g−1 and 2.45 mmol P
g−1, respectively) for R-H, R-COOH and R-NH
2, respectively. Theoretical
molecular formula and weight of investigated α-aminophosphonate
derivatives were proposed, as follows for aniline-derivative (R-H; M.F.: C25H22NO4P), anthranilic acid-derivative (R-COOH; M.F.:C26H22NO6P),
and o-phenylenediamine-derivative (R-NH2; M.F.:C25H23N2O4P).
Chemical structures were drawn using ChemBioDraw ultra, v.12.0. The supposed chemical formulae are reported in Table 1, with the corre-sponding molecular weights and the expected mass fractions for the different elements. The molecular weights increase for the different derivatives according to: R-H (431.42 g mol−1) < R-NH
2 (446.43 g
mol−1) < R-COOH (475.43 g mol−1). This means that in 1 g of sorbent,
the theoretical number of mmoles follows the reverse ranking: R-COOH (2.103 mmol) < R-NH2 (2.224 mmol) < R-H (2.318 mmol). The P
content is roughly consistent with the stoichiometry of the theoretical molecular formula for the different sorbents: R-H sorbent (i.e., 1.08 mol P per mol of resin), R-COOH (i.e., 1.11 mol P per mol of resin) and R-NH2
(i.e., 1.10 mol P per mol of resin). It is noteworthy that the fraction of nitrogen exceeds the expected percentages: compared to expected structure, the excess represents from 36% to 61% depending on the resin. On the other hand, the fractions of C and H are generally lower than expected, with the remarkable exception of H in R-NH2 that shows
a higher H content than in the theoretical formula. These discrepancies may be associated to the impact of moisture fraction and to the release of constitutive (bound) water.
3.1.2. Fourier transform infrared spectroscopy (FTIR)
FTIR spectroscopy was used for characterizing the functional groups on the sorbent (Fig. 1) and their interactions with uranyl ions (UO22+)
(Figs. 2). The reaction of salicylaldehyde with triphenylphosphite leads to the formation of α-aminophosphonate, which is confirmed by the
appearance of specific peaks on FTIR spectra, especially assigned to P- based reactive groups. For example, three series of peaks are identified:
(a) at 1210–1253 cm−1 for υ(− P––O) [16,31,32],
(b) at 916–943 cm−1 for υ(P− O− C) [31–35],
(c) at 749–756 cm−1 for P-CH bond.
The sharp peak at 1070 cm−1 is assigned to C––O bond. In addition,
the broad band centered around 1592–1662 cm−1, which is assigned to
C––C bond in aromatic rings, and the peak at 690 cm−1, attributed to υ(phenyl group) [3], demonstrate the effective reaction of the substrates
to form the aminophosphonate resins.
Based on the tentative structures of the α-aminophosphonate
de-rivatives depicted on Scheme 2, the groups the most significant for the identification of the different compounds can be reported, as follows.
For aniline-based derivative (i.e., R-H resin), the broad band observed between 2888 and 3119 cm−1 corresponds to the overlapping
of υ(− NH) and υ(− OH) vibrations. In the case of anthranilic derivative
(i.e., R-COOH), a typical carbonyl vibration (i.e., υ(− COO–) or υ(− C––O)) appears at 1662 cm−1 [35]. For the amino derivative (i.e., R-
NH2), the grafting of o-phenylenediamine is correlated to the broad
overlapping of stretching vibrations associated with –NH, –OH and –NH2 groups in the range 2858–3420 cm−1 [16,36]. In addition, the
intensities of signals associated to primary and secondary amine groups
Table 1
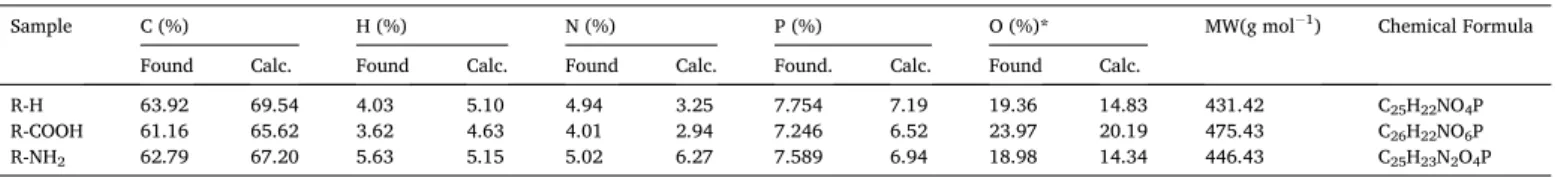
CHNP analysis of the three sorbents (R-H), (R-COOH) and (R-NH2) (Calculated: calc.; Found results).
Sample C (%) H (%) N (%) P (%) O (%)* MW(g mol−1) Chemical Formula
Found Calc. Found Calc. Found Calc. Found. Calc. Found Calc.
R-H 63.92 69.54 4.03 5.10 4.94 3.25 7.754 7.19 19.36 14.83 431.42 C25H22NO4P
R-COOH 61.16 65.62 3.62 4.63 4.01 2.94 7.246 6.52 23.97 20.19 475.43 C26H22NO6P
R-NH2 62.79 67.20 5.63 5.15 5.02 6.27 7.589 6.94 18.98 14.34 446.43 C25H23N2O4P
*: obtained by difference to 100% (w/w fraction).
2000 2400 2800 3200 3600 4000 Tr an sm itt an ce ( %) Wavenumber (cm-1) 3 R-COOH R-NH2 R-H 400 650 900 1150 1400 1650 1900 Tr an sm itt an ce ( %) Wavenumber (cm-1) 3 R-NH2 R-COOH R-H
Fig. 1. FTIR spectra of R-H, R-COOH, and R-NH2 sorbents.
LiClO4). In the last step of the process, the reaction of phosphonium
intermediates with water promotes the elimination of phenol and the formation of the relevant α-aminophosphonates (Scheme AM1). This
interpretation of resin synthesis is supported by a series of analyses (see below).
Based on the quantities of reagents and the effective amounts of products synthesized it was possible evaluating the yields to:
increase at 1300–1500 cm−1 and 1600 cm−1, respectively [16].
FTIR analysis was performed before and after uranyl ion (UO22+)
sorption; Figure AM1 (see Additional Material Section) shows some changes in terms of relative intensity of some bands, appearance and disappearance of valleys and shift of wavenumbers for some specific bands. The changes in the region 2218–3639 cm−1 can be directly
associated with the binding of metal ions, which, in turn, affects the environment of OH and NH groups [16,37]. The peaks at 1186–1251 cm−1 and 919–932 cm−1, which are assigned to
υ(–P––O), υ(P–OH) and υ(P-O-C) vibrations, are shifted and their relative intensity tends to
decrease (almost disappearing) after uranyl sorption [37]. The changes of the absorption peaks in this fingerprint region show that phosphonate functional groups contribute to uranyl sorption.
For R-H sorbent (Fig. 2a), the most substantial changes concern: (a) the appearance of new peaks at 1288 cm−1, 1245 cm−1 and 1164 cm−1,
(b) the disappearance of the peak at 891 cm−1, and (c) the shift of the
peak at 405 cm−1 (to 416 cm−1). For R-COOH (Fig. 2b), after U(VI)
sorption the shoulder at 1234 cm−1 disappears, the peaks in the region
1211–1142 cm−1 are affected by metal binding (decrease of relative
intensities at 1204 cm−1 and 1157 cm−1), while the peak at 935 cm−1 is
split into two peaks at 966 cm−1 and 932 cm−1. The shoulders at 1597
cm−1 and 1712 cm−1 (carboxylate and carboxylic groups, respectively
[38]) is smoothed after U(VI) binding. The intensity of the peak at ≈ 573 cm−1 substantially increases while the peak at 426 cm−1 disappears.
In the case of R-NH2 (Fig. 2c), the differences are poorly marked. The
poorly-resolved large band in the region 1640–1580 cm−1 is
charac-terized by two wavenumbers at 1614 cm−1 and 1597 cm−1 (with the
lowest transmittance); after U(VI) sorption, the peak at 1597 cm−1
decreases in intensity (appearing as a shoulder) and the width of the band is increased. Some weak shifts and changes in relative intensities are also observed in the range 1415–1329 cm−1 (decrease of the
1385–1365 cm−1 contribution after metal sorption). The sorption of U
(VI) shows significant differences in terms of modification of FTIR spectra: this confirms that the change in substituents affects the mech-anism of metal binding. Apart phosphonate groups, whose typical P- based bands around 1250–1180 cm−1 and 940–900 cm−1 are affected,
the environmental of specific groups are also modified by metal uptake: carbonyl groups for R-COOH (carboxylic/carboxylate groups in the range 1720–1580 cm−1, [38]) or amino groups (1650–1590 cm−1,
[38]). It is noteworthy that many studies reveal the presence of a specific band on sorbents loaded with uranyl ions at ≈ 900 cm−1 [39]; on these
spectra the peak is difficult to detect; this is probably due to the over-lapping with other signals around.
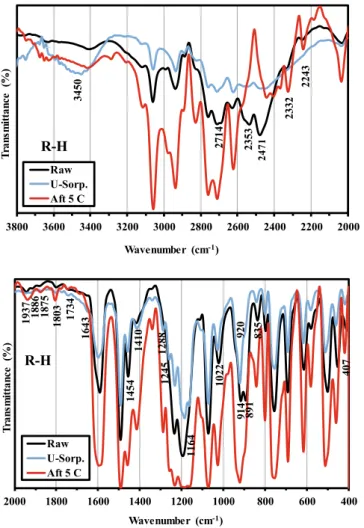
The sorbents were also analyzed after five cycles of sorption and desorption in order to assess their stability when exposed to different types of solutions (sorption at pH 4 and desorption in sodium bicar-bonate solutions, see below). Figs. 2 shows that the step of desorption partially restores the FTIR spectra of the sorbents. However, it is note-worthy that many tracer bands of metal sorption remain on the FTIR spectra of regenerated sorbents, which can be considered as “interme-diary” spectra between raw and metal-loaded sorbents. For example, in the case of R-H in the regions around 2500 cm−1 or 500–400 cm−1, the
spectrum is not fully restored. The peaks at 1289 cm−1 and 893 cm−1 are
also emblematic examples of the differences between raw and regener-ated R-H sorbent. For R-COOH, many bands also show that desorption cannot restore the spectrum, especially in the regions: 3400–3100 cm−1
2000 2200 2400 2600 2800 3000 3200 3400 3600 3800 Tr an sm itt an ce ( %) Wavenumber (cm-1)
R-H
Raw U-Sorp. Aft 5 C 345 0 235 3 224 3 233 2 247 1 271 4 400 600 800 1000 1200 1400 1600 1800 2000 Tr an sm itt an ce ( %) Wavenumber (cm-1)R-H
Raw U-Sorp. Aft 5 C 193 7 91 4 83 5 89 1 92 0 141 0 187 5 188 6 128 8 124 5 116 4 102 2 180 3 173 4 164 3 145 4 40 7Fig. 2a. FTIR spectra of R-H before (raw) and after U(VI) sorption (U-Sorp.)
and after 5 cycles of sorption and desorption (Aft.5C).
2000 2200 2400 2600 2800 3000 3200 3400 3600 3800 Tr an sm itt an ce ( % ) Wavenumber (cm-1)
R-COOH
Raw U-Sorp. Aft 5 C 345 3 2576 306 8 286 0 271 7 324 0 295 1 400 600 800 1000 1200 1400 1600 1800 2000 Tr an sm itt an ce ( % ) Wavenumber (cm-1)R-COOH
Raw U-Sorp. Aft 5 C 192 2 55 7 176 9 132 9 117 8 188 6 141 3 118 9 102 1 106 9 70 2 83 6 93 5 96 9 77 9 62 1 114 2 42 6 186 7 159 7 68 4 120 3Fig. 2b. FTIR spectra of R-COOH before (raw) and after U(VI) sorption (U-
(shift of the peak at 3223 cm−1, –OH bands), 1000–900 cm−1 (P-C
bonds) and 600–400 cm−1. In the case of R-NH
2 sorbent, the most
sig-nificant changes for regenerated sorbent vs. raw material are identified for C–H groups (increased intensity at 2853 cm−1 and 2923 cm−1), in the
range 1665–1560 cm−1 (width, and relative intensities of the peaks at
1614 cm−1 and 1597 cm−1 for amino groups). These variations clearly
demonstrate that the sorbent is modified during the alternated cycles of sorption and desorption; this may explain the progressive (slight) decrease in sorption and desorption performances (see below, Section 3.2.4.). The decrease in sorption efficiency may be explained by the chemical change in the sorbent and the accumulation of uranyl (although uranyl band at ≈ 900 cm−1 does not appear clearly on the
series of FTIR spectra).
3.1.3. 1H NMR and 31P NMR spectroscopies
The aromatic protons of the four benzene rings of α
-amino-phosphonates (Fig. AM2a) show a complex multiplet at δ = 6.50–7.27 ppm for R-H, 7.14–7.83 ppm for R-COOH and 6.76–8.06 ppm for R-NH2.
In addition, the carboxylate proton for R-COOH appears at δ = 12.98 ppm and the NH proton exhibits a multiple singlet at 9.19 ppm. While the P-C–H proton signal appears as doublet at δ = 5.25 ppm (dd, 1H, J = 2.5 & 3.0 Hz) for R-H, 5.79 ppm (dd, 1H, J = 9 Hz) for R-COOH and 4.90 ppm (d, 1H, J = 24.5 Hz), due to its coupling with phosphorus and proton of N–H. The N–H proton signal appears at δ = 5.42 ppm as broad singlet and the NH2 proton show a singlet at 4.22 ppm for R-NH2. It
worth to note that the NH proton signal of R-H is not visible, may be due to either its overlapping with aromatic protons or exchange with deuterium from DMSO‑d6.
In the 31P NMR spectra (Fig. AM2b), the appearance of a singlet for
R-COOH, R-NH2, and R-H, at δ = 16.00, 17.27 and 17.72 ppm,
respec-tively, confirms the formation of α-aminophosphonate moiety. These
assignments are consistent with values reported by Van der Veken et al.
[40]. The side peaks appearing around 31P NMR peaks are due to the
presence of impurities or insufficiently washed reagents (notably for R-H and R-COOH sorbents) and/or the presence of a chiral center (more specifically in the case of R-NH2 sorbent).
3.1.4. Thermal properties
The thermogravimetric analysis of the sorbents, under N2
atmo-sphere, is reported on Fig. AM3. The degradation profiles of R-H and R- NH2 sorbents are very similar; they are roughly constituted of three steps
occurring in the same range of temperature and representing approxi-mately the same weight losses. The first step represents the release of water absorbed at the surface of the sorbents; this step, occurring below 120–160 ◦C, corresponds to a weight loss of about 4–5%. The second
step in the thermal degradation process appears as a first wave and takes place between 120 ◦C and 160 ◦C and about 491–511 ◦C; weight loss
reaches about 63% for R-H and 59% for R-NH2 (total weight loss 68%
and 64%, respectively). This is associated to the degradation of terminal reactive groups (essentially phosphonic groups). Liu et al. [41] com-mented that the bonds in O = P-O are less stable than the C–C bond. This makes the phosphonic moiety more sensitive to thermal degradation than the remaining part of the sorbent. Actually in this degradation step, several poorly-resolved wavelets can be observed corresponding to the degradation of different reactive groups on the backbone of the polymer: specific changes in the slope of the degradation profile are observed at temperatures around 172 ◦C, 248 ◦C, 380 ◦C and 428 ◦C for R-H. For R-
NH2, these changes are observed at 241 ◦C, 299 ◦C, 328 ◦C, 370 ◦C and
480 ◦C. The last part in the process (above 440–460 ◦C) represents the
pyrolysis of the char [35]: the weight loss at 725 ◦C reaches 71.0% for R-
H and 67.7% for R-NH2.
R-COOH sorbent exhibits a significantly different trend in terms of degradation profile. The first step, below 135 ◦C, corresponds to water
release (about 4% weight loss, with a maximum at around 115 ◦C). In
the range 135–260 ◦C, the weight loss is close to 31% (total 35%, with a
transition centered on 182 ◦C). The third step (up to 515 ◦C) shows a
limited weight loss (16%, total weight loss close to 51%): the steeper slope in the degradation profile in this step is centered around 480 ◦C.
Finally, the char degradation above 515 ◦C shows a progressive weight
loss; at 725 ◦C, the total weight loss is close to 55.6%.
While the presence of amine groups does not change the degradation profile compared with the reference (non-substituted) material, the carboxylic groups substantially change the stability of the material. The first degradation front is observed at a lower temperature; although the weight loss is decreased. On the opposite hand, the second degradation front occurs approximately in the same temperature range but the weight loss is also slightly reduced. The carboxylate groups induces a lower temperature for the beginning of the degradation but contributes to stabilize the sorbent at higher temperatures: final weight loss does not exceed 55% at 725 ◦C while for the other sorbents (i.e., R-H and R-NH
2)
the weight loss increases up to 68–71%.
3.1.5. Differential light scattering (DLS) and zetametry
Fig. AM4 reports the DLS analysis of the three sorbents: the three materials have significantly different size profiles. R-H has a bi-modal distribution profile: a small amount of particles is centered around 350 nm, while the largest part of particles is centered above 531 nm; the average particle size is set at 577 nm. Other sorbents have narrower distribution of particle sizes (limited tail): R-COOH has an average particle size close to the value reported for R-H; at 614 nm. R-NH2 is
characterized by much lower particle sizes: the average size is close to 162 nm.
The zeta potential values at pH 4 are systematically negative and of the same order of magnitude for the three sorbents: − 21.5 ± 4.72 mV for
2000 2200 2400 2600 2800 3000 3200 3400 3600 3800 Tr an sm itt an ce ( % ) Wavenumber (cm-1)
R-NH
2 Raw U-Sorp. Aft 5 C 344 0 240 3 236 7 257 3 331 1 400 600 800 1000 1200 1400 1600 1800 2000 Tr an sm itt an ce ( %) Wavenumber (cm-1)R-NH
2 Raw U-Sorp. Aft 5 C 161 6 130 9 61 5 83 6 118 2 138 1 159 7 91 6 80 2 51 1 1507 148 7 936 69 1 451 194 4 190 7Fig. 2c. FTIR spectra of R-NH2 before (raw) and after U(VI) sorption (U-Sorp.) and after 5 cycles of sorption and desorption (Aft.5C).
±4.72 mV) can be explained by the presence of free carboxylic group that changes the surface properties of the sorbent: the -I withdrawing inductive effect of amino groups increases the density on the N-atom. On the opposite hand, in the case of R-NH2, the lower negative zeta
po-tential is caused by free amine group that has + I donating inductive effect of amino groups, which, in turn, increases the density on the N- atom. Obviously, the overall negative charge of the sorbent at pH 4 may attract cationic uranyl species.
3.1.6. Textural properties
Fig. AM5 summarizes the textural properties of synthesized resins: specific surface area (SBET) (Fig. AM5a) and pore size distribution
(Fig. AM5b). The SBET of R-H resin is close to 9.1 m2 g−1; the substitution
of carboxylic groups and amine groups during the synthesis of sorbents leads to a significant decrease of the SBET to 2.8 m2 g−1 for R-NH2 and
even less (i.e., 1.5 m2 g−1) for R-COOH. The –NH
2 and –COOH groups
contribute to increase the steric hindrance and limit the specific surface area of final material. It is noteworthy that the nitrogen adsorption/ desorption isotherms can be characterized by a “Type II” shape ac-cording Langmuir classification: the hysteresis loop is hardly detectable while comparing sorption and desorption curves. This type of isotherm is frequently associated with a wide distribution of pore sizes. Table AM3 shows that the pore volume decreases with –NH2 and COOH
functionalization; this is consistent with the discussion of specific sur-face area. Fig. AM5b shows the distribution of pore size for the three resins. The functional groups (i.e., –NH2 and –COOH) significantly
change the profile of pore distribution: the pore size is substantially decreased, especially for R-COOH (most of pores being lower in size than 10 nm). In the case of R-NH2, a first sharp peak of size is observed at 8
nm followed by a flat peak at 36 nm. These two sorbents can be roughly considered microporous. In the case of the R-H sorbent, a branch of pores (poorly resolved) is also observed at 36 nm completed by a very flat and large pore distribution peak (centered around 106 nm). Con-trary to –NH2 and –COOH functionalized sorbents, R-H material can be
qualified as a mesoporous sorbent.
3.1.7. pHPZC
The pH-drift method is used for the determination of the pHPZC and
the characterization of the acid-base properties of α-aminophosphonate-
based sorbents (R-H, R-COOH, and R-NH2) [3,25]. The pHPZC values of
the different sorbents were close to 4.75, 4.01 and 5.71 for R-H, R- COOH, and R-NH2 sorbents, respectively (Fig. AM6). The expected
chemical structures of the α-aminophosphonate derivatives (Scheme 2)
allow explaining these differences. The sorbent R-H (produced using aniline, the “simplest” aromatic amine) can be considered the reference material. While using anthranilic acid (o-aminobenzoic acid), the pHPZC
decreases from 4.75 to 4.01, due to the insertion of carboxylic acid moiety with pKa around 4 (or lower) [36,42]. In the case of o-phenylene
diamine (o-aromatic diamine), the insertion of amine groups brings additional basic sites that lead to a shift of the pHPZC from 4.75 to 5.71;
amine groups have high pKa values (9.21 for amino groups of ammonia
and primary amines [43]). This scaling in the values of pHPZC for the
three derivatives is consistent with the ranking of their zeta potentials at pH 4 (see above). These changes in the pHPZC confirm the effectiveness
of the synthesis of different aminophosphonate compounds whose properties are modulated by the inserted secondary reactive groups (i.e., amines or carboxylic groups).
It is noteworthy that the values of pHPZC are not consistent with the
zetametry measurements that showed negative charges for the three sorbents at pH 4. However, the two sets of characterization respect the ranking of charge/pHPZC.
3.2. Sorption properties 3.2.1. Effect of pH
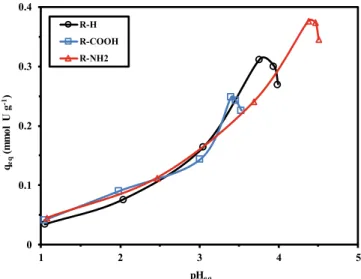
Designing metal sorption process requires optimizing the pH of sorption and more generally understanding the effect of this parameter on (a) the speciation of the metal (in function of the presence of ligands), and (b) the surface charge of the sorbent (protonation/deprotonation of reactive groups). Fig. 3 compares the effect of pHeq on U(VI) sorption
capacity for R-H, R-COOH and R-NH2, in the range 1–6. Above pH 5, the
formation of hydrocolloids species causes a partial precipitation of uranyl under the form of hydrolyzed species (i.e., UO2(OH)2⋅H2O). The three curves almost overlap up to pH 3: under selected experimental conditions, sorption capacity slightly increases from 0.045 mmol U g−1
to 0.14–0.16 mmol U g−1. Above pH 3, sorption capacity significantly
increases to reach a maximum that depends on the substitution of the sorbent. Indeed, for R-H, the maximum is reached at pHeq 3.76 and the
sorption capacity approaches 0.312 mmol U g−1. For R-COOH, the
maximum sorption decreases to 0.249 mmol U g−1 at pH 3.4, while for
R-NH2, the maximum sorption capacity (up to 0.377 mmol U g−1) is
achieved at higher pH (i.e., pHeq: 4.38). After reaching the optimum
pHeq value, the sorption capacity strictly decreases with pH
augmenta-tion. It is noteworthy that the shift in the optimum equilibrium pH value (pHopt.) is directly correlated to the pHPZC values: pHopt. = 1.05 + 0.58
pHPZC (R2: 0.994). The sorption capacity at optimum pH (qopt.pH) value
is also correlated to the pHPZC according: qopt.pH =0.128 pHPZC – 0.179. The superposition of the curves for the three sorbents, and the varia-tions, at the higher pH values, that are controlled by pHPZC, mean that
this is precisely the modulating acidity/basicity of the substitute that is controlling the sorption efficiency of the sorbent. The optimum pHs for the three sorbents correspond to the same initial pH value (i.e., pH0: 4).
This is the pH value selected for further experiments.
Actually, the ranking in optimum sorption capacities (qopt.pH) can be
also explained by the increase in the density of sorption groups in the case of R-NH2: the grafting of phenylene diamine allows increasing
amine groups at the surface of the sorbent (Table 1) and then the ca-pacity of the sorbent to bind more uranyl ions. The solution pH plays a key role in the sorption process since it affects the chemistry of both the sorbent and the sorbate (here U(VI) ions). On the opposite hand, in the case of R-COOH, the sorption capacity decreases due to several factors including steric hindrance, reported changes in the acid-base properties but also criteria such as affinity for target metal according the Hard and Soft Acid Base rules [13]. Indeed, uranyl is part of hard acids, which have higher affinity and reactivity for hard bases such as amine groups
0 0.1 0.2 0.3 0.4 1 2 3 4 5 qeq (mm ol U g -1) pHeq R-H R-COOH R-NH2
Fig. 3. Effect of pH on U(VI) sorption: sorption capacity versus initial pH. (C0: 0.210 mmol U L−1; T: 25 ◦C; SD: 0.5 g L−1; Time: 210 min; agitation speed: 200 rpm).
R-H, − 28.9 ± 4.12 mV for R-COOH and − 17.9 ± 3.79 mV for R-NH2.
intraparticle diffusion (RIDE, modelled by the Crank equation) may control uptake kinetics, in addition to resistance to film diffusion, but also by the proper reaction rate (under the control of hydration, pH effect on charge neutralization), modelled using the pseudo-first order rate equation (PFORE) and the pseudo-second order rate equation (PSORE) (Table AM1). Fig. 4 compares the fits of experimental profiles for the three sorbents with the three models. Table 2 reports the pa-rameters of these models (including the determination coefficients, R2);
the appropriateness of the model (PFORE vs. PSORE) is also measured comparing the experimental value of the equilibrium sorption capacities (qeq,exp) with the calculated values (qeq,1 or qeq,2). The determination
0 0.2 0.4 0.6 0.8 1 0 60 120 180 240 300 360 420 480 C (t) /Co Time (min) R-H R-COOH R-NH2 PFORE (a) 0 0.2 0.4 0.6 0.8 1 0 60 120 180 240 300 360 420 480 C (t) /Co Time (min) R-H R-COOH R-NH2 PSORE (b) 0 0.2 0.4 0.6 0.8 1 0 60 120 180 240 300 360 420 480 C (t) /Co Time (min) R-H R-COOH R-NH2 RIDE (c)
Fig. 4. Uptake kinetics for U(VI) sorption using R-H, R-COOH, and R-NH2 sorbents – Modeling with PFORE, PSORE and RIDE (pH0: 4.02; C0: 0.325 mmol U L−1; T: 25 ◦C; SD: 0.5 g L−1; agitation speed: 200 rpm).
(more than with carboxylic groups). The wide diversity of reactive groups held on the three sorbents may explain the overall affinity of these materials for uranyl species, through interactions with chelating agents bearing O, N, and P groups [3–5,10,12,16]. On the other hand, the lower sorption efficiency of R-COOH sorbent than R-NH2 and R-H,
may be explained by steric hindrance effects of the carboxylate group at the ortho-position (this may also affect the acid-base properties sorbent). The type of substituent controls the improvement or loss in sorption affinity (and sensitivity to pH). Chandrasekar et al. [39] investigated the extraction of uranyl nitrate (and actinides) using H-phosphonate-based extractants and demonstrate that the sorption mechanisms changes with the acidity: at weak acidity, uranyl was bound by ion-exchange through tautomerization effect on O = P- group of phosphonate while at higher acidity (>1 M HNO3) solvation was involved in metal extraction. They
highlighted the importance of weak-hydrogen bonding on the chemistry of uranyl coordination (though stabilization effects). This may contribute to modulate the sorption properties of the different substituents.
The distribution ratio (D: qeq/Ceq, L g− 1) is plotted against the
equilibrium pH (Fig. AM7). The log10 plot vs. pHeq is linear (before the
beginning of uranyl precipitation; i.e., for pHeq data ranging between 1
and 5). The slope of these linear curves ranges between 0.445 and 0.571. This means that uranyl binding may involve a stoichiometric proton exchange close to two protons/uranyl ion. This stoichiometric ratio can be related to the speciation diagram of uranyl in sulfate/sulfuric acid solutions (Fig. AM8). At pH 1, the neutral uranyl sulfate species (i.e., UO2SO4) predominates (65%) with the presence of free uranyl (about
21%) and anionic species (UO2(SO4)22–, for 14%). When the pH increases
up to 4, the fraction of uranyl progressively increases to reach about 73%, while anionic species disappear and uranyl sulfate decreases to 17%, some hydrolyzed species positively charged also appear (such as UO2(OH)+, (UO
2)2(OH)22+, and (UO2)3(OH)5+). This progressive increase
of divalent uranyl species is correlated to the increase in free uranyl concentration: Fig. AM9 superimposes the pH-sorption capacity curves with the distribution of uranyl species. Between pH 4 and pH 5 the fraction of free uranyl species strongly decreases, while hydrolyzed polynuclear species begin to appear: U(VI) sorption sharply decreases. Above pH 5, hydrolyzed polynuclear species predominate and uranyl begins to precipitate.
Fig. AM10 shows the pH variation after uranyl sorption. In the range pH 1-3, the equilibrium pH is not changed for R-H and R-COOH sor-bents: this is due to the neutral (R-H) or acid (R-COOH) behavior of the specific moiety inserted on the polymer. At pH 4, the pH is hardly affected for R-H (this may be correlated to its pHPZC value, close to 4),
while for R-COOH the pH tends to decrease by 0.6 pH unit). The case of R-NH2 (bearing weakly basic moiety) is substantially different: the
equilibrium pH increases with sorption by 0.4–0.7 pH unit in the range pH 2–4. The basic function binds protons, consistently with the pHPZC of
the sorbent. Above pH0 4, the equilibrium pH tends to decrease; this is
probably associated to the release of protons involved in uranyl binding. It is noteworthy that in the range pH 4–6, the equilibrium pH tends to stabilize around pHstab.: 3.5 for R-COOH, 4.0 for R-H and 4.5 for R-NH2.
This “buffering effect” is coherent with the acid-base properties of the sorbents: pHstab. = 1.179 + 0.585 pHPZC (R2: 0.994).
3.2.2. Uptake kinetics
The uptake kinetics are reported in Fig. 4. The three sorbents show similar kinetic profiles: the initial section (first 15–20 min of contact) is roughly superimposed for the different curves and the equilibrium is reached within 60–180 min. The initial section of the curve is usually associated with a mass transfer controlled by the resistance to film diffusion: the superimposition of the curves means that the sorbents are similar in terms of external diffusion. The equilibrium is reached a little faster (within 60 min) for R-COOH sorbent, while R-H and R-NH2
require 120 and 180 min, respectively (though >95% of total sorption is reached within 60 min for both R-H and RNH2). Resistance to
coefficients are of the same order of magnitude for the different systems and it is difficult finding a clear preference in the modeling of kinetic profiles on this unique criterion. The comparison of the equilibrium sorption capacities shows that the PFORE allows approaching closer to the experimental value than the PSORE: the Δqeq ranges between − 1.5%
and + 1% for PFORE while the PSORE overestimates qeq by 6–8 %. The
sorbents are synthesized as objects of irregular shape and the particle size was characterized by DLS. For the modeling of the resistance to intraparticle diffusion, the Crank equation was used, considering, as a first approximation, that the particles are roughly spherical. The RIDE fails to fit the time range corresponding to the highest curvature in the uptake profile (around 45–90 min). The effective diffusivity (Deff) ranges
between 0.18 × 10⁻¹⁰ m2 min−1 for R-NH
2 (the smallest particles and
slowest kinetics), 3.2 × 10⁻¹⁰ m2 min−1 for R-H and 6.7 × 10⁻¹⁰ m2
min−1 for R-COOH. These values are about 2 orders of magnitude lower
than the free diffusivity of uranyl in water (i.e., D0: 2.56 × 10⁻⁸ m2
min−1, [44]). This means that the resistance to intraparticle diffusion
plays a non-negligible effect on the control of mass transfer [45]. Despite the smallest size of R-NH2 sorbent (Fig. AM4), uranyl uptake is slower
than for the other sorbents; this is confirmed by the lowest value of effective diffusivity. Surprisingly, despite significant decrease in pore size for R-NH2 and R-COOH (compared with R-H), these materials do not
show slowdown in overall kinetics. This is another evidence that the resistance to intraparticle diffusion is not the critical step in the mass transfer.
As expected (after the study of pH effect), the sorption capacities at equilibrium follow the series: R-NH2 >R-H > R-COOH. The comparison
of the apparent rate coefficients (Table 2) shows that both k1 and k2 are
of the same order of magnitude for R-H and R-NH2, while the relevant
values are little higher for R-COOH. The substituent not only influences the affinity of the sorbent for uranyl (for controlling equilibrium dis-tribution of metal ions) but also affects the transfer kinetics.
The pseudo-second order rate equation is usually associated with chelation mechanism while the pseudo-first order rate equation is used for modeling physical sorption mechanism. Though a little preference may be given to the PFORE for fitting kinetic profiles, both of them give good fit of experimental profiles and it is thus difficult discriminating between the physical and the chemical interpretation of U(VI) uptake mechanism on the basis of the kinetic study.
3.2.3. Sorption isotherms and thermodynamic parameters
Sorption isotherms have been investigated at three temperatures (25 ◦C, 35 ◦C and 45 ◦C). Fig. 5 summarizes these data for R-H, RCOOH
and R-NH2. All these experimental profiles are characterized by a steep
initial slope (residual concentration being lower than 0.05 mmol U L−1)
followed by a progressive increase of sorption capacity, before reaching a saturation plateau. The steepness of the initial slope follows the sequence: R-NH2 >R-COOH ≈ R-H. The affinity of the sorbent for target
sorbate is correlated to this initial slope of the sorption isotherm: this means that R-NH2 has a stronger interaction with uranyl species at low
metal concentration. On the other hand, the comparison of saturation capacities shows a different trend: R-H > R-NH2 > R-COOH. This
ranking is also different from the order reported during the study of pH effect. At low U(VI) concentration (as used for the study of pH effect), the strong affinity of R-NH2 at low metal concentration (steeper initial
slope of isotherm) reverses the order of preference observed at the saturation plateau.
The sorbents show substantial differences while considering the ef-fect of the temperature. In the case of R-H and R-NH2, the sorption
ca-pacities slightly and continuously increase with the temperature from 1.057 to 1.1665 mmol U g−1, and from 0.746 to 0.803 mmol U g−1: their
sorption is endothermic. On the opposite hand, the sorption of uranyl on R-COOH is exothermic: the sorption capacity decreases from 0.535 to 0.499 mmol U g−1 with increasing the temperature.
The affinity (indicated by the initial slope) is more influenced by temperature for R-H than for R-COOH (and even more than for R-NH2).
Apparently, the ranking of sorbents, based on maximum sorption pacities is contradictory with the ranking in equilibrium sorption ca-pacities reported in the section “uptake kinetics”. Actually, the difference in the affinities of the sorbents (i.e., bL, proportional to the
initial slope of the isotherm curve) for U(VI) induces some differences in the ranking with the concentration range. At low metal concentration (i. e., 50 mg U L−1, the concentration used for uptake kinetics), the sorption
capacity of R-NH2 is higher than that of R-H.
Different effects may control the preference of uranyl ions for the different sorbents:
(a) The HSAB concept – Uranyl is considered a hard acid according Pearson’s rules; this means that the metal ion bind preferentially to li-gands bearing N ≫ P, O≫ S.
(b) Carboxylic groups are protonated at pH below 4, minimizing the electrostatic attraction effect.
(c) The electron-withdrawing/releasing effect affect the donating ability of phosphonate functional groups (negatively for carboxylic acid groups, positively for amine groups).
(d) The steric effect modulates the accessibility to reactive groups: bulky carboxylic groups cause stronger steric hindrance than for amine groups (and even more when comparing with R-H).
(e) The specific surface area is also controlling the reactive surface available for interaction with uranyl ions (R-H > R-NH2 >RCOOH).
The relative contribution of these different effects is difficult to establish. Hermann and Lukes [46] investigated the binding properties of a series of phosphonodipepetides bearing different functional groups for divalent cations. They reported the critical effects of deprotonation properties and the steric hindrance effect attached to the amino acid side chains. However, they also commented that the influence of these pa-rameters is modulated by the strong complexing ability of the
Table 2
Uptake kinetics for U(VI) sorption using R-H, R-COOH and R-NH2 sorbents – Model parameters for the PFORE, the PSORE and the RIDE.
Sorbent qeq,exp(mmol U g−1) PFORE
qeq,1 (mmol U g−1) k1 ×102 (min−1) R2 AIC
R-H 0.462 0.458 4.18 0.986 − 79
R-COOH 0.346 0.348 5.25 0.989 − 90
R-NH2 0.531 0.523 4.37 0.980 − 71
PSORE
qeq,1 (mmol U g−1) k2 ×102 (g mmol−1 min−1) R2 AIC
R-H 0.462 0.495 13.3 0.987 − 82
R-COOH 0.346 0.373 22.8 0.971 − 80
R-NH2 0.531 0.564 12.5 0.989 − 81
RIDE
Deff ×1010 (m2 min−1) R2 AIC
R-H 3.16 0.992 − 88
R-COOH 6.73 0.983 − 85
phosphonic groups (compared to the stronger effect observed with more conventional dipeptides).
The isotherms are fitted by the Langmuir equation (Fig. 5), the Sips equation (Fig. AM11) and the Temkin equation (Fig. AM12) (see Table AM1 for relevant equations). The Freundlich equation being a power-like function is not appropriate for fitting the asymptotic trend of isotherm profiles (the fits are not represented). Table 3 summarizes the
parameters of the Langmuir, Freundlich and Sips equations while the parameters for the Temkin equation are reported in Table 4. The Sips equation is derivated from the Langmuir equation by introducing a Freundlich-like exponential term. Adding a supplementary parameter introduces greater flexibility in the mathematical fir of experimental profiles; here, the determination coefficients are weakly improved and the exponential additional term is close to 1 for R-H and R-COOH showing that the Sips equation is not appropriate for fitting isotherm data. In the case of R-NH2, the exponential term increases from 1.24 to
3.3 with increasing temperature. Therefore, the introduction of the exponential term affects more significantly the simulation of experi-mental profiles at higher temperatures. Globally, the best fits are ob-tained with the Langmuir equation. This model suggests that solute sorption occurs through monolayer coverage with homogeneous energy distribution and finite number of identical sites (homogeneous interac-tion of reactive groups with target metals) homogeneously distributed over the sorbent surface and without interactions between sorbed mol-ecules [10,47]. The mathematical fit does not prove that the hypotheses of the model are fulfilled; this should be demonstrated by other physico- chemical characterizations. The value of RL, a dimensionless constant
defined by RL=(1 + bL Co) −1, is frequently used for evaluating the favorable character of the sorption process: when RL >1, the sorption is
favorable [3,47,48]. Here, for initial concentrations ranging between 0.105 and 1.3 mmol U g−1: the R
L coefficients decrease with
concen-tration from 0.57 to 0.095 for R-H, from 0.53 to 0.08 for R-COOH and from 0.46 to 0.06 for R-NH2. The value of RL is strictly inferior to 1: the
sorption is favorable and the favorability increases with metal concentration.
The Temkin isotherm assumes that the free energy of sorption is a function of the surface coverage [49,50]. Table 4 summarizes the values of Temkin parameters. The constant AT reflects the initial sorption heat:
the greater the AT value, the higher the sorption heat, and the greater the
affinity of the sorbent for the sorbate. The AT values for R-H and R-
COOH have the same order of magnitude (in the range 100–165 L mmol−1); although their variation is different: for R-H, A
T decreases
with increasing the temperature contrary to R-COOH. The AT value is
much higher for R-NH2 (increasing with temperature from 2714 to
almost 2900 L mmol−1). The much higher value of A
T can be correlating
with the very favorable sorption of uranium at low metal concentration for R-NH2 (quasi-irreversible profile at low metal concentration). The
energetic parameter (i.e., bT) increases according the sequence: R-H
(9.7–10.2 kJ mol−1) < R-COOH (21.3–22.9 kJ mol−1) < R-NH 2 (larger
variations between 24 and 32 kJ mol−1).
The thermodynamic parameters of sorption (including enthalpy change, ΔH◦, kJ mol−1; entropy change, ΔS◦, J mol−1 K−1; and Gibbs
free energy change, ΔG◦, kJ mol−1) are deduced from van’t Hoff
equa-tion using the normalized affinity coefficient of the Langmuir equaequa-tion (i.e., bL*) for the different temperatures and different sorbents (Table 3)
[3,48,51]: lnb*L=− ΔH ◦ R × T+ ΔS◦ R (1a) ΔG◦=ΔH◦− TΔS◦ (1b)
The normalization of bL takes into account the unit change (in L
mol−1) and the molar concentration of water to obtain the dimensionless
sorption constant [52].
Fig. 6 analyses the thermodynamic data and Table 5 summarizes the values of the relevant parameters. The endothermic behavior of U(VI) sorption on R-H and R-NH2 is confirmed by the positive value of its
enthalpy changes: the values are in the same range 17.3–19.8 kJ mol−1.
This behavior strongly contrasts with R-COOH sorbent that exhibits an exothermic behavior with the enthalpy change being negative (i.e., − 11 kJ mol−1). Actually, the overall enthalpy change (ΔH◦) is the balance
between the energies engaged in bond breaking (i.e., consumed energy = endothermic) and bond formation (i.e., released energy = 0 0.2 0.4 0.6 0.8 1 1.2 0 0.2 0.4 0.6 0.8 1 1.2 qm (mm ol U g -1) Ceq(mmol U L-1) T: 25 °C T: 35 °C T: 45 °C R-H Langmuir 0 0.2 0.4 0.6 0 0.2 0.4 0.6 0.8 1 1.2 qm (mm ol U g -1) Ceq(mmol U L-1) T: 25 °C T: 35 °C T: 45 °C R-COOH Langmuir 0 0.3 0.6 0.9 0 0.2 0.4 0.6 0.8 1 1.2 qm (mm ol U g -1) Ceq(mmol U L-1) T: 25 °C T: 35 °C T: 45 °C R-NH2 Langmuir
Fig. 5. U(VI) sorption isotherms using R-H, R-COOH, and R-NH2 sorbents at different temperatures – Modeling with the Langmuir equation (pH0: 4.07; time: 3 h; T: 25, 35, and 45 ◦C; SD: 0.5 g L−1).


![Table 6 compares the sorption properties of U(VI) for different sor- sor-bents. Some sorbents, such as phosphorylated graphene oxide/chitosan composite [5], functionalized layered-double-hydroxides composites [56], picolylamine functionalized resi](https://thumb-eu.123doks.com/thumbv2/123doknet/12294857.323579/13.892.54.835.110.257/properties-different-phosphorylated-functionalized-hydroxides-composites-picolylamine-functionalized.webp)

