Episodes of Non-employment among Immigrants to Canada from Developing Countries
34
0
0
Texte intégral
(2) CIRANO Le CIRANO est un organisme sans but lucratif constitué en vertu de la Loi des compagnies du Québec. Le financement de son infrastructure et de ses activités de recherche provient des cotisations de ses organisations-membres, d’une subvention d’infrastructure du Ministère de l'Enseignement supérieur, de la Recherche, de la Science et de la Technologie, de même que des subventions et mandats obtenus par ses équipes de recherche. CIRANO is a private non-profit organization incorporated under the Québec Companies Act. Its infrastructure and research activities are funded through fees paid by member organizations, an infrastructure grant from the Ministère de l'Enseignement supérieur, de la Recherche, de la Science et de la Technologie, and grants and research mandates obtained by its research teams. Les partenaires du CIRANO Partenaire majeur Ministère de l'Enseignement supérieur, de la Recherche, de la Science et de la Technologie Partenaires corporatifs Autorité des marchés financiers Banque de développement du Canada Banque du Canada Banque Laurentienne du Canada Banque Nationale du Canada Banque Scotia Bell Canada BMO Groupe financier Caisse de dépôt et placement du Québec Fédération des caisses Desjardins du Québec Financière Sun Life, Québec Gaz Métro Hydro-Québec Industrie Canada Investissements PSP Ministère des Finances et de l’Économie Power Corporation du Canada Rio Tinto Alcan State Street Global Advisors Transat A.T. Ville de Montréal Partenaires universitaires École Polytechnique de Montréal École de technologie supérieure (ÉTS) HEC Montréal Institut national de la recherche scientifique (INRS) McGill University Université Concordia Université de Montréal Université de Sherbrooke Université du Québec Université du Québec à Montréal Université Laval Le CIRANO collabore avec de nombreux centres et chaires de recherche universitaires dont on peut consulter la liste sur son site web. Les cahiers de la série scientifique (CS) visent à rendre accessibles des résultats de recherche effectuée au CIRANO afin de susciter échanges et commentaires. Ces cahiers sont écrits dans le style des publications scientifiques. Les idées et les opinions émises sont sous l’unique responsabilité des auteurs et ne représentent pas nécessairement les positions du CIRANO ou de ses partenaires. This paper presents research carried out at CIRANO and aims at encouraging discussion and comment. The observations and viewpoints expressed are the sole responsibility of the authors. They do not necessarily represent positions of CIRANO or its partners.. ISSN 2292-0838 (en ligne). Partenaire financier.
(3) Episodes of Non-employment among Immigrants to Canada from Developing Countries * Said Ahmed Aboubacar †, Nong Zhu ‡. Résumé/abstract À partir des données de l’Enquête sur la Dynamique du Travail et du Revenu (EDTR), nous analysons la situation des immigrants des pays en voie de développement au Canada en matière de non-emploi et leur situation par rapport aux immigrants des pays développés et personnes nées au Canada durant la période 1996-2006. Les méthodes utilisées nous ont permis de tirer la conclusion suivante : il existe des différences importantes entre les trois groupes au niveau de la mobilité dans le marché de l’emploi, la durée moyenne passée dans un épisode de non-emploi et les facteurs qui agissent sur la propension à sortir d’un épisode de non-emploi. Ces différences démontrent un désavantage particulier pour les immigrants originaires des pays en développement. En effet, ces derniers tendent à passer beaucoup plus de temps dans un épisode de non-emploi comparativement à leurs homologues immigrants issus des pays développés et les Canadiens de naissance. Mots clés : immigrants, marché de l’emploi, pays en voie de développement, Canada. Using data from the Survey of Labour and Income Dynamics (SLID) – we analyze nonemployment episodes for immigrants from developing countries and compare their situation to that of immigrants from more developed countries and Canadian-born individuals between 1996 and 2006. The methods used allowed us to draw the following conclusion: significant differences exist between these three groups in the labour market mobility, the average duration of a non-employment episode, and the factors that affect the propensity to exit from a non-employment episode. These differences demonstrate a particular disadvantage for immigrants from developing countries. In fact, they tend to spend more time in nonemployment episodes compared to their counterparts from the more developed countries and compared to Canadian-born individuals. Keywords: immigrants, labour market, developing countries, Canada.. *. This article was published in Canadian Studies in Population, 40(1–2), p. 9–22. Corresponding author: Concordia University, 1455 de Maisonnoeuve West, Room 1125-22, Montreal, QC H3J 1M8. Tel.: (514) 848-2424 Ext. 2117. Fax: (514) 848-4539. E-mail address: s.aboubacar@concordia.ca. ‡ INRS-UCS, University of Quebec. Nong.Zhu@UCS.INRS.Ca †.
(4) 1 Introduction. Since the adoption in Canada of the immigration policy based on the point system in 1967, the immigrant population has become increasingly diverse because of the rising proportion of individuals who immigrate from developing countries (DCs)i. In fact, according to the 2006 census, almost 80% of new immigrants originated from developing countries whereas in 1971, they only represented 24,3% of newcomers. The change in the place of origin of immigrants has contributed significantly to the increase in the proportion of visible minoritiesii in the country since 99% of immigrants from developing countries are visible minorities according to the 2006 census.. The study of this group of immigrants is of particular interest because, in the analysis, we exclude all visible minorities who came from more developed countries (MDCs), specifically those from the United States and from Europe. Previous studies on immigrant economic assimilation did not make this distinction and tend to consider immigrants who are members of visible minorities as a homogenous group in terms of their human capital. This is problematic because economic integration in the host country depends largely on where the human capital was acquired (Buzdugan and Halli, 2009). As Buzdagan and Halli argued, while certain immigrants from more developed countries see their skills acquired outside of Canada devalued, those belonging to a visible minority group, therefore those who came from developing countries, are faced with a much more serious problem because, often times, their degree is simply not recognized.. Therefore, this study attempts to make two significant contributions. First, it makes a distinction between immigrants from developing countries and those from more developed countries. 1.
(5) Second, it analyzes labour market assimilation through the use of three different indicators: mobility in the labour market, the average duration of a non-employment episode, and the propensity to exit from a non-employment episode. This seems to be a more adequate approach in the analysis of the economic integration of immigrants in host countries since individuals in situations of unemployment are taken into account, as opposed to most studies that use employment income as a basis for the analysis. In fact, often times, studies do not include those who dropped out of the labour market. Finally, this approach takes into account all of the nonemployment episodes, which is to be contrasted with the well-known approach of analyzing the access to the first employment after arrival. The use of these indicators will help answer the two following questions: (i) how do labour market mobility and the average duration of a nonemployment episode differ between immigrants and Canadians-born individuals? (ii) Does the propensity to exit from a non-employment episode vary according to the level of development of the country of origin? A response to the first question will help understand whether in fact, immigrants from developing countries change employment more or less often compared to their counterparts from more developed countries and individuals who are born in Canada. In the second question, we aim at understanding whether the level of development of the country of origin has any impact on the chances of exiting a non-employment episode.. In section 2, we present a review of the literature on the integration of immigrants from developing countries into the labour market. In section 3, we pay particular attention to the work that specifically analyzed the propensity for immigrants to find work. Section 4 presents the data and methods used. We present the results in section 5 and conclude in section 6.. 2.
(6) 2 The Integration of Immigrants from Developing Countries into the Labour Market A number of studies have already shown how the arrival of a massive number of immigrants from developing countries complicates the process of economic assimilation in Canada. Notably, they found that immigrants from developing countries tend to earn less compared to those who came from more developed countries and compared to Canadians-born individuals (Boyd, 1985; Li, 2000; 2001; Pendakur, 2000; Kazemipur and Halli, 2001; Buzdugan and Halli, 2009). The reasons for this poor economic performance are multifold. One is that immigrants from developing countries face more challenges in the Canadian labour market. For instance, in previous studies, it has been shown that the level of integration into the labour market depends on where the person’s degree was obtained. One such study is that of Buzdugan and Halli (2009) who found for example that, Canadian employers give more value to degrees earned in Western and Northern European countries, as well as in other developed regions and countries. This can be explained in part by the “selection” that Canadian employers do in the hiring process. According to the “selection theory”, Canadian employers do not value diplomas acquired outside of these developed countries because they may only reflect a nominal equivalence with Canadian degrees rather than being based on the equivalence of the skills required in the labour market. For immigrants from developing countries, this disqualification is accentuated for reasons pertaining to a perceived or real gap between the quality of education in Canada and in the developing countries. Boulet (2012) emphasizes specifically that the diplomas of male immigrants who are members of a visible minority are disqualified in 31,1% of the cases and those of female counterparts in 32,2% of the cases. This hypothesis also explains why work experience acquired outside of Canada is not recognized (Buzdugan and Halli, 2009).. 3.
(7) The split labour market theory also offers another explanation for the disqualification of the skills of new immigrants. This theory divides the labour market into two sectors. One is the primary sector where the career jobs, meaning those that offer good pay, employment security and excellent fringe benefits, are concentrated. The other is the secondary sector where precarious jobs with low wages, few or no employment benefits are concentrated. This sector is often reserved for new immigrants, (the majority of whom arrive from developing countries), regardless of their skill, in order to protect the economic interests of those who are born in the country.. Another possible explanation of the disqualification of the diplomas that new immigrants bring with them from home is the role played by the professional orders in the regulation of trades and professions. For example, Girard and Bauder (2005) explain that, upon their arrival in Canada, professional immigrants are confronted with the difficulty of being admitted into the corresponding professional order. Becoming a member of a professional order is a necessary step in accessing jobs in their area of training. The process is often long because, to qualify, one has to redo partly or entirely his or her studies in the host country. Thus, new immigrants are often forced to choose between accepting a job in the secondary sector or redoing their studies.. Many studies have also shown that the labour market assimilation of immigrants is closely linked to literacy (Green and Riddel, 2007; Dougherty, 2000). To better understand the differences in income between immigrants from developing countries and Canadians-born individuals, these studies suggest that it is necessary to take into account the observed differences between the two groups with respect to literacy. The work done by McMullen (2006) and Bonikowska et al. (2008) proved, for example, that differences between immigrants and Canadians-born individuals 4.
(8) exist in cognitive skills measured by the “understanding of narrative texts, the understanding of schematic texts, numeracy and problem solving.” In all four skills, immigrants generally scored lower compared to Canadian-born individuals. According to Bonikowska et al. (2008), these differences can be mainly attributed to how well immigrants master the language of the host country. The results of this study have also shown that the gap in cognitive test scores is wider between immigrants who completed their studies prior to their arrival and Canadian-born individuals, while it remains relatively low between those who studied in Canada and Canadianborn individuals.. The existence of a difference in literacy between immigrants and Canadian-born individuals is closely associated with the fact that new immigrants largely come from countries where the quality of education is significantly lower than in Canada. In the labour market, this difference translates into the observed difference in labour market performance between individuals holding the same educational degree. For example, in examining individuals holding an undergraduate degree, Sweetman (2004) has found that men from countries with a higher quality of education, notably, European countries, the United States and Japan, earn an average of 30% more than those from countries where the quality of education is the worst. Among women, the difference is around 25%. The literature demonstrates, therefore, that the level of development of the country of origin plays a significant role in determining the level of income of immigrants.. 3 Access to Work and Professional Mobility as Indicators of Economic Integration for Immigrants from Developing Countries While browsing the literature on the economic integration of immigrants, one quickly realizes that very little attention is paid to the behavior of immigrants who are unemployed or who find 5.
(9) themselves in any other kind of non-employment situation. In particular, we still do not know whether the duration of unemployment and non-employment episodes, as well as the propensity to find a job once unemployed is significantly different between immigrants and Canadian-born individual (Carrasco et al. 2008). These indicators help understand how immigrants, mainly those from developing countries, compare with Canadian-born individuals in the job search process. For example, by using the duration of non-employment episodes, we can answer the question of whether or not being a visible minority is a factor that prolongs the duration of a nonemployment episode. Nevertheless, it can be argued that longer non-employment spells for immigrants from developing countries are the result of several things. First, this could be associated with discriminatory practices in the labour market to the detriment of visible minorities groups. Second, this can be a reflection of the fact that immigrants from developing countries may voluntarily or involuntarily choose to withdraw from the labour market in order to acquire the required skills, often times by redoing their studies. Finally, the duration of a nonemployment episode could be determined, among other things, by the demographic characteristics and the individual human capital.. As demonstrated in a study by Schellenberg and Maheux (2007), the first objective of an immigrant upon his or her arrival is to find a job. Yet, this study reveals that, four years after their arrival to Canada, immigrants still believe that finding adequate employment is the greatest challenge they have to face. Respondents to the survey believe that this difficulty is tied to a certain number of factors, such as the non-familiarity with the Canadian labour market, the nonrecognition of their skills and work experience acquired abroad, the lack of employment opportunities, the lack of knowledge of the official languages, and discrimination.. 6.
(10) The studies that have used data from the Enquête sur l’Établissement des Nouveaux Immigrants au Québec (Panel Survey on the Settlement of New Immigrants in Quebec) or ENI have shown that immigrants from Western Europe and those from North America assimilate economically better than other immigrants groups. One of the advantages of the ENI is that it followed the respondents for a period of 10 years. The examination of a relatively long period has helped to assess whether economic disparities still exist between immigrants and Canadian-born individuals 10 years after their arrival, revealing, if it is the case, that there is discrimination or segmentation in the labour market. If, by contrast, the disparities have disappeared at the end of the period, this could confirm the hypothesis supporting the idea that the gap between immigrants and Canadian-born individuals in the labour market is a temporary phenomenon that is tied to the assimilation of the labour market conditions during the early years of the settlement, such as the acquisition of the Canadian experience, the accumulation of the necessary social capital and the adaptation of their human capital.. Nevertheless, it has been shown that, ten years after their arrival, the majority of immigrants still work in a field that is unrelated to their pre-migratory professional experience (Girard et al., 2008). Among those who occupy a position in the same field as the one before migration, the large majority of them were able to land the job in the first four years after their arrival. With regard to the factors affecting the probability of finding a job in the same field, certain individual characteristics, such as a high level of education, and pre-migratory work experience, the knowledge of the official languages and being a man, contribute significantly to the correspondence between pre and post migratory professional fields. The other important conclusion drawn from the ENI is that the region of origin is the most important factor that explains the performance of immigrants in the labour market. Thus, at different times during their 7.
(11) settlement, certain regions of origin affect employability and professional mobility more negatively than others. In fact, immigrants from the Sub-Saharan-Africa, North Africa and the Middle East face more difficulties in finding a job, which subsequently increases the economic disparities between these groups and Canadian-born individuals (Godin, 2008).. On a national scale, a large number of longitudinal studies on the labour market assimilation of immigrants are based on the Longitudinal Survey of Immigrants to Canada (LSIC). These studies have demonstrated that there is a significant difference between skilled and non-skilled workers in their labour market assimilation. This difference is mainly explained by demographic and human capital factors (Phythian et al., 2009). These studies also confirmed that the professional mobility of immigrants can be represented by a U shaped curve (Chiswick et al., 2005). According to this hypothesis, immigrants lower their professional aspirations upon arrival and occupy low skilled jobs. Meanwhile, they substantially increase their knowledge on the local labour market, develop the necessary social capital, and improve their human capital to better confront the obstacles they face in their job search. At the end of this process, immigrants are capable to climb the career ladder in the host country and to better position themselves in the job market.. 4 Data and Methodology We use data from the Survey of Labour and Income Dynamics (SLID) which is a longitudinal survey administered by Statistics Canada since 1993. Every three years, a new panel is introduced and follows respondents for a period of 6 years. Each panel contains approximately 17 000 households and 34 000 adults. Analyses are limited to those in panel 2 and 4 of the survey, corresponding respectively to the 1996 panel, which covers the period between 1996 and 8.
(12) 2002 and the 2002 panel, which covers the period between 2002 and 2006. As for panel 4, the last available observations at the time of the analysis were those of 2006. Therefore, the panel covers a five-year time span instead of six.. We considered respondents aged 15 or more and subdivided the sample of each panel into three sub-samples: one for Canadian-born individuals, another for immigrants from more developed countries, and the last for immigrants from developing countries. We obtained an initial sample of 23 055 individuals in the 1996 panel, of whom 20 408 were Canadian-born, 1 480 were immigrants from more developed countries and 1 167 were immigrants from developing countries. For the 2002 panel, the sample had 21 708 individuals, of whom 19 140 were Canadian-born, 1 215 were immigrants from more developed countries and 1 353 were immigrants from developing countries. The table in the Annex presents the descriptive results of the sample.. Three different methods of analysis were used. The first is a descriptive analysis comparing the frequency of non-employment episodes between the three sub-samples. This frequency was measured by the number of changes in state. The change could happen either from a state of nonemployment to a state of employment, which in this case means that the individual has found a job, or from a state of employment to a state of non-employment, which indicates that the individual has lost a job. In addition, a descriptive analysis compared the average duration of a non-employment episode in order to see the differences between the three groups. The duration of non-employment episodes was measured by the number of weeks elapsed since the day the respondent lost the job. All of the individuals for whom there was no starting date of the non-. 9.
(13) employment episode were excluded from the analysis. For a large majority of the resulting final sample, non-employment spells have matched with a period of unemployment.. With respect to the second method, we proceeded by doing a non-parametric analysis based on the hazard rate of exiting a non-employment episode. This rate was calculated for each group and it measures the propensity or the chances of exiting a non-employment episode given the elapsed time since the individual has lost the job. In other words, it determines the rate at which a person in a situation of non-employment can find a job. In this non-parametric analysis, we do not take into account the effect of exogenous variables. The hazard rate depends only on the duration of the unemployment spell.. In the third and last method, we estimated semi-parametric models of Cox for each sub-sample in the two panels. The model takes into account the effect of the diverse individual characteristics on the chances of the event occurring, specifically the chances of finding a job. Therefore, the dependent variable is the risk of exiting a non-employment episode, which takes the value of 1 when the person has employment and 0 otherwise. Similarly to the non-parametric method, the risk indicates the propensity of exiting a non-employment episode but, in this case, it takes into account the influence of explanatory variables.. The use of the two panels of the SLID, which cover a period of eleven years (1996-2006), also allows us to see the evolution of the changes on the situation of immigrants from developing countries as compared to the two other groups.. 10.
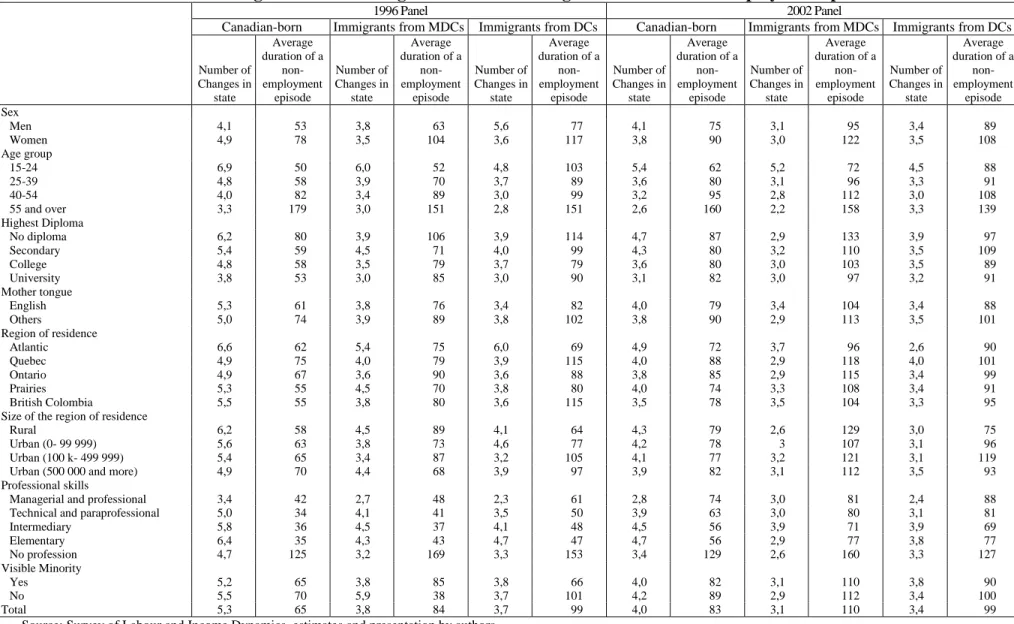
(14) 5 Results We present the results of the three above mentioned types of analysis, namely, the descriptive results on labour market mobility and the average duration of a non-employment episode, the non-parametric results on the propensity to exit a non-employment episode, and the semiparametric results, in which we take into account the different factors affecting the risk of exiting a non-employment episode.. 5.1 Labour Market Mobility Table 1 is a presentation of the average number of changes in state for the three groups according to certain characteristics of the respondents. First, it shows that Canadian-born individuals are more susceptible to change their employment situation. Indeed, their average number of changes in state was 5,3 and 4,0 respectively for the 1996 and the 2002 panels. In comparison, immigrants change their employment situation less frequently, given that in the first panel, the number of changes in state was 3,8 for immigrants from more developed countries and 3,7 for immigrants from developing countries. In the second panel, these averages were 3,1 for the first group and 3,4 for the second. Despite this decline, we cannot conclude that there is less mobility in the second panel because its time span covers a period of five years instead of six like in the 1996 panel.. (Insert Table 1 here). In addition, the table shows that labour market mobility tends to vary with the characteristics of the respondents. But, for both immigrant groups regardless of the characteristic, the average 11.
(15) number of changes of employment status is lower than that of Canadian-born individuals, with the exception of immigrant men from developing countries in the 1996 panel. For this group, the higher labour market mobility could be explained by the tendency of immigrant men belonging to a visible minority group to endure more severely the consequences of any economic fluctuation (Pendakur and Pendakur, 1998).. 5.2 The Average Duration of a Non-Employment Episode Table 1 also reveals that the average duration of a non-employment episode increased for Canadian-born individuals and immigrants from more developed countries while it stayed at the same level for immigrants from developing countries. In fact, the duration of a non-employment episode in the 1996 panel was 65 weeks, 84 weeks, and 99 weeks respectively for Canadian-born individuals, immigrants from more developed countries and immigrants from developing countries. In the 2002 panel, the duration was respectively estimated at 83 weeks, 110 weeks and 99 weeks. It is noteworthy mentioning the fact that, in the two panels, the average duration is generally longer for the two immigrant groups.. Moreover, the changes that we see in the 2002 panel differ depending on whether or not the immigrant came from a developed country. More precisely, the difference in the average duration of a non-employment episode between Canadian-born individuals and immigrants from more developed countries has expanded from 19 weeks in the first panel to 27 weeks in the second, in both cases in favor of Canadian-born individuals. By comparison, the difference in this average has significantly been reduced between Canadian-born individuals and immigrants from developing countries since it went from 33 weeks to 16 weeks. Results also show that, in the 2002 panel, as in the 1996 panel, for most of the individual characteristics, the average duration 12.
(16) of a non-employment episode was longer for immigrants. This translates into a more limited access to the labour market and this phenomenon affects mainly immigrants from developing countries. Note however that, in the 2002 panel, the decrease in the duration gap in a nonemployment episode between this group and Canadian-born individuals is due to an increase in the average duration for the latter group rather than an improvement of the situation of immigrants from developing countries.. 5.3 Non Parametric-Analysis: The hazard rates of exiting a non-employment episode for the three groups are presented in Chart 1 for the 1996-2002 period and in chart 2 for 2002-2006 period. First, we note that the shapes of the curves in the first chart differ from those that we see in the second. In fact, Chart 1 reveals that, for the three groups, the hazard rates increase very rapidly during the first 100 weeks. From this point to the 150th week, the fall gradually for all three groups. Up until the 250th week, the shape of the curve differed between the three groups. For Canadian-born individuals, the rates continued to fall while for immigrants from more developed countries, it increased slightly. Beyond the 250th week, the rates fell sharply for the three groups, thus indicating that it is more difficult to find work beyond this point, or that the individuals cease looking for work. By contrast, in chart 2, the rates increase until the 75th week and tend to decrease from this point on following an undulating shape marked by two periods of a slight increase. This suggests that, regardless of the group considered, the individuals in a situation of non-employment in the second panel obtained a job more rapidly at the beginning of the episode.. (Insert Charts 1 and 2 here). 13.
(17) In each of the panels, Canadian-born individuals had a higher propensity to exit from a nonemployment episode. Moreover, at any given time in the episode, immigrants from developing countries had more chance of finding a job than those from more developed countries. This is particularly revealing from the point of view of the split labour market theory since, as proponents have suggested, it is easier to find a job in the secondary sector where immigrants from developing countries tend to concentrate. According to Chart 1, from the 200th week, the difference between the two groups of immigrants disappears and we can even notice a slight advantage for immigrants from more developed countries. By contrast, Chart 2 suggests that the difference between the rates of the two immigrants groups has widened greatly in this panel and that it remained more or less stable throughout the episode. It is possible that the change that has occurred between the first and second panel in the macro-economic conditions and in the individual characteristics of the respondents acted in favour of the employment of immigrants from developing countries. For instance, between 2002 and 2006, the rate of unemployment in Canada remained at a historically low level.. 5.4 Semi-Parametric Analysis Table 2 presents the results of the estimated Cox’s models for the 1996 panel for all three groups and Table 3 for the 2002 panel. For Canadian-born individuals, with the exception of those who speak a language other than English, those who reside in cities of 100, 000 to 499 999 residents and those who reside in British Columbia, all independent variables tend to significantly affect the risk of exiting from a non-employment episode. By contrast, for the two groups of immigrants, the effects were significant only for certain variables and they changed from the first to the second panel. Nevertheless, we pay particular attention to the effect of the variables used in the selection of new immigrants, namely age, language, level of education and professional skills. 14.
(18) (Insert Tables 2 and 3 here). For immigrants from more developed countries, the estimated models for the two panels show that the effects of the variables “age” and “age squared” are significant. Because the coefficients of the variable “age” in both models are negative, and those for “age squared” are positive, it can be concluded that the chance of exiting a non-employment episode follows a “U” shaped curve. However, since the minimum risk is at a very advanced age (71 years, as opposed to 61 years for Canadian-born individuals for the 1996 panel, and 77 years, as opposed to 72 years, for the 2002 panel) one can interpret the relationship as negative. The reason is that, in general, the risk of returning back to the labour market is very low beyond these minimum points. For immigrants from developing countries, the estimated models show that the chances of finding a job do not depend on age for the 1996 panel. However, for the second panel, while age tends to affect the risk in a significant way, age squared seems to have a negligible effect. Therefore, for them, the risk declines with age and forms a downward and quasi-rectilinear pattern. In other words, the older an immigrant from a developing country is, the lower the risk of exiting from a nonemployment episode. It appears, therefore, that the effect of age on the risk varies only very slightly between the 3 groups and the disadvantage increases with age.. The differences between the three groups on the effect of the variable “mother tongue” are noticeable only on the 2002 panel. While it was not significant for all groups in the 1996 panel, it became significant for Canadian-born individuals and immigrants from more developed countries. But it remained non-significant for immigrants from developing countries for the 2002 panel. More specifically, in this panel, having a language other than English as a mother tongue 15.
(19) contributed to lowering the risk of exiting a non-employment episode for the first two groups. To some extent and in comparison with those who have other languages as a mother tongue, we can assert that having English as a mother tongue marginally increases the chances of finding employment for an immigrant from a developing country.. Similarly, in the 1996 panel, there are very few differences between Canadian-born individuals and immigrants from more developed countries on the effect of the variable “level of education”. In comparison with those who have no degree, and with the exception of immigrants from more developed countries who have a high school diploma, having a degree decreases the risk significantly. By contrast, among immigrants from developing countries, the risk does not vary substantially between the different levels of education. In other words, the possession of a degree had no significant effect on the risk between 1996 and 2002 for immigrants from developing countries. On the other hand, for the 2002-2006 periods, the differences between the groups have disappeared because, in each of the models, the possession of a degree reduced considerably the chances of finding a job for each group. In light of the more favourable economic conditions that prevailed in this period, this could signify that those who have a diploma in the two immigrant groups became more confident in their job search process, which allowed them, therefore, to wait for better employment opportunities.. The results in Table 2 and 3 also show that having a professional skill is an important factor in determining the risk of exiting a non-employment episode.iii For Canadian-born individual, being a professional reduces the risk significantly compared to those who have no specific skills. In fact, because of their more advanced specialization in training and because of the fact that the professional labour market is a more restricted market, for them, the chances of finding a job that 16.
(20) corresponds to their training remain very low. Still, for Canadian-born individuals, both at the intermediate and elementary level, the chances of finding a job increase considerably. The level of training for these two categories being less advanced than that of professionals, it corresponds more adequately to the requirements of the large majority of jobs created in the country and, consequently, it speeds up their recruitment. Among technicians and paraprofessionals, there is an increase in the risk in the first panel and a decrease in the second. The level of training of this category is mid-way between the professionals and the intermediate agents. Therefore, their chance of finding a job varies between those of these two categories.. For immigrants from more developed countries, the changes that occurred from the first to the second panel are even more substantial. First, while professionals in this group had an almost similar risk as that of the reference group in the first panel, they saw their risk decrease considerably in the second panel. As is the case of Canadian-born individuals, the level of specialization and the size of the labour market for professionals reduce the chances of finding a job compared to the reference group. Moreover, the declined risk for professionals between the two sub-periods indicates that there was a change in labour market conditions which negatively impacted their chances of finding a job. In addition, in comparison with the reference group, two other groups, “technicians and paraprofessionals” and “the intermediate agents”, had a lot more risk of exiting a non-employment episode in the first panel. However, these differences disappeared in 2002-2006. Finally, while the risk for “elementary agents and labourers” exceeds significantly the one for those with no professional skills in the first panel, it has declined significantly in the second panel. The comparison of the risks between these two periods allowed us to see that the chances of finding a job in the 2002 panel have diminished for all professional skill levels. But the risk remained somewhat positive and significant for the elementary agents, 17.
(21) which indicates that the jobs created during the second sub-period favours more the recruitment of people with little or no specific professional skills.. The patterns that we observed for immigrants from more developed countries are largely different from the ones that we see within the group of immigrants from developing countries. For instance, for the two periods, the professionals in this group experience a significantly lower risk compared to the reference group. Moreover, while no significant difference in the risk of finding a job exists between the category of “technicians and paraprofessionals” and those without professional skills in the 1996 panel, the relationship has become negative and significant in the 2002 panel. The last two categories, “intermediate agents” and “elementary agents and labourers”, have seen their chance of finding a job change from being significantly better in the 1996 panel , compared to the reference group, to being almost the same in the 2002 panel.. We learn, therefore, that a more specialized professional skill, particularly among professionals in both panels and among paraprofessionals in the 2002 panel, decreases the chances of exiting a non-employment episode and this is true for the three groups in question. Among the immigrants from developing countries, the situation deteriorated considerably between 2002 and 2006 because, contrary to the 1996-2002 periods, for them, no level of professional skill increased their chances of exiting a non-employment episode in any significant manner.. 6 Discussion and conclusion In trying to understand the situation of immigrants from developing countries in terms of nonemployment by comparing them with immigrants from more developed countries and people born in Canada we analyzed three different aspects of the integration of immigrants into the 18.
(22) labour market, namely, the frequency of non-employment episodes (or mobility in the labour market), the duration of time spent in a non-employment episode and the factors affecting the chances of exiting a non-employment episode. Data of two successive panels of the SLID was used in order to understand the changes that occurred between the 1996-2002 period and the 2002-2006 period, two periods that exhibit different labour market conditions.. A descriptive analysis of the number of changes in state allowed us to answer the first question. In fact, the results indicated that, during the two periods, immigrants changed jobs less frequently than Canadian-born individuals, particularly those from developing countries. Moreover, this group of immigrants seem to also change employment less frequently than immigrants from more developed countries. However, the average duration of a non-employment episode was longer for immigrants from developing countries. Therefore the results lead us to conclude, on the one hand, that immigrants from developing countries experience more limited labour market mobility since the average number of changes in state is generally lower for them. On the other hand, immigrants from developing countries have the largest average duration of non-employment episodes. The negative relationship between these two indicators reflects the need for immigrants from developing countries, to avoid changing their state when they are employed for fear of finding themselves in prolonged non-employment situation. This relationship is confirmed by Campolieti (2009) who reasoned that the longer the average duration of non-employment episodes, the more limited is the mobility in the labor market. However, it is important to highlight the fact that a longer average duration for this group can also be the result of any decision to voluntarily withdraw from the labour market. This is particularly true for those who lack the necessary skills or whose skills have been devalued upon their arrival in the host. 19.
(23) country. Likewise, greater mobility for Canadian-born individuals can be viewed as the direct outcome of the perceived or real advantage that this group feels in the labour market.. The non-parametric and semi-parametric analyses helped answer the second question. In fact, these analyses showed that, in general, Canadian-born individuals are able to find a job more quickly. But, a comparison between the two immigrant groups has revealed that those who came from developing countries have a much greater chance of finding a job, particularly during the 2002-2006 period. However, this finding must be interpreted with caution because the employment sector of the individual plays an important role in determining the probability of finding employment. Indeed, some studies have found that immigrants from developing countries tend to work in the secondary sector, where access to employment is easier (Girard and Bauder, 2007; Boulet 2012; Ogbuagu, 2012).. In addition, in the estimated Cox models, the effects of the independent variables on the chances of exiting a non-employment episode vary according to the group. For instance, with regard to the human capital variables, the differences between immigrants from developing countries and the two other groups are strikingly noticeable. In particular, having English as a mother tongue influences significantly the risk in the estimated models for Canadian-born individuals and immigrants from more developed countries. This variable, however, only contributes very marginally to the improvement of the chances of finding employment when the immigrant is from a developing country. This finding contrasts with what studies analyzing immigrants’ income have found. These studies have generally come to the conclusion that, knowing the official languages, particularly English, improves the level of immigrants’ income (Chiswick and Miller, 2007). Our results show, however, that the effect of language on the risk remains 20.
(24) negligible for immigrants from developing countries. Thus, it is possible that, for this group of immigrants, knowing English is an important factor in their economic integration only when the individual already holds a job, in which case salary gains can improve significantly. Moreover, the differences in the effects of professional skills are most apparent in the 2002 panel. Indeed, contrary to the two other groups, the professional skills of immigrants from developing countries do not appear to increase significantly the risk compared to those who do not have specific skills. By contrast, the level of education appears to have the same effects in all three groups.. The conclusions drawn in this study lead us to two important thoughts. The first has to do with the non-employment situation which, for some, could be voluntary and, for others, it could results from external pressures, particularly the pressure from the labour market. It can therefore be argued that immigrants from developing countries experience a longer average duration of nonemployment episode because of the fact they are more likely to withdraw voluntarily from the labour market, as is the case for those who decide to return to school after their arrival to Canada. The second thought has to do with the relationship between the type of employment sector (primary or secondary) and the chances of exiting a non-employment episode. It would be interesting to know whether this relationship is different between those immigrants who work in the primary sector and those who work in the secondary sector. A response to this last question would help explain why immigrants from developing countries generally have higher chances of exiting a non-employment episode than those from more developed countries.. References Bonikowska, A., D. A. Green and W. C. Riddel. 2008. Literacy and the Labour Market: Cognitive Skills and Immigrant Earnings. Statistics Canada, catalog number 89-552. 21.
(25) Boulet, Maude. 2012. The Degree of Professional Disqualification and Its Effect on the Employment Income of Female Immigrants Who Are Members of a Visible Minority in Quebec. Canadian Journal of Women and the Law 24: 53-81. Boyd, M. 1985. Ascription and Achievement: Studies in Mobility and Status Attainment in Canada. Ottawa: Carleton University Press. Buzdugan, R. and S. Halli. 2009. Canadian Immigrants with Focus on Foreign Education and Experience. International Migration Review 43(2):366-386. Campolieti, M. 2009. An analysis of unemployment incidence and duration: some new evidence from Canada. Working paper number 7, Canadian Labour Market and Skills Researcher Network. Carrasco, R. and J. I. G. Pérez. 2008. Unemployment Duration among Immigrants and Natives: Unobserved Heterogeneity in a Multi-Spell Duration Model. Working paper 08-69, Economic Series (33), Departemento de Economia, Universidad Carlos III de Madrid. Chiswick, B. R. and P. W. Miller. 2007. Matching Language Proficiency to Occupation: The Effect on Immigrants’ Earnings. Bonn: Institute for the Study for Labour, IZA Discussion Paper, number 2587. Chiswick, B. R., Y. L. Lee and P. W. Miller. 2005. A Longitudinal Analysis of Immigrant Occupational Mobility: A Test of the Immigrant Assimilation Hypothesis. International Migration Review 39(2): 332-353. Dougherty, C. 2000. Numeracy, literacy and earnings: evidence from the national longitudinal survey of youth. CEPDP, number 478, Centre for Economic Performance, London School of Economics and Political Science, London, UK.. 22.
(26) Girard, E. and H. Bauder. 2005. Barriers blocking the integration of foreign-trained immigrant professionals: Implications for smaller communities in Ontario. Department of Geography, University of Guelph. Girard, E. and Bauder, H. 2007. Assimilation and exclusion of foreign trained engineers in Canada: inside a professional regulatory organization. Antipode 39 (1): 35-53. Girard, M., M. Smith and J. Renaud. 2008. Economic Integration of New Immigrants: Suitability of Employment Occupied Prior to Arrival in Quebec and the Employment Occupied Since Immigration. Canadian Journal of Sociology 33(4): 791-814. Godin, J-F. 2008. Immigrant Economic Integration: A prospective Analysis over Ten Years of Settlement. International Migration 46(2):135-165. Green D. A. and W. C. Riddel. 2007. Literacy and the Labour Market: The Generation of Literacy and Its Impact on Earnings for Native Born Canadians. Statistics Canada, 89-552-MWF, Cat. No. 18. Kazemipur, A. and S. Halli. 2001. The Changing Colour of Poverty in Canada. Canadian Review of Sociology & Anthropology 38(2): 217-238. Li, P. S. 2000. Earnings Disparities between Immigrants and Native-Born Canadians. Canadian Review of Sociology and Anthropology 37(3): 289-311. Li, P. S. 2001. Immigrants' propensity to self-Employment: evidence from Canada. International Migration Review 35(4): 1106-1128. McMullen, K. 2006. Literacy Skills among Canada’s Immigrant Population. Statistics Canada, 2, 5. Catalogue No. 81-004-X1E. Ogbuagu, Buster C. 2012. Nice CV! You Will Hear From Us: Canadian Labor Market and the Phenomenology of the Marginalized Ethnic Professional Migrant. Journal of Social Sciences 8(1):1-12. 23.
(27) Pendakur, K. and R. Pendakur. 1998. The Colour of Money: Earnings Differentials among Ethnic Groups in Canada. The Canadian Journal of Economics 31(3): 518-548. Pendakur, R. 2000. Immigrants and the Labour Force: Policy, Regulation, and Impact. Montreal: McGill-Queen’s University Press. Phythian, K., D. Walters and P. Anisef. 2009. Entry Class and the Early Employment Experience of Immigrants in Canada. Canadian Studies in Population 36(3-4): 363-382. Schellenberg, G. and H. Maheux. 2007. Immigrants’ Perspectives on their First Four Years in Canada: Highlights from Three Waves of the Longitudinal Survey of Immigrants to Canada. Canadian Social Trends, Statistics Canada, Cat. No. 11-008. Sweetman, A. 2004. Immigrant Source Country Educational Quality and Canadian Labour Market Outcomes, Statistics Canada, Analytical Studies Branch Research Paper Series, No. 11F0019MIE – No. 234 catalogue.. 24.
(28) Annex Weighted Proportions of Respondents by Characteristics (%) Canadianborn Sex Men Women Age Groups 15-24 25-39 40-54 55 and above Highest diploma No diploma Secondary College University Mother tongue English French Other Region of residence Atlantic Quebec Ontario Prairies British Columbia Size of the area of residence Rural Urban (0-99 999) Urban (100 000- 499 999) Urban (500 000 and more) Professional skill Management and professional Technical and paraprofessional Intermediary Elementary No profession Visible minority No Yes. 1996 Panel Immigrants from DCs. Immigrants from MDCs. Canadianborn. 2002 Panel Immigrants from DCs. Immigrants from MDCs. 50,0 50,0. 49,7 50,3. 48,2 51,8. 50,3 49,7. 46,5 53,5. 47,7 52,3. 22,8 38,3 32,9 6,0. 8,1 30,5 46,4 15,0. 18,2 41,7 35,3 4,8. 22,8 34,2 35,8 7,2. 7,8 28,4 45,9 18,0. 15,7 39,8 38,4 6,2. 24,7 33,5 27,1 14,7. 23,1 30,0 26,4 20,5. 24,2 32,5 23,9 19,4. 19,1 32,3 30,7 17,8. 15,5 27,5 29,3 27,6. 16,7 31,1 24,0 28,3. 65,2 29,5 5,3. 39,5 2,8 57,7. 19,9 1,1 79. 65,5 27,6 6,9. 32,1 5,8 62,1. 14,9 1,6 83,5. 9,8 28,6 33,2 16,6 11,8. 1,9 11,1 59,4 13,4 14,3. 0,5 15,9 48 11,5 24,2. 9,5 27,6 33,6 17,9 11,5. 2,2 14,6 56 11 16,3. 0,5 13,4 54,7 11,8 19,6. 20,0 30,9 11,9 37,2. 10,0 19,8 11,5 58,7. 6,2 6,4 5,0 82,4. 20,8 25,6 13,7 40,0. 12,2 13,4 12,1 62,3. 1,9 4,4 6,2 87,5. 11,9 23,3 23,7 14,1 27,0. 14,4 25,7 20,7 13,2 26,0. 8,4 19,6 21,5 13,0 37,5. 11,5 23,6 23,0 13,8 28,2. 14,4 22,1 17,9 12,0 33,6. 8,8 14,2 24,2 13,1 39,7. 87,7 12,3. 90,1 9,9. 1,0 99,0. 83,1 16,9. 97,8 2,2. 7,3 92,7. 100,0. 100,0. 100,0. 100,0. 100,0. 100,0. Total number 20 408 1 480 1 167 19 140 Source: Survey of Labour and Income Dynamics, estimates and presentation by authors.. 1 215. 1 353. Total percent. 25.
(29) Tables and Charts Table 1: Average number of changes in state and average duration of a non-employment episode 1996 Panel Immigrants from MDCs. Immigrants from DCs. Average Average duration of a duration of a Number of nonNumber of nonChanges in employment Changes in employment state episode state episode. Average duration of a Number of nonChanges in employment state episode. Canadian-born. Sex Men Women Age group 15-24 25-39 40-54 55 and over Highest Diploma No diploma Secondary College University Mother tongue English Others Region of residence Atlantic Quebec Ontario Prairies British Colombia Size of the region of residence Rural Urban (0- 99 999) Urban (100 k- 499 999) Urban (500 000 and more) Professional skills Managerial and professional Technical and paraprofessional Intermediary Elementary No profession Visible Minority Yes No Total. 2002 Panel Immigrants from MDCs. Immigrants from DCs. Average Average duration of a duration of a Number of nonNumber of nonChanges in employment Changes in employment state episode state episode. Average duration of a Number of nonChanges in employment state episode. Canadian-born. 4,1 4,9. 53 78. 3,8 3,5. 63 104. 5,6 3,6. 77 117. 4,1 3,8. 75 90. 3,1 3,0. 95 122. 3,4 3,5. 89 108. 6,9 4,8 4,0 3,3. 50 58 82 179. 6,0 3,9 3,4 3,0. 52 70 89 151. 4,8 3,7 3,0 2,8. 103 89 99 151. 5,4 3,6 3,2 2,6. 62 80 95 160. 5,2 3,1 2,8 2,2. 72 96 112 158. 4,5 3,3 3,0 3,3. 88 91 108 139. 6,2 5,4 4,8 3,8. 80 59 58 53. 3,9 4,5 3,5 3,0. 106 71 79 85. 3,9 4,0 3,7 3,0. 114 99 79 90. 4,7 4,3 3,6 3,1. 87 80 80 82. 2,9 3,2 3,0 3,0. 133 110 103 97. 3,9 3,5 3,5 3,2. 97 109 89 91. 5,3 5,0. 61 74. 3,8 3,9. 76 89. 3,4 3,8. 82 102. 4,0 3,8. 79 90. 3,4 2,9. 104 113. 3,4 3,5. 88 101. 6,6 4,9 4,9 5,3 5,5. 62 75 67 55 55. 5,4 4,0 3,6 4,5 3,8. 75 79 90 70 80. 6,0 3,9 3,6 3,8 3,6. 69 115 88 80 115. 4,9 4,0 3,8 4,0 3,5. 72 88 85 74 78. 3,7 2,9 2,9 3,3 3,5. 96 118 115 108 104. 2,6 4,0 3,4 3,4 3,3. 90 101 99 91 95. 6,2 5,6 5,4 4,9. 58 63 65 70. 4,5 3,8 3,4 4,4. 89 73 87 68. 4,1 4,6 3,2 3,9. 64 77 105 97. 4,3 4,2 4,1 3,9. 79 78 77 82. 2,6 3 3,2 3,1. 129 107 121 112. 3,0 3,1 3,1 3,5. 75 96 119 93. 3,4 5,0 5,8 6,4 4,7. 42 34 36 35 125. 2,7 4,1 4,5 4,3 3,2. 48 41 37 43 169. 2,3 3,5 4,1 4,7 3,3. 61 50 48 47 153. 2,8 3,9 4,5 4,7 3,4. 74 63 56 56 129. 3,0 3,0 3,9 2,9 2,6. 81 80 71 77 160. 2,4 3,1 3,9 3,8 3,3. 88 81 69 77 127. 5,2 5,5 5,3. 65 70 65. 3,8 5,9 3,8. 85 38 84. 3,8 3,7 3,7. 66 101 99. 4,0 4,2 4,0. 82 89 83. 3,1 2,9 3,1. 110 112 110. 3,8 3,4 3,4. 90 100 99. Source: Survey of Labour and Income Dynamics, estimates and presentation by authors.. 26.
(30) Table 2: Semi-parametric models, 1996-2002 Dependant variable: risk of exiting a non-employment episode. Age Age squared Men (reference : Women) Mother tongue (reference : English) Highest diploma (reference : No diploma) Secondary College University Region of residence (reference : Quebec) Atlantic Ontario Prairies British Colombia Size of the region of residence (reference : Urban - 500 000 and more) Rural Urban (0 to 99 999) Urban (100 000 to 499 999) Professional skills (reference : no profession) Managerial and professional Technical and paraprofessional Intermediary Elementary. Canadian-born -0,086*** (-23,06) 0,070*** (13,07) 0,075*** (5,49) -0,034 (-1,52). Immigrants from MDCs -0,083*** (-4,74) 0,060*** (2,63) 0,144** (2,22) 0,104 (1,53). -0,065*** (-3,71) -0,099*** (-4,76) -0,250*** (-8,00). -0,032 (-0,37) -0,240** (-2,52) -0,237** (-2,06). 0,158*** -0,139*** -0,119*** -0,027. Immigrants from DCs -0,031 (-1,61) -0,001 (-0,04) 0,042 (0,61) 0,049 (0,54) -0,048 0,093 0,123. (-0,53) (0,87) (1,07). (5,82) (-5,11) (-4,19) (-0,78). 0,178 -0,042 0,018 0,079. (1,12) (-0,35) (0,13) (0,53). 0,522** -0,060 -0,053 -0,169. (2,42) (-0,51) (-0,42) (-1,33). 0,207*** (11,36) 0,055*** (2,98) 0,017 (0,74). 0,086 -0,033 0,022. (0,89) (-0,35) (0,20). 0,391*** 0,280** 0,132. (3,02) (2,18) (0,84). -0,010 0,230** 0,381*** 0,407***. (-0,07) (2,35) (4,04) (4,02). -0,383** 0,138 0,320*** 0,531***. (-2,21) (1,29) (3,32) (5,23). -0,101*** 0,166*** 0,367*** 0,411***. (-2,90) (7,44) (19,07) (19,89). Maximum log likelihood -215404,02 -7162,41 Number of people 20408 1480 Events 22268 1017 Number of observations 63598 3505 T-students are in parentheses. *** Significant at 0,01; ** Significant at 0,05; Significant at 0,10.. -5883,74 1167 859 2823. Source: Survey of Labour and Income Dynamics, estimates and presentation by authors.. 27.
(31) Table 3: Semi-parametric models, 2002-2006 Dependant variable: risk of exiting a non-employment episode. Age Age squared Men (reference : Women) Mother tongue (reference : English) Highest diploma (reference : No diploma) Secondary College University Region of residence (reference : Quebec) Atlantic Ontario Prairies British Colombia Size of the region of residence (reference : Urban - 500 000 and more) Rural Urban (0 to 99 999) Urban (100 000 to 499 999) Professional skills (reference : no profession) Managerial and professional Technical and paraprofessional Intermediary Elementary. Canadian-born -0,065*** (-16,74) 0,045*** (8,27) 0,071*** (4,38) -0,098*** (-3,53). Immigrants from MDCs -0,067*** (-3,31) 0,043* (1,66) 0,052 (0,63) -0165* (-1,94). Immigrants from DCs -0,032** (-1,97) 0,012 (0,52) 0,011 (0,17) -0,024 (-0,25). -0,222*** (-10,61) -0,275*** (-11,64) -0,484*** (-13,32). -0338*** (-2,96) -0,333*** (-2,98) -0,308** (-2,42). -0,294*** -0,272*** -0,191*. (-3,42) (-2,63) (-1,95). 0,193*** -0,133*** -0,117*** -0,127***. (5,68) (-3,97) (-3,40) (-2,98). 0,245 -0,109 -0,123 0,016. (1,27) (-0,78) (-0,74) (0,10). -0,130 -0,081 -0,111 -0,206*. (-0,49) (-0,77) (-0,92) (-1,70). 0,125*** (5,96) 0,046** (2,04) 0,022 (0,77). -0,200* -0,032 -0,133. (-1,68) (-0,26) (-0,85). -0,030 -0,014 -0,002. (-0,16) (-0,08) (-0,01). -0,319*** -0,055** 0,144*** 0,112***. -0,387** -0,187 0,158 0,294**. (-2,37) (-1,56) (1,44) (-2,13). -0,675*** -0,306** 0,051 0,030. (-3,77) (-2,59) (0,60) (0,31). (-7,39) (-2,21) (6,49) (4,63). Maximum log likelihood -153784,32 -4518,19 Number of people 19134 1215 Events 15848 648 Number of observations 52952 2732 T-students are in parentheses. *** Significant at 0,01; ** Significant at 0,05; Significant at 0,10.. -6976,80 1353 978 3486. Source: Survey of Labour and Income Dynamics, estimates and presentation by authors.. 28.
(32) .004 .003 .002. Hazard rates. .005. Chart 1: Hazard Rates for the 1996 Panel. 0. 100 200 Time elapsed since out of the labor market (weeks). 300. Canadian-born individuals Immigrants from developing countries Immigrants from developed countries. 29.
(33) .003 .002 .001. Hazard rates. .004. Chart 2: Hazard Rates for the 2002 Panel. 0. 50 100 150 200 Time elapsed since out of the labor market (weeks). 250. Canadian-born individuals Immigrants from developing countries Immigrants from developed countries. 30.
(34) i. We are using the nomenclature adopted by the United Nations which considers any. country other than Europe, Japan, Australia, New Zealand, United States and Canada, as a developing country. All developing countries have a smaller per capita income, a high rate of population growth, a high child mortality rate, a shorter life expectancy, a younger population, a high unemployment rate which pushes the youth to migrate to richer countries. ii. The definition of visible minorities that we are using correspond to the same definition. that we find in the Employment Equity Act. Visible minorities are any individuals other than Aboriginals, who are non-Caucasian in race or non-white in colour. They consist of Chinese, South Asian, Blacks, Filipinos, Latin-Americans, South East Asians, Arabs, Occidental Asians, Japanese, Koreans, other visible minorities and visible minorities of multiple origins. iii. The national classification of occupations distinguishes five levels of professional skills. indicated by the letters A, B, C, and D, and the number 0. Level 0 corresponds to positions at the management level. Level A, the professional level, designate those who hold positions that generally require university training; Level B, the technical level, designate those who hold a position requiring college training or an apprenticeship program; Level C, the intermediate level, designate those who hold a position that requires some kind of training at the high school level or any other specific trades training ; and finally, level D, the elementary level, designate those who hold a position requiring no training at all or training at the work place.. 31.
(35)
Figure
Documents relatifs
In a context of acute tensions over funding dedicated to international agricultural research, do- nors and policy-makers expect researchers and their institutions to increase
Main off-farm income sources and their contribution to overall income in the Surveyed Regions Sources: RuralStruc Surveys.. The relationship between
In this section, we show that the configuration graph of any CP-net is consistent with the configuration graph of the π-pref net without local indifference, based on the same
Chaque été, lors du pique-nique de ta Société fribourgeoise de Berne, il était des nôtres pour célébrer la messe dans l'aria du Chalet du Saucisson en-dessus d'Albeuve.. Vêtu
Figure 6: Averaged correlation results for source A between sparse identification using array S and calibration with respect to the random error in the microphone positioning..
A fill-and-spill structure placed at the top of the block marked 'Charge Input and Shift Register' is used to load each pixel of the image, converting the
These agencies were the De- partment of National Health and Wel- fare, the National Research Council (Division of Building Research), the Department of Northern
Figure 1 depicts the empirical hazard function based on the Kaplan-Meier estimators. Panel A shows the hazard function for the foreign and U.S-born individuals. The general pattern
