O
pen
A
rchive
T
oulouse
A
rchive
O
uverte (
OATAO
)
OATAO is an open access repository that collects the work of Toulouse researchers and makes it freely available over the web where possible.
This is an author -deposited version published in: http://oatao.univ-toulouse.fr/ Eprints ID: 4440
To link to this article: DOI:10.1016/j.pss.2010.09.021 URL:http://dx.doi.org/10.1016/j.pss.2010.09.021
To cite this version: GOUACHE Thibault, BRUNSKILL Christopher, SCOTT Gregory, GAO Yang, COSTE Pierre, GOURINAT Yves. Regolith simulant preparation methods for hardware testing. Planetary and Space Science, 2011, vol. 58, n° 14-15, pp. 1977-1984.
ISSN 0032-0633
Any correspondence concerning this service should be sent to the repository administrator:
Regolith simulant preparation methods for hardware
testing
Thibault P. Gouachea,b,∗, Christopher Brunskilla, Gregory P. Scottc, Yves Gourinatb, Pierre Costed, Yang Gaoa
aUniversity of Surrey, Surrey Space Centre, Guildford, GU2 7XH, United-Kingdom bUniversity of Toulouse, Institute Cl´ement Ader, ISAE/DMSM, Toulouse, 31055, France
cAstroTechnic Solutions, Springfield VA, 22152, USA dESA, ESTEC, TEC-MSM, 2200 AG, Noordwijk, The Netherlands
Abstract
To qualify hardware for space flight, great care is taken to replicate the environment encountered in space. Emphasis is focused on presenting the hardware with the most extreme conditions it might encounter during its mission lifetime. The same care should be taken when regolith simulants are prepared to test space system performance. Indeed, the manner a gran-ular material is prepared can have a very high influence on its mechanical properties and on the performance of the system interacting with it. Three regolith simulant preparation methods have been tested and are presented here (Rain, Pour, Vibrate). They should enable researchers and hardware developers to test their prototypes in controlled and repeatable conditions. The Pour and Vibrate techniques are robust but only allow reaching a given relative density. The Rain technique allows reaching a variety of relative densities but can be less robust if manually controlled.
Keywords: Regolith, Soil simulants, Density, Relative density, Preparation method
∗Corresponding author
Email address: [email protected]; [email protected] (Thibault P. Gouache)
1. Introduction
. Many studies focus on the influence of “environmental conditions” on space system performance. For instance the influence of ambient pressure and vac-uum on drilling performance and power requirements were studied in Zacny et al. (2004). It was shown that lower atmospheric pressure could facilitate the evacuation of drillings. In other studies it was shown that different com-binations of temperature and pressure could alter the friction between a drill bit and a drilled rock by modifying the stability of the layer of adsorbed water and the layer of oxides (Zacny and Cooper (2007)). The influence of gravity has regularly been studied. Its effect on bearing capacity was eval-uated empirically and numerically in Bui et al. (2009). The recently devel-oped Landing & Mobility Test Facility at DLR, German Aerospace Center, is equipped with a robotic arm to compensate the excess of gravity on Earth when compared to Martian or Lunar conditions (Witte et al. (2009)). The influence of temperature and vacuum on space system performance are not only studied, but also taken into account in hardware qualification (for in-stance, American Military Standard MIL-STD-810 or European Cooperation for Space Standardization ECSS-E-10-03A). In contrast very little emphasis is put on the influence of regolith simulant relative density.
. The surface of the Moon and Mars are covered by a layer of granular material (GM) called regolith. A GM can be compacted to different levels. It can be in a very aerated configuration with a high volume of voids compared to the volume of grains. It can be very compacted with a very low volume of voids compared to the volume of grains. Or it can be in any intermediate state. The degree of compaction of a GM is given by its relative density. It is considered 0 % if its density is at a minimum and 100 % if its density is at the maximum (Eq. 1). Rarely is a GM found at either of these extremes in nature. Some publications refer to regolith with the term soil. Seiferlin et al. (2008) have pointed out that this is not entirely correct since the term soil supposes important transformations due to biological activity but also uses soil to refer to regolith. In this article, soil is also used to designate regolith but this does not imply biological activity.
relative density = density − minimum density
. The influence of relative density on a granular material’s mechanical prop-erties has clearly been established. The effect of relative density on the results of sand compression tests is reported in Mahmood et al. (1976). The variation of internal angle of friction with relative density of five Martian soil simulants is illustrated in Perko et al. (2006). The mechanical prop-erties of SSC-1 and SSC-2 (Surrey Space Centre Mars Simulant-1 and -2, the regolith simulants used to test the preparation techniques in this paper, see 4.1) were investigated experimentally in Scott and Saaj (2009b). It was shown that relative density has an impact on their mechanical properties. In Mahmood et al. (1976), it was also observed that for a given relative den-sity achieved, the manner it is achieved affects the physical properties of the prepared GM. Indeed, vibration and pluviation techniques were used to ob-tain the same relative density of a well-sorted, medium grain size quartz and feldspar beach sand. The preparation manner was shown to affect the fabric (grain orientation) and influence the mechanical properties of the sand. . The successful exploration of Mars is believed to depend on our ability to predict performance of systems interacting with regoliths (Perko et al. (2006)). Recent publications have illustrated the impact of GM relative den-sity on space system performance. The Optical Probe for Regolith Analysis was inserted in JSC Mars-1 regolith simulant that had been prepared at two levels of density. After a few centimetres of penetration (10 cm) the force required to penetrate the simulant was orders of magnitude higher for the compacted JSC Mars-1 (El Shafie et al. (2009)). Static penetration tests in UK4 sand, another Martian regolith simulant, showed the influence of compaction on the penetration forces (Seiferlin et al. (2008)). The mobil-ity performance of rovers will also be effected by different relative densities of the regolith encountered (Brunskill and Lappas (2009)). It was shown empirically that the traction forces a legged-robot can generate depend on the relative density of the granular medium (Scott and Saaj (2009a); Scott (2009)). Experimental works have showed that the performance of the bio-inspired dual-reciprocating planetary drill is highly influenced by the relative density of the excavated regolith simulant (Gouache et al. (2009)).
. To enable hardware developers and researchers to take into account this effect, robust sample preparation techniques must be developed. This article will expose three different soil preparation techniques, their advantages and drawbacks.
2. Challenges and advantages of repeatable granular soil prepara-tion techniques
. The difficulty of preparing Granular Materials (GM) in a repeatable and robust manner has been acknowledged. In Okamoto and Fityus (2006), it was shown that low relative density samples are hard to create in a repeatable manner. Moreover the compaction process of GM is not precisely understood and modelled because of complex relaxation processes Knight et al. (1995). Convection and segregation of particles can also be observed when a GM is compacted through vibration Knight et al. (1993); Ehrichs et al. (1998). Once compacted, a GM’s density can oscillate around a dense state when subject to continued vibrations (Nowak et al. (1998)).
. Despite these difficulties, it is worthwhile developing methods allowing soil preparation with sufficient consistency. Indeed such methods would allow different hardware solutions to be tested in similar conditions. This would facilitate system performance comparison. In Mahmood et al. (1976), authors conclude on the need to specify relative density and preparation method of granular materials in standardized tests. Additionally, tests conducted with carefully prepared regolith simulants can be used to calibrate numerical simulations or develop analytical models.
. Moreover being able to control soil properties through relative density and testing hardware in precisely controlled conditions allows the calibration of the system. This transforms a “purely functional space sub-system” (a drill or a locomotion system for instance) into a “scientific sub-system” (a soil mechanics instrument). This generally increases the scientific return of the mission. This was done with the Rock Abrasion Tool on the NASA Mars Exploration Rovers. By comparing the energy necessary to grind Martian rocks and the energy needed during benchmark tests done on Earth, it was determined that Martian rocks are analogue to a range of Earth rocks from low strength basalts to gypsum (for grindability) in Myrick et al. (2004). The Viking Lander 2 robotic arm was used to displace rocks in order to gain access to the regolith under them. By analyzing the forces developed by the robotic arm during these operations, the mass of each displaced rock was evaluated (Thomson et al. (2008)).
. Finally, having different reference regolith simulant preparation techniques allows a more robust qualification process. It will be possible to test and
qualify planetary systems interacting with regolith in a larger number of conditions. Or it will be possible to identify one soil condition as “the most challenging scenario” and apply the corresponding preparation method for the qualification test.
3. Proposed regolith preparation techniques
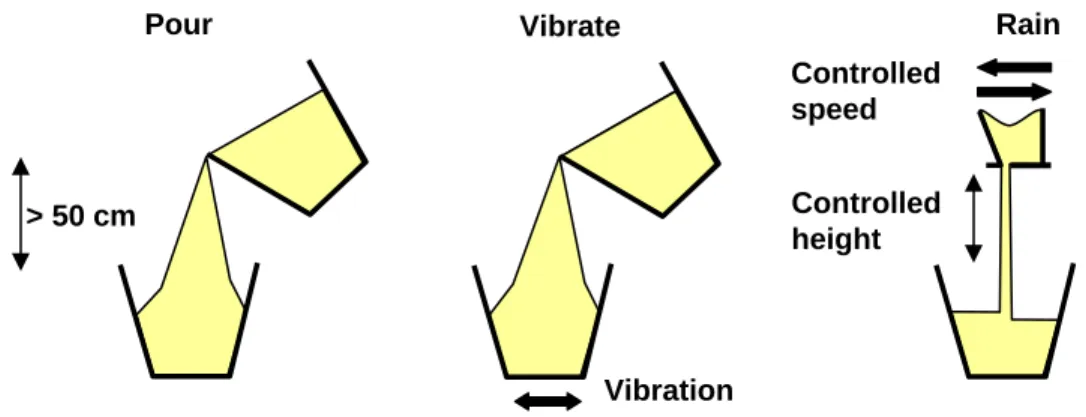
. The three techniques investigated in this publication are presented. Figure 1 is a schematic of these three techniques.
Pour > 50 cm Controlled height Vibration Controlled speed Vibrate Rain
Figure 1: The three Granular Material (GM) preparation techniques explored in this publication: Pour (from a height above 50 cm), Vibrate (while pouring the GM in con-tainer) and Rain (a curtain of GM is deposited by layers from a controlled height and at a controlled speed).
3.1. Rain
. A variety of raining or pluviation techniques have been investigated in other publications (Bica (1991)). Their common point is that the GM is deposited into the substrate container in the same manner rain would fill a bucket. In the tests presented here, we have used the curtain raining technique. In this method, a hopper with a slit in its bottom is filled with sand and a “curtain” of falling GM is created. The hopper is moved back and forth across the substrate container. Each pass of the hopper deposits a layer of GM in the substrate container. The size of the slit in the hopper, the height of the hopper and the speed of the hopper must be controlled. The flow of GM in the hopper used in this publication was generated only by gravity and not by more complex systems (like an air activated system in Bica (1991)).
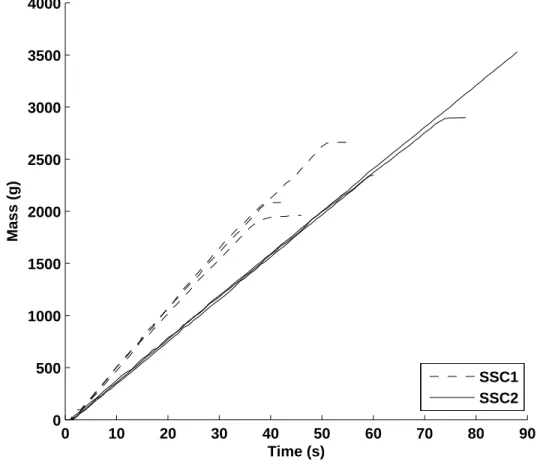
. A fixed slit width was used for all the tests reported here (5 mm). The flow rate of the two soils tested in this paper (SSC-1 and SSC-2, see 4.1) out of the hopper with a 5 mm slit was evaluated. The hopper was filled and placed above a scale. An automatic image acquisition system (1 Hz frequency) monitored the mass accumulation on the scale. Each soil simulant was rained three times on the scale. Figure 2 presents the accumulated mass versus time for all the performed runs and Table 1 presents the flow rates obtained. 0 10 20 30 40 50 60 70 80 90 0 500 1000 1500 2000 2500 3000 3500 4000 Time (s) Mass (g) SSC1 SSC2
Figure 2: Graph of cumulative mass obtained when raining SSC-1 and SSC-2 regolith simulants from the hopper.
SSC-1 SSC-2 Mean flow rate (g/s) 55.12 40.54 Standard deviation (g/s) 1.79 0.69
Table 1: SSC-1 and SSC-2 flow rate out of the hopper.
3.2. Pour
. The GM is poured directly into the substrate container from a bucket. When the sand is poured into its final container, it is first accelerated during its free-fall. As it accelerates, turbulence appears, mixing sand and air. To enable the sand to accelerate sufficiently (approaching its terminal velocity) and to allow the turbulence to fully develop a minimum pouring height is required. In Okamoto and Fityus (2006), it is reported that sand fall heights above 50 cm have no influence on the density of the prepared sample. First tests confirmed this and a pouring height of 50 cm was chosen.
3.3. Vibrate
. The GM is poured into the substrate container that is being vibrated. The vibrations compact the sand as it is poured into the container. No specific constraints were put on the manner the sand is poured and the duration of the vibration. The only constraint in this method is to pour the sand into a vibrating container. Here the vibrations were stopped immediately after pouring. The containers were vibrated by an Endecotts sieve shaker (rough order of magnitude of amplitude and frequency of vibrations are 1 cm and 5 Hz).
4. Test procedures 4.1. Soils tested
. The three different methods presented here were used to prepare two Mar-tian regolith simulants available at the Surrey Space Centre (SSC): SSC Mars Simulant-1 (SSC-1) and SSC Mars Simulant-2 (SSC-2). SSC-1 is a medium grained quartz sand (particle size from 1.3 mm to 63 µm and some silt) and SSC-2 is a fine grained garnet sand (particle size from 90 µm to less than 45 µm) (Scott and Saaj (2009b)).
4.2. Minimum and maximum density determination
. To establish the relative density of a granular material, the minimum and maximum density must be known. The minimum density of 1 and SSC-2 was determined by following the ASTM D4SSC-254-00 standards in ASTM (2000) (obtained by turning up and down a contianer half full of the granular material). The maximum density of SSC-1 and SSC-2 is given by estimation in Scott and Saaj (2009b) (5 % above the maximum observed density after compaction by pressure on top of the sample). The values obtained are reported in Table 2.
Simulant Maximum density (kg/m3) Minimum density (kg/m3)
SSC-1 1794 1383
SSC-2 2503 1948
Table 2: Minimum and maximum density of SSC-1 and SSC-2.
4.3. Volumetric density and volumetric relative density evaluation
. To determine the density obtained by a given preparation method, the two regolith simulants were prepared in substrate containers of known mass and volume. After completely filling the container and clearing the excess mate-rial, the mass of the container filled with regolith simulant was evaluated. The mass measurements of the empty and full container and the measurement of the container volume allowed to calculate the density of the prepared SSC-1 or SSC-2. Densities obtained in such a manner will be referred to as Vol-umetric Density (VD) and VolVol-umetric Relative Density (VRD) throughout this paper. Three cylindrical Containers (C) were used for this evaluation: a metal bin of 14.5 L (height of 29 cm and diameter of 25 cm) named C-1, a 13.5 L plastic bin (height of 27 cm and diameter of 25 cm) named C-2 and a transparent 245 mL glass (height of 155 mm and diameter of 45 mm) named C-3.
4.4. In-situ density and relative density evaluation
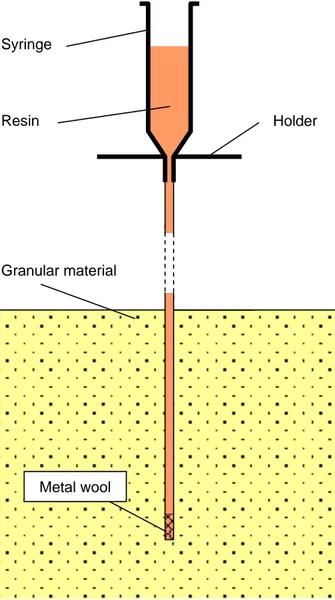
. The main difficulty in GM local density evaluation is sample disruption. Because GMs do not have a fixed structure, most sampling techniques will change the arrangements of the grains and modify the density. However, previous testing of one method showed it had negligible effect on the grain arrangement in a sample - the resin impregnation technique (Bica (1991)).
. In the resin impregnation technique an epoxy resin was injected through a 2.1 mm diameter needle (1.6 mm inner diameter) into a prepared GM sample. As can be seen in Fig. 3, the needle and syringe are placed in the prepared GM. The tip of the needle is filled with metal wool to prevent grains from penetrating the needle and blocking the resin flow. The resin is then poured in the syringe and allowed to flow unaided down the needle and into the GM. Such a resin was chosen because it has very little volume changes during the curing process and thus causes minimal disruption to the prepared GM (Bica (1991); Clayton et al. (1994)). Once cured, the resin is hard and it can be taken out of the GM sample. Resin spheres are thus obtained. The mass of sand in the resin sphere is obtained by subtracting the mass of resin impregnated. The volume of the sphere is obtained by measuring the Archimedes force on the resin sphere when it is fully submerged in water. The in-situ density is then measured by dividing sand mass by sphere volume. By using formula 1, the in-situ relative density is obtained.
5. Results
5.1. Volumetric relative density
. The Pour and Vibrate techniques were used to prepare samples of SSC-1 and of SSC-2 in the SSC-14.5 L metal cylindrical container (C-SSC-1) by a first Operator (Op) named Op-1. The mean and standard deviation of the VRD data set obtained for each soil simulant and each technique are presented in the second column of Table 3 (Op-1 C-1).
. The Vibrate and Pour procedures are simple and can be done manually. In order to assess the robustness of these protocols to different operators and interpretations, new samples of SSC-1 and SSC-2 were prepared by a different operator (Op-2) using the vibrate and pour protocols. The data collected is presented in the third column of Table 3 (Op-2 C-1). This operator was also asked to prepare vibrated samples in the 13.5 L plastic container (C-2) to assess the influence of the container nature on the vibrate technique The data is presented in the fifth column of Table 3 (Op-2 C-2). The differences in mean VRD obtained after changing operator and changing container nature are also reported in Table 3 (columns ∆ Op and ∆ C).
. The Pour and Vibrate techniques were also used to prepare samples of SSC-1 and of SSC-2 in a 245 mL transparent cylindrical container by the
Resin Holder
Granular material
Metal wool Syringe
Figure 3: Schematic of resin impregnation set-up with needle placed in the granular ma-terial and filled with resin.
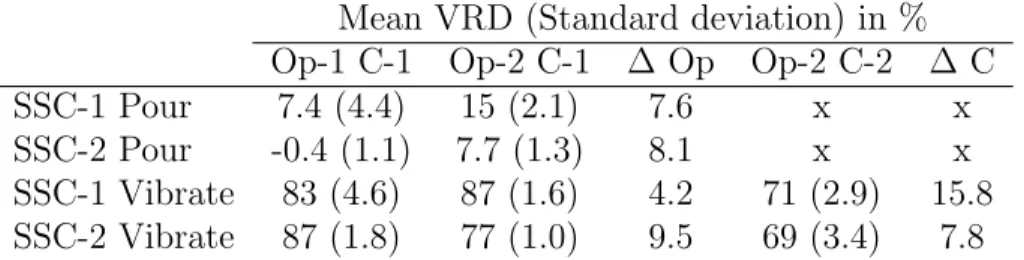
Mean VRD (Standard deviation) in % Op-1 C-1 Op-2 C-1 ∆ Op Op-2 C-2 ∆ C SSC-1 Pour 7.4 (4.4) 15 (2.1) 7.6 x x SSC-2 Pour -0.4 (1.1) 7.7 (1.3) 8.1 x x SSC-1 Vibrate 83 (4.6) 87 (1.6) 4.2 71 (2.9) 15.8 SSC-2 Vibrate 87 (1.8) 77 (1.0) 9.5 69 (3.4) 7.8
Table 3: Mean value and standard deviation of Volumetric Relative Density (VRD) data sets measured after using Pour or Vibrate preparation techniques on SSC-1 and SSC-2. Two different Operators (Op-1 and Op-2) and two different containers (C-1 and C-2) were used. C-1 is the 14.5 L metal container and C-2 is the 13.5 L plastic one. Each data series is named after the operator and the container used. ∆ Op is the difference between data series Op-1 C-1 and Op-2 C-1 (only the operator has changed from one to another). ∆ C is the difference between Op-2 C-1 and Op-2 C-2 (only the nature of the container has changed). x represents experiments that were not conducted.
first operator. The mean and standard deviation of the VRD data set for each soil simulant and each preparation technique are presented in the second column of Table 4 under Op-1 C-3. To illustrate the influence of using a much smaller container, the difference between this data series and Op-1 C-1 is presented in the third column (∆) of Table 4.
Mean VRD (Standard deviation) in %
Op-1 C-3 ∆
SSC-1 Pour -0.3 (0.9) 7.7 SSC-2 Pour -1.7 (0.9) 1.3 SSC-1 Vibrate 64 (1.3) 19 SSC-2 Vibrate 60 (3.5) 17
Table 4: Mean value and standard deviation of Volumetric Relative Density (VRD) data set measured after using Pour or Vibrate preparation techniques on SSC-1 and SSC-2 to fill a 245 mL cylindrical container (C-3) by first operator (Op-1). The difference with data series Op-1 C-1, Table 3, is reported in column ∆.
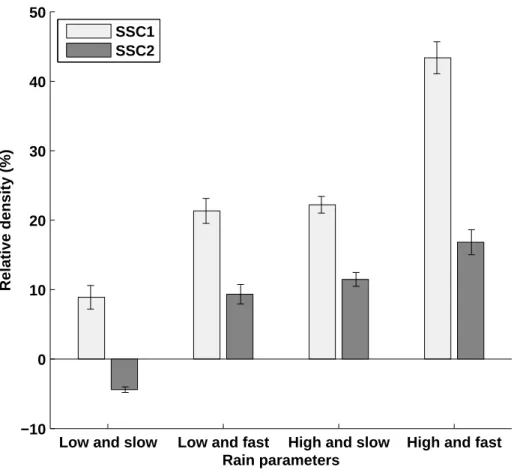
. Previous works have shown the influence of lateral speed of hopper and raining height on the final relative density achieved (Okamoto and Fityus (2006); Scott (2009)). A series of tests were thus lead to systematically assess
the VRD achieved with the Rain method depending on hopper speed and raining height. The Rain technique was used to fill the 245 mL transparent cylindrical container (C-3). Two heights, low and high (respectively 3 cm above container top and 23 cm above container height), and two hopper speeds, slow and fast (24 and 72 sweeps per minute) were chosen. Three to four runs for each soil simulant in each raining configuration were conducted. The mean value of the VRD data sets obtained are presented Fig. 4 with its standard deviation as error bars.
Low and slow Low and fast High and slow High and fast −10 0 10 20 30 40 50 Rain parameters Relative density (%) SSC1 SSC2
Figure 4: Mean value of volumetric relative density data set measured after using Rain preparation techniques on SSC-1 and SSC-2 to fill a 245 mL cylindrical container. The speed of hopper and height of hopper were varied.
. Negative relative densities have been reported here. This has also been observed by other authors (Perko et al. (2006)). It is clearly indicated in the ASTM D 4254-00 minimum density test description that the ASTM minimum density test does not insure an absolute minimum density (ASTM (2000)). Thus a lower density may be reached, which then corresponds to the negative relative density found in the results above.
5.2. In-situ density
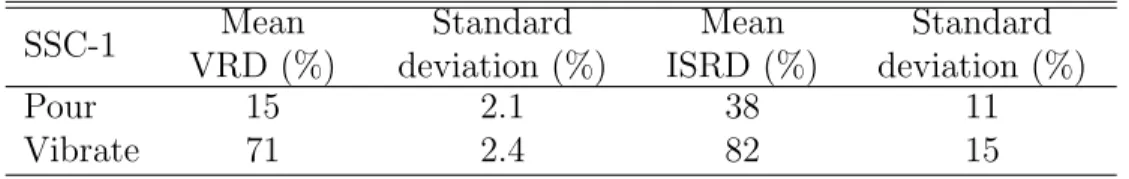
. A series of SSC-1 samples prepared in C-2 with the Vibrate and Pour techniques were impregnated with resin. The mean and standard deviation of the VRD and in-situ relative density obtained are presented in Table 5.
SSC-1 Mean VRD (%) Standard deviation (%) Mean ISRD (%) Standard deviation (%) Pour 15 2.1 38 11 Vibrate 71 2.4 82 15
Table 5: Mean value and standard deviation of Volumetric Relative Density (VRD) and In-situ Relative Density (ISRD) measured after using Pour or Vibrate preparation techniques with SSC-1 in the 13.5 L container (C-3).
. The in-situ relative density is higher than the VRD obtained. The differ-ence is higher in the poured case (+23%) than in the vibrated case (+14%). The higher value of the in-situ relative density could in part be explained by compaction under self weight in the sample. This would also explain why the difference is higher in the low density sample than in the high density sample. Indeed a low density sample will present a more important density gradient with depth than a compacted sample. However it is likely that a part of the difference is due to a bias between the two evaluation methods. The standard deviation of the in-situ relative density is also much higher than the one for the VRD. Indeed, the in-situ density evaluation requires many more measurements than the VD. Measurement errors on the amount of resin impregnated may in part explain this higher dispersion of densities obtained. The determination of resin sphere volumes must be done with great care and can be influenced by the resin sphere absorption of water (though the sphere is coated with resin to limit this effect). Moreover some
in-situ density evaluations allowed only a few grams of resin to be impreg-nated in the sand (due to potential clogging of needle by grains of material). The smaller the resin sphere, the more sensitive the in-situ density value ob-tained is to the errors described above. For the data presented in Table 5, all tests injecting less then 10 g of resin were discarded. If this threshold is set to 20 g of impregnated resin, the mean in-situ relative density obtained for vibrated SSC-1 is closer to the VRD value in Table 5. (76% compared to 71%) and the standard deviation is much smaller (3.7% compared to 14%).
6. Evaluation of preparation techniques 6.1. Different densities achieved
. Samples prepared with the Vibrate technique and the Pour technique have two very distinct relative densities: very low values for pouring (around 10%) and very high values for vibrating (around 80%). These two techniques allow soils to be prepared at two very different and extreme levels of relative density and are thus a very good manner of testing hardware in two different conditions for the same GM. The Rain technique allows to reach a wider variety of densities than the Pour and Vibrate techniques by varying user-controlled parameters (raining height, hopper speed). To the knowledge of the authors, no theoretical models allow to choose flow rate, hopper speed and hopper height for a given target density, as these models would certainly vary with each GM. These parameters would thus be determined experimentally for each GM and each desired density.
. The densities and relative densities achieved with a given preparation tech-nique depend on the material prepared. This was also found with the sample preparation methods used in Perko et al. (2006). For instance, though the difference between the VRD of vibrated SSC-1 and vibrated SSC-2 are small, they are significant enough to be differentiated. Thus if new soil simulants are prepared using the techniques proposed in this article, it would be essential to experimentally assess the acheived relative density of the new simulant.
6.2. Robustness
. The differences in rained densities obtained by modifying raining height and hopper speed illustrate the need to precisely control hopper speed and height. This is not possible without some level of hardware investment.
. Varying the operator and the final container for the Pour and Vibrate technique have allowed to identify sources of variations in the final density achieved. The differences observed between the densities achieved by two different operators with the Pour method in the 14.5 L metal container (C-1) are expected to be related to the variation in pouring speed. This is a clear limitation of the simple manual method proposed here. It illustrates the need to calibrate the method for each operator or to invest in hardware to make this method operator independent. The differences observed between the poured densities in (C-1) and the 245 mL container (C-3) are expected to be due to self compaction of the GM under its own weight. (C-1) being much taller than (C-3), the soil on the bottom of the taller container is subject to much more over-head weight and is thus compacted. The differences observed between the vibrated densities achieved in (C-1), the plastic 13.5 L container (C-2) and (C-3) are expected to be due to a different transmission of the vibrations from the shaker to the container. At the beginning of the vibration preparation, the 245 mL container had a tendency to bounce under vibration whereas the larger ones (C-1 and C-2) did not. This modified the vibrations applied to the GM and thus the final density achieved. Similarly, due to the different properties of metal and plastic, the vibrations are transfered to the prepared sample differently. This explains the differences observed experimentally between C-1 and C-2. This illustrates the need to calibrate each vibration setup.
. Once prepared, gravity alone has no effect on granular material over-time. Indeed an arrangment of particles in a gravity field is said to be in a meta-stable state. However if an exterior perturbation (shock or vibration) injects enough energy in the arrangment, it can leave its meta-stable state and evolve towards another meta-stable state. It will evolve towards a lower energy level in the given gravitational field (which corresponds to a higher density state). The lower the initial density the more sensitive the granular material will be to perturbations. Since it is almost impossible to ensure that the prepared material will receive no shocks or vibrations it should be expected that the density of the poured samples will progressively increase over time. The vibrated samples being in a very high state of density will be much less sensitive to such perturbations. It is thus recommended to use the poured samples directly after preparation and minimize the vibrations and shocks it could be subject to.
. However, for a given granular material and preparation technique done by a given operator with a given setup, the standard deviations observed are very low for all the data sets presented here. The soil simulants can thus be prepared in a repeatable and controlled manner.
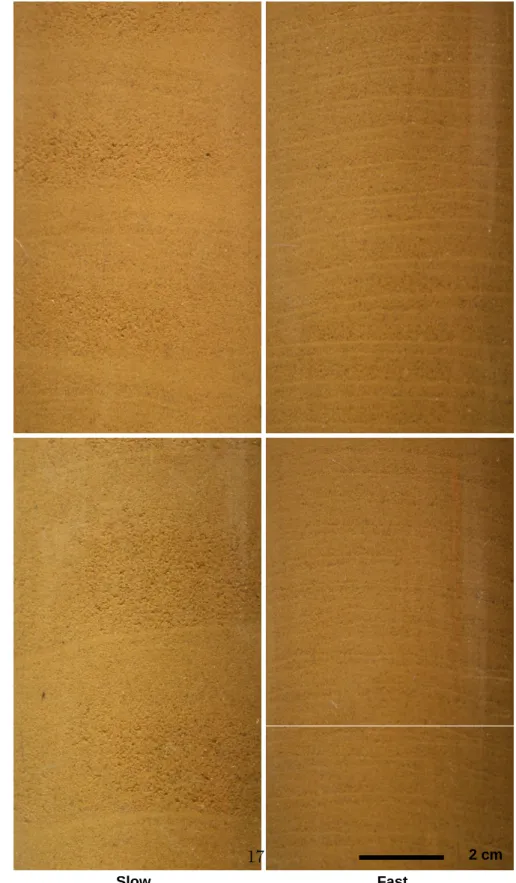
6.3. Soil sample fabric
. Preparing SSC-1 and SSC-2 in the 245 mL transparent container (C-3) has allowed direct observations of layering and granular material fabric. Figure 5 presents four pictures of rained SSC-1 from high and low heights and at slow and fast hopper speeds. Layers and particle segregation in each layer are clearly visible. The size of the layer is very logically linked to hopper speed. Indeed, the slower the hopper translation speed, the more time it takes to complete a pass over the container. Since the soil flow rate out of the hopper is constant, more soil is deposited in a single pass, thus creating thicker layers.
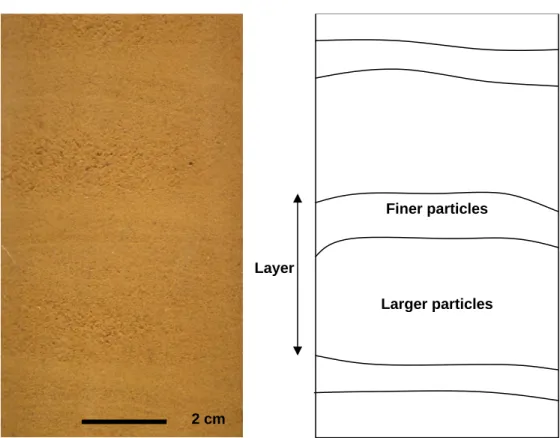
. Figure 6 is a picture and a schematic of SSC-1 prepared with the Rain method at high height and low speed. The particle segregation or layer structure can clearly be seen in this figure. The bigger particles are in the lower portion of each layer and the finest particles are on the top portion of the layer. The aerodynamic forces have more influence on the finer particles than on the large particles. Thus the finer particles settle after the largest ones. It is interesting to note that, even though raining from the high level at a slow hopper speed and raining from the low level at a fast hopper speed gave very close densities, the internal structures obtained are very different. . Similar images were taken for the rained SSC-2 samples to examine the particle layering, however, it was more difficult to observe layering in the SSC-2 samples. Since the particle size distribution of SSC-2 is much tighter than SSC-1 particle size distribution, much less segregation will take place. Without significative segregation it is difficult to detect layers visually. . The poured and vibrated SSC-1 and SSC-2 samples were also photographed. Figure 7 presents these pictures. The SSC-2 samples are very homogenous (because of the very tight particle distribution as explained above). The SSC-1 samples present some local fabric variations but do not have a very organised and layered structure like the rained samples. Generally, it can be said that the Poured and Vibrate techniques prepare much more homogenous samples than the Rain technique. The slight particle segregation that was
Slow Fast L o w H ig h 2 cm
Figure 5: Pictures of SSC-1 prepared in transparent container with Rain method. The layering and segregation of particles in each layer are visible in each picture. The differences in soil fabric caused by the slow or fast speed of the hopper are clearly visible. A fast
Larger particles Finer particles
Layer
2 cm
Figure 6: Picture and schematic of SSC-1 prepared in transparent container with Rain method from high height at low hopper speed. The schematic highlights the position of the different layers and the segregation in each layer.
observed in the poured and vibrated SSC-1 samples is expected to be due to variations in pouring rate during the sample preparation.
. The resin spheres also allow the observations of granular material fabric. Figure 8. right presents a resin sphere obtained after impregnating into poured SSC-1. The resin spheres obtained after pouring and vibrating are generally round. The resin sphere in Figure 8. left was obtained by im-pregnating resin into SSC-1 after it was rained into a large soil bin for leg soil interaction experiments (Scott (2009)). The layers created by the Rain technique are clearly visible in the resin “sphere”. The peaks present on the surface of the rained resin sphere are made of the finer particles of SSC-1. This is explained by capillary action. Indeed the capillary forces in partic-ulate materials are inversely proportional to the distance between particles. Finer particles have smaller distances between them. Thus the resin, pulled out by stronger capillary forces, spreads more in the fine particulate.
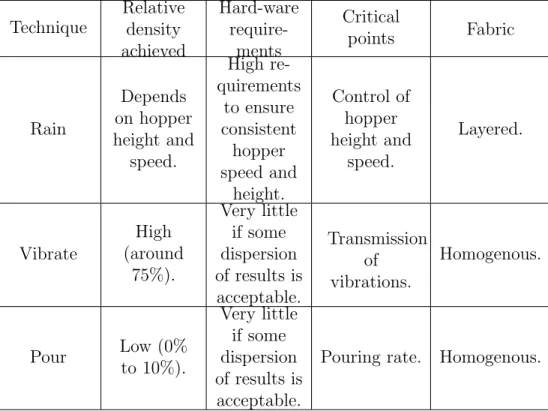
6.4. Summary
. Table 6 is a summary of the main characteristics of the three proposed granular material preparation methods studied in this paper. The relative densities achieved, the fabric of the granular material, the hard-ware require-ments and the critical points of each technique are presented.
7. Conclusions
. In this paper, three granular material preparation techniques have been presented (Rain, Pour and Vibrate)and tested with two soil simulants (SSC-1 and SSC-2). The densities achieved were measured by volumetric methods and by resin impregnation. All three techniques allow precise and repeatable results. However, variations in hardware used and in operators can cause variations in the final density achieved. Additionally the relative density obtained by a given preparation technique depends on the granular material used. It is thus recommended to assess the density of the prepared granular material each time the setup or the granular material is changed. If high precision on the relative density achieved is needed over a long period of time or with different operators, it is recommended to invest in hardware to execute these preparation techniques. Furthermore, this paper has illustrated the impact of preparation techniques on soil fabric (with resin impregnation or transparent containers).
Poured Vibrated S S C -1 S S C -2 20
Technique Relative density achieved Hard-ware require-ments Critical points Fabric Rain Depends on hopper height and speed. High re-quirements to ensure consistent hopper speed and height. Control of hopper height and speed. Layered. Vibrate High (around 75%). Very little if some dispersion of results is acceptable. Transmission of vibrations. Homogenous. Pour Low (0% to 10%). Very little if some dispersion of results is acceptable.
Pouring rate. Homogenous.
Table 6: Summary of relative densities achieved, fabric of the granular material, hard-ware requirements and critical points of the Rain, Vibrate and Pour technique studied in this paper.
1 cm
Figure 8: Pictures of resin spheres obtained after preparing and impregnating SSC-1. The spheres have a diameter of approximately 5 cm. On the right, the round resin sphere is a poured SSC-1 sample. On the left the resin “sphere” is a rained sample (Scott (2009)). The resin impregnation technique allows local fabric observation.
. Apart from testing techniques and identifying sources of dispersion, this pa-per shows the necessity to systematically assess the relative density achieved and to describe how this relative density was achieved for a given experi-mental setup. Indeed numerous publications describing tests done on space hardware interacting with regolith simulants do not include such details. It is thus very difficult to repeat or to compare results. A precise description of regolith stimulant preparation technique, of relative density achieved and an indication of dispersion observed should be common practice in publications.
. It is not possible to recommend one preparation technique over another for creating regolith samples for space hardware testing. Indeed depending on the application, a layered granular material preparation or a homogenous sample may be preferred. But above all, the most challenging scenario will be different for two different applications. For a locomotion system, it seems loosely compacted materials are very difficult to traverse, as the recent trap-ping of NASA Martian rover Spirit has shown (NASA (2009)). For a drilling or penetration system, the high density case is the most demanding in terms of over-head force requirements (El Shafie et al. (2009)). Thus to ensure space system performance, if the most stringent environment is not clearly
identified, it seams prudent to test systems interacting with granular mate-rials at high and low relative densities. The techniques presented here can be used to do so.
8. Acknowledgments
. The authors thank the European Space Agency for their support, partic-ularly for fostering research through the Networking and Partnership Initia-tive. The authors thank the French Ministry of Research for funding PhD grants.
ASTM, 2000. 4254-00 Standard Test Methods for Minimum Index Density and Unit Weight of Soils and Calculation of Relative Density, in: American Society for Testing and Materials.
Bica, A., 1991. A Study of Free Embedded Cantilever Walls in Granular Soil. Ph.D. thesis. University of Surrey.
Brunskill, C., Lappas, V., 2009. The effect of soil density on microrover traffi-cability under low ground pressure conditions, in: 11thEuropean Regional
Conference of the International Society for Terrain-Vehicle Systems. Bui, H., Kobayashi, T., Fukagawa, R., Wells, J., 2009. Numerical and
exper-imental studies of gravity effect on the mechanism of lunar excavations. Journal of Terramechanics .
Clayton, C., Bica, A., Moore, S., 1994. A resin impregnation technique for the determination of the density variations in completed specimens of dry cohesionless soil. Geotechnique 44, 165–173.
Ehrichs, E., Flint, J., Jaeger, H., Knight, J., Nagel, S., Karczmar, G., Ku-perman, V., 1998. Convection in vertically vibrated granular materials. Philosophical Transactions: Mathematical, Physical and Engineering Sci-ences , 2561–2567.
El Shafie, A., Ulrich, R., Roe, L., 2009. Penetration Forces for Subsurface Regolith Probes, in: 40th Lunar and Planetary Science Conference, March 23-27, 2009, The Woodlands, Texas, USA.
Gouache, T., Gao, Y., Coste, P., Gourinat, Y., 2009. Experimental Paramet-ric Evaluation of Dual-Reciprocating-Drilling Mechanism Performance, in: Proceedings of the 11th European Conference on Spacecraft Structures, Materials and Mechanical Testing, Toulouse, France.
Knight, J., Fandrich, C., Lau, C., Jaeger, H., Nagel, S., 1995. Density relax-ation in a vibrated granular material. Physical review E 51, 3957–3963.
Knight, J., Jaeger, H., Nagel, S., 1993. Vibration-induced size separation in granular media: The convection connection. Physical review letters 70, 3728–3731.
Mahmood, A., Mitchell, J., Lindblom, U., 1976. Effect of specimen prepa-ration method on grain arrangement and compressibility in sand. ASTM special technical publication , 169–192.
Myrick, T., Chau, J., Carlson, L., et al., 2004. The RAT as a rock physi-cal properties tool, in: Proceedings of AIAA Space 2004 Conference and Exhibit/AIAA, pp. 1–11.
NASA, 2009. Soft ground puts Spirit in danger despite gain in daily energy. May 11, 2009. NASA.
Nowak, E., Knight, J., Ben-Naim, E., Jaeger, H., Nagel, S., 1998. Density fluctuations in vibrated granular materials. Physical Review E 57, 1971– 1982.
Okamoto, M., Fityus, S., 2006. An evaluation of the dry pluviation prepa-ration technique applied to silica sand samples, in: Geomechanics and geotechnics of particulate media: proceedings of the International Sympo-sium on Geomechanics and Geotechnics of Particulate Media, Ube, Yam-aguchi, Japan, 12-14 September 2006, Taylor & Francis Group. p. 33. Perko, H., Nelson, J., Green, J., 2006. Mars Soil Mechanical Properties and
Suitability of Mars Soil Simulants. Journal of Aerospace Engineering 19, 169.
Scott, G., Saaj, C., 2009a. An Investigation into the trafficability of a low mass legged rover on loosely packed granular soils, in: 11th European
Scott, G., Saaj, C., 2009b. Measuring and Simulating the Effect of Varia-tions in Soil Properties on Microrover Trafficability, in: AIAA Space 2009 Conference and Exposition, AIAA, Pasadena, CA, USA.
Scott, G.P., 2009. Steps towards characterising legged microrover perfor-mance on compressible planetary soils. Ph.D. thesis. University of Surrey. Seiferlin, K., Ehrenfreund, P., Garry, J., Gunderson, K., H¨utter, E., Kargl, G., Maturilli, A., Merrison, J., 2008. Simulating Martian regolith in the laboratory. Planetary and Space Science 56, 2009–2025.
Thomson, B., Schultz, P., Bridges, N., 2008. Extracting scientific results from robotic arm support operations: A technique for estimating the density and composition of rocks on Mars. International Journal of Mars Science and Exploration 4.
Witte, L., Richter, L., Block, J., Buchwald, R., Scharringhausen, M., Sprwitz, T., Schrder, S., 2009. A vehicle dynamics test facility for planetary surface mobility, in: Proceedings of the 11th European Conference on Spacecraft
Structures, Materials and Mechanical Testing, Toulouse, France.
Zacny, K., Cooper, G., 2007. Friction of drill bits under Martian pressure. Journal of Geophysical Research-Planets 112, E03003.
Zacny, K., Quayle, M., Cooper, G., 2004. Laboratory drilling under martian conditions yields unexpected results. Journal of Geophysical Research-Planets 109, E07S16.