HAL Id: hal-01430344
https://hal.archives-ouvertes.fr/hal-01430344
Submitted on 9 Jan 2017HAL is a multi-disciplinary open access archive for the deposit and dissemination of sci-entific research documents, whether they are pub-lished or not. The documents may come from teaching and research institutions in France or abroad, or from public or private research centers.
L’archive ouverte pluridisciplinaire HAL, est destinée au dépôt et à la diffusion de documents scientifiques de niveau recherche, publiés ou non, émanant des établissements d’enseignement et de recherche français ou étrangers, des laboratoires publics ou privés.
Damage of woven composite under translaminar
cracking tests using infrared thermography
Teddy Lisle, Marie-Laetitia Pastor, Christophe Bouvet, Philippe Marguerès
To cite this version:
Teddy Lisle, Marie-Laetitia Pastor, Christophe Bouvet, Philippe Marguerès. Damage of woven com-posite under translaminar cracking tests using infrared thermography. Comcom-posite Structures, Elsevier, 2017, vol. 161, pp. 275-286. �10.1016/j.compstruct.2016.11.030�. �hal-01430344�
Any correspondence concerning this service should be sent to the repository administrator: staff-oatao@listes-diff.inp-toulouse.fr
O
pen
A
rchive
T
OULOUSE
A
rchive
O
uverte (
OATAO
)
OATAO is an open access repository that collects the work of Toulouse researchers and makes it freely available over the web where possible.
This is an author-deposited version published in: http://oatao.univ-toulouse.fr/
Eprints ID: 16555
To cite this version: Lisle, Teddy and Pastor, Marie-Laetitia and Bouvet, Christophe and Margueres, Philippe Damage of woven composite under translaminar cracking tests using
infrared thermography. (2017) Composite Structures, vol. 161. pp. 275-286. ISSN
0263-8223
1
Damage of woven composite under translaminar cracking tests using
infrared thermography
Teddy LISLE1, Marie-Laetitia PASTOR1, Christophe BOUVET1*, Philippe MARGUERES1
1
Université de Toulouse, UPS, ISAE-Supaéro, ICA 10, avenue Edouard Belin, -BP 54032- 31055 Toulouse cedex 4
*
Corresponding author: christophe.bouvet@isae.fr
Keywords: infrared thermography (IRT), fiber failure, fracture toughness, composite fracture
Abstract
The aim of this work is to increase the study of the notch translaminar propagation of the woven structures, using the InfraRed Thermography (IRT). A test of notch propagation under quasi-static traction was developed and used to study the failure phenomena on two different draping sequences. For each study, a local estimation of dissipated energies, associated with different damages, is carried out using the measurement of the surface temperature field. The study of heat source fields combined with micrographic observations allowed to define the matrix micro-cracking as the predominant damage phenomenon in crack tip. The critical energy release rate, obtained using IRT, corresponds to critical energy release rate reported in the literature for translaminar rupture of laminates. Furthermore, when brittle cracking develops in a thermosetting matrix laminate, the majority of irreversible mechanical energy (>90%) is dissipated as heat. In the case of brittle cracking, the developed method proves to be an efficient alternative technique for the local measure of energy release rate, even in cases where the variations in stiffness due to cracking phenomena remain low.
2
Introduction
Woven composites are advanced materials that are commonly used in aerospace applications. Their use is interesting owing to their excellent drapability oven complex geometries, their effective manufacturing cost and their good damage tolerance properties. For example, the skin of helicopter blades is often made of a few woven plies. Nevertheless, in these thin structures parts, a through-the-thickness crack might appear in service. In fact, composites are subjected to a lot of failure processes due to the inhomogeneous and complex microstructure.
For the past decades, several authors have investigated the damage scenario of different woven composite laminates under quasi-static tensile loading [1-4]. For woven glass-fibre-reinforced composites, transverse yarn cracking is the first readily observable type of damage occurring during tensile loading. As the strain increases, damage develops on the meso-scale by intra-yarn cracking and delamination, and on the micro-scale by local debonding at the fibre-matrix interface [1]. The final macro-fracture is characterized by dense cracking, intersection of several small cracks and fiber rupture.
A failure which causes the structure breaking is the ply translaminar failure. So a lot of works have dealt with study of translaminar propagation in order to characterize it [5-9]. Nevertheless, the traditional experimental methods have gaps. The ECT test is only standardized for the translaminar failure tests [10]. The standard only deals with the characterization of the rupture initiation from a method for the isotropic materials [11]. The experimental difficulties are the following:
To propagate a steady crack without other damaging modes disrupting measurements or the failure scenario. The stability of the propagation is an important point because the size of the damaged zone in notch tip and thus the Gc values depend on it.
To evaluate the cracked length.
To calculate the contact stress and the dissipated energy by friction when the crack edges remain in contact during the propagation. The effects to the measure of the energy release rate are still badly defined by the literature studies [Blackman et al., 2005].
To estimate the energy release rate due to the failure initiation. The definition of the initiation beginning and the associated damage characterization are still badly established. The use of the acoustic emission enabled to improve detection of the damage beginning and the associated events at the propagation beginning [6, 8]. However this technique allows, neither to locate these damages, nor to determine their sizes [6, 9].
3 In order to study the complex damage scenario of woven composite, traditional techniques such as X-ray, ultrasound C-scan imaging, acoustic emission, or digital image correlation may be insufficient and thermography can provide interesting additional information. From the past 20 years, IRT has been widely used to study the dissipative phenomena in materials, such as plasticity in metals [12-13] or damage in polymers [14]. Using the framework of irreversible thermodynamics, Chrysochoos et al. [15] have presented a methodology to estimate the internal heat sources associated with the dissipative phenomenon from temperature measurement on the sample surface. They show that an estimation of the heat sources makes it possible to locate the damage in time and space and to evaluate the energy-related information that can be used to characterize the irreversible energy dissipated [16-19].
Nevertheless in order to evaluate this dissipated energy quantitatively, the ratio of energy dissipated as heat to irreversible energy, i.e. the Taylor–Quinney coefficient [20], is needed, and it can be difficult to evaluate this coefficient [21-22].
The aim of this work is thus to increase the study of the notch translaminar propagation of the woven structures, using the IRT. A test of notch propagation under quasi-static traction was developed and used to study the failure phenomena on two different draping sequences. For each study, a local estimation of dissipated energies, associated with different damages, is carried out using the measurement of the surface temperature field. From these temperature fields, an experimental technique, based on a 2D or 3D-thermal approach, is carried out for the local measurement of the energy release rate associated with different cases of cracks.
I. Experimental set-up and material
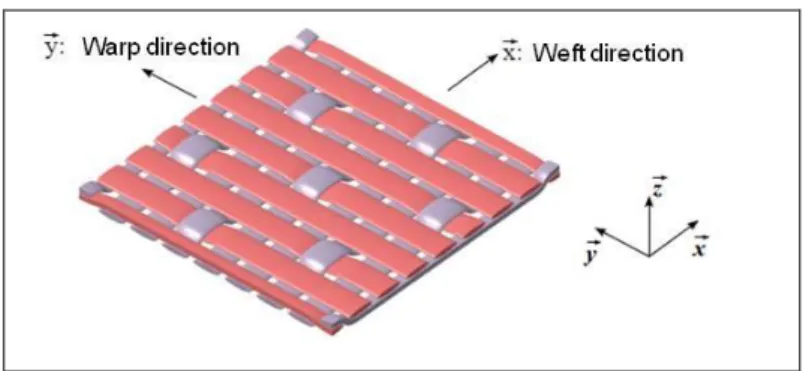
The crack propagation is studied in glass/epoxy woven composite. These laminates are made of 8-harness satin balanced woven fabric (8-HS) pre-pegs plies with a fibre volume fraction of 50% (see Figure 1). The yarn size is 0.5 mm-width and 0.1 mm-thickness. The elastic moduli are 21.5 and 20.5 GPa, the limit strength 385 and 280 MPa, respectively in the warp and weft directions, the shear modulus is 3.5 GPa and the shear strength 65 MPa. The samples are always manufactured with the warp woven face on the top of the thickness, so the top face is a warp side and the underside face a weft one. The samples are made of 2 glass/epoxy woven plies surrounded with 2 unidirectional carbon plies (see Figure 2) [23-24]. The carbon plies allow increasing the specimen stiffness. A finite element study has been performed in order to determine the limit conditions and the crack length in order to obtain propagation stabilization (dG/da < 0). So the specimen geometry is given in Figure 2. The crack length is equal to 20 mm and is carried out with a diamond wire saw.
4
Figure 1: Weave pattern
W = 50 mm Notch: a = 20 mm 10 mm 150 mm 50 mm Post-traited zone
Figure 2: Geometry of the specimen
All the tests are performed at ambient temperature and under quasi-static tensile loading at constant speed equal to 3 mm.min-1. An infrared camera (FLIR SC700 MW) is used to monitor the thermal response during the tests. Sample are painted matt black and enclosed in a rectangular box made of expansive foam to measure temperature variation field avoiding external thermal perturbations. The experimental set-up was the following:
image capture frequency: 50 Hz;
thermal resolution: 0.025 K (for relative temperature measurement); spatial resolution (pixel size): 0.17 mm;
observed zone: 54*43 mm² with a resolution of 3 pixels by woven width.
The temperature variations are raised on a zone located at the specimen centre in order to avoid the thermal disturbances observed close to the clamps.
5 Heat sources were estimated as described in [23-24]. In fact, the experimental temperature variations are approximated on a moved window by a 2D-polynomial function (app). The
smoothing of the temperature field at a time t is thus carried out by moving in each measure point the centre of the smoothing window. Then the obtained temperature field is approximated within the meaning of least squares on a moved smoothing window of 5*5 pixels². The heat sources in each pixel p’ch are estimated with the centre of the smoothing window for each image (Eq.1).
𝑝𝑐ℎ′ ⃗⃗⃗⃗⃗⃗ (𝑖, 𝑗, 𝑘) = 𝜌𝐶 (𝜃𝑎𝑝𝑝(0,0,𝑘+1)−𝜃𝑎𝑝𝑝(0,0,𝑘−1) 2∆𝑡 + 𝜃𝑎𝑝𝑝(0,0,𝑘) 𝜏𝑡ℎ2𝐷 ) − (𝑘𝑥𝑥 𝑐2,0 ∆𝑥2+ 2𝑘𝑥𝑦 𝑐1,1 ∆𝑥∆𝑦+ 𝑘𝑦𝑦 𝑐0,2 ∆𝑦2) Eq. 1
And the time constant 𝜏𝑡ℎ2𝐷 is given by experiments.
The material parameters employed for the calculation of the heat sources are given in the
Table 1.
Longitudinal and transverse thermal conductivity, kxx=kyy 0.55 W.m-1.K-1
Thermal conductivity in the thickness direction, kzz 0.35 W.m-1.K-1
Specific heat capacity, C 882 J.kg-1. K-1
Density, 1730 kg.m-3
Coefficient of heat exchange by convection, h/air 8.15 W.m-2.K-1 Table 1: Material parameters considered for the glass/epoxy woven plies [25-26]
The damage maps are then obtained by temporal sum of the positive heat sources in each pixel (wd, Eq.2). 𝑤𝑑 = ∑ 𝑝̅̅̅̅𝑐ℎ′ + (𝑖, 𝑗, 𝑘)∆𝑡 𝑁 𝑘=1 Eq. 2 𝑝𝑐ℎ′
̅̅̅̅+ represents the heat sources positive and higher than the detection threshold estimated at 0.8x10⁶ W.m-2.
N indicates the image number at the considered time.
II. Notch propagation tests on [0°] specimens
A lot of studies [23-24, 27] have shown that the crack propagates in the notch axis following the weaving points. In our study, the notch tip damage corresponds to intralaminar failure of the weft woven but also propagation of vertical cracks in the warp woven (see Figure 3).
6
Figure 3: Micrographic views of the warp face (a) in notch tip, (b) after specimen failure and (c)
transverse view in notch tip
Figure 3(b) shows that intralaminar cracks are observed in weft woven until 11 mm above
the notch. When the notch propagates, the specimen is completely cracked in the thickness with the failure of the warp woven (Figure 3(c)). Moreover, few of meta-delaminations and inter-plies delaminations are observed. The interlaminar cracks of warp woven contain "cups", typical features of shear failures (see Figure 4).
7 Garcia [28] notices a lot of intralaminar cracks in transverse woven on the weft face. So the notch tip damage is the combination of the tensile damage and the shear damage. In order to characterize the size of the damaged zones, the heat source fields are calculated from thermal images (the post-treatment zone is presented in Figure 2). Figures 5 and 6 show the results obtained from a test on weft and warp face.
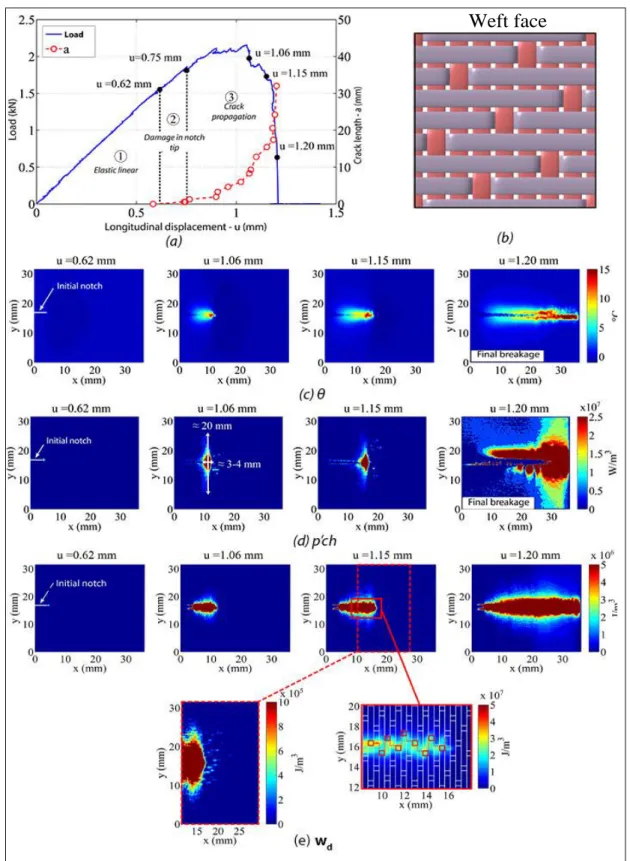
Weft face
Figure 5: (a) strain/displacement curve; (b) weft face pattern; (c) temperature variation field ; (d)
8
Figure 6: (a) strain/displacement curve; (b) warp face pattern; (c) temperature variation field ; (d)
9 For both tests, a strong temperature elevation in notch tip appears firstly follows a thermos-elastic cooling zone. This zone looks like a cardioids showing a tensile state gathered post-damaged zone in notch tip. The damage scenario is decomposed in 3 zones regardless of the observed face (see Figures 5 and 6):
Zone 1: this zone corresponds to elastic linear part of the strain/displacement curve.
No damage is noted.
Zone 2: damage grows in notch tip without a propagation of the initial crack. The
first non-linearities on the strain/displacement curve are observed. For the warp face test, the notch instantly propagates after the damage initiation in notch tip. The space of this damaged zone depends on the position of the pre-cracked tip regarding the woven. In fact, the propagation instantly occurs after the damage beginning if the pre-cracked tip is inside a longitudinal woven. This damage corresponds to shear micro-cracking in longitudinal woven. In the case where the pre-crack is between two woven, the damage firstly propagates in the zones containing resin or transversal woven. Figures 7(a) and 7(b) show that the damaged zone size is the same for both faces. The zones are about 5 mm height and 1 mm width. Positive heat sources on the pre-cracked edges appear due to the displacement of the initial notch tip. The heat source fields (Figures 5(d) and 6(d)) show that the damage appears earlier weft face than warp face. So the cracks propagate firstly in the transversal woven then in the longitudinal woven.
(a) wd weft face (b) wd warp face
Figure 7: Comparison of the damaged zones size (a) weft face and (b) warp face before the crack
propagation
Zone 3: this part corresponds to the propagation of the initial pre-crack. Figures 5(e) and 6(e) show the cumulated heat sources fields wd. The cumulated heat source fields on weft
face at u = 1.15 mm show that the initial crack propagates in the transversal direction following the weave, as [23-24] have observed during fatigue tests. During the crack propagation, the source fields p'ch (Figures 5(d) and 6(d)) highlight many micro-cracks in
10 weft and warp woven, longitudinal fibre failures and interface debonding. A strong dissipative part around the notch underlines a strong damage concentration (concentration of fibre failures, micro-failures and pseudo-plasticity). The heat sources become blurred far from the notch (micro-failures and interface debonding). Smaller heat sources are observed in front of this damaged zone. They are produced by the transversal woven failure. A big number is observed on the weft face where the transverse woven is important. Finally the cumulated heat source fields show that the crack propagation comes with a damage of 10 to 15 mm length around the crack. When the crack is near the specimen edge, the final failure occurs quickly and the heat sources are disrupted by the specimen displacements due to the elastic return of the specimen.
III. Notch propagation tests on [±45°] specimens
For propagation tests on [±45°] composites the direction of the cut is still governed by the position of weaving points (Figure 8). However, depending on the ply which controls the propagation (+45° or -45° ply), the notch path may be variable. Figure 8a shows the preferred alignments of weaving points to several directions of the woven ply. For plies oriented at +45° the weaving points have preferred orientations: ±27° and 90° relative to the horizontal. For -45° plies the characteristic angles are 0° and ±63°. Figure 8b shows the fracture surfaces obtained for two different tests. The observed disparity reflects the poor reproducibility of the cut paths. Indeed, in the first case the notch is initially propagates horizontally then bifurcates at an angle of about 33° relative to the horizontal, which suggests that the -45° ply and the +45° ply control successively the propagation (see warp face, Figure 8a). For the second specimen (weft face, Figure 8b), the propagation is totally controlled by the + 45° ply since the cut has an orientation at an angle of 27° relative to the horizontal.
11
Figure 8: (a) Warp face of the weave pattern oriented in the directions 0°, 90°, + 45° and -45°. (b)
Photographs of the ±45° specimens after spread of the notch
The damage observed on a microscopic scale is essentially characterized by shear microcracks in transverse and longitudinal strands (Figure 9). These microcracks initially parallel to the fibre direction propagate almost horizontally between two successive strands. The absence of "cups" on these cracks leads us to believe that the spread of intralaminar shear cracks is due to resin breakage.
Figure 9: Micrographs after breakage of the warp face of a ±45° specimen
As for [0°]2 specimens, changes in temperature of both faces were monitored by IRT
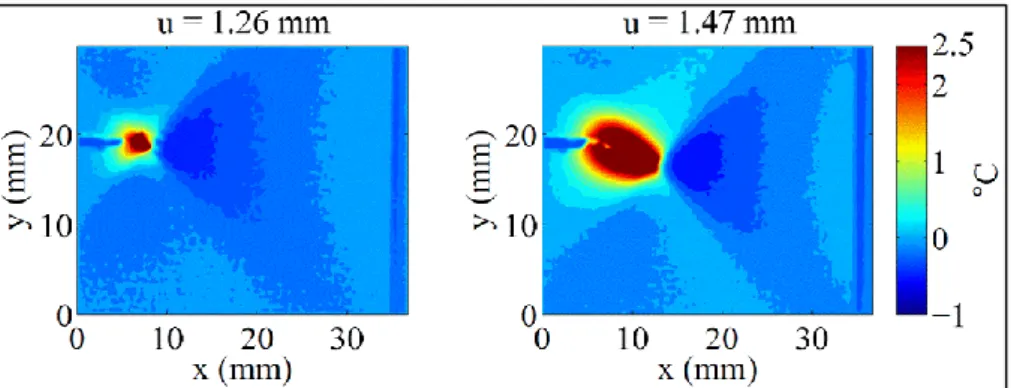
(Figures 11 and 12). For both cases, a concentrated heating is observed at the crack tip. A maximum rise in temperature of about 24°C is reached during propagation. A thermos-elastic
12 cooling is observed in front of the damaged area. The cooling zone is of triangular shape. The sides adjacent to the crack tip are oriented ± 45° to the horizontal (Figure 10). This indicates that the tension zone at the crack tip is bounded by the first +45° and -45° unbroken strands which transmit the load. Furthermore, when the notch approaches the specimen edge, the local field of elastic stresses changes also due to edge effects, affecting the elastic cooling, see Figure 11c (weft face, u = 1.51 mm) and Figure 12c (warp face, u = 1.76 mm).
As for [0°]2 specimens, Figures 11 and 12 allow us to define the notch propagation
scenario into three zones: a linear elastic region (1), an area where the damage develops tip of the initial notch (2) and a propagation zone (3). Zone 2 begins nearly at the same displacement for both tests. The cumulative heat source fields (Figures 11-e and 12-e) show that just before the crack propagation extensive damage developed in the direction of the warp and weft strands. The shape of the damaged area is comparable to that of a cross on the weft face (Figures 10-d). As for [0°]2 specimens, the initial notching conditions may explain this disparity. For both cases damaged
area is about 1 to 2mm² and is smaller than those observed for [0°]2 specimens. During crack
propagation a field of high intensity sources surrounds its path and more diffuse heat sources develop in the directions of the +45° and -45° yarns. A “cross” is then observed mainly resulting from the spread of intralaminar shear cracks parallel to the direction of the yarn. Comparing the obtained results with those for [0°]2 specimens:
the damaged area observed during the notch propagation is similar; positive heat sources are also detected;
the extent of the damaged area during the propagation and the resulting cumulative heat source fields (Figures 11-e and 12-e) are also similar.
13
Figure 11: Weft face: (a) load vs displacement; (b) weave pattern; (c) changes in temperature
fields (°C) , (d) heat source fields p'ch (W/m3) and (e) cumulative heat source fields wd (J/m3)
L o a d Longitudinal displacement Load C ra ck l en g th
Weft face
Initial notch Initial notch Final breakage Final breakage Initial notch14
Figure 12: Warp face: (a) load vs displacement; (b) weave pattern; (c) changes in temperature
fields (°C) , (d) heat source fields p'ch (W/m3) and (e) cumulative heat source fields wd (J/m3)
IV. Evaluation of critical energy release rate
The energy release rate (G) is calculated from the integral heat source fields: 𝐺 =𝑒 ∫ [∫𝑆𝐼𝑅𝑝′̅̅̅𝑐ℎ 𝑑𝑆𝐼𝑅] 𝑑𝑡
𝑡𝐴+𝑑𝐴 𝑡𝐴
𝛽 𝑑𝐴 Eq. 3
where dA, the increase in the fractured surface, is estimated by assuming that the crack propagates
rectilinearly in thickness. dA = e × a , where e is the thickness and a the notch spread determined from the cumulative heat source fields. SIR is the integration area and β ratio is the proportion of
energy converted into heat during notch propagation.
L o a d Longitudinal displacement Load C ra ck l en g th Warp face Initial notch Initial notch Final breakage Final breakage Initial notch
15
Figure 13a shows an example of cumulative heat source fields at crack tip on a [0°]2
specimen. a (Figure 13c) is measured using profile A defined in Figure 13a. The damage length (Figure 13d) is measured using profile A defined in Figure 12a. Hence the size of the damaged area is known and sets the minimum size of the integration area SIR (Figure 13a and b). For
[±45°]2 specimens the cut path is not horizontal. Crack length is estimated as the norm of the
vector defined by a0 and a1 (Figure 13b). G is here measured with a modified SIR in order not to
take into account the displacements of the crack edges (Figure 13b). β is estimated as the ratio of the rate of heat energy release Gir and the energy release rate G (irreversible mechanical energy release rate). 𝛽 = 𝑑𝑊𝑑 𝑑𝑊𝑒𝑥𝑡−𝑑𝑊𝑟= 𝐺𝑖𝑟 𝐺 Eq. 4 𝐺𝑖𝑟 =𝑒 ∫ [∫𝑆𝐼𝑅𝑝′̅̅̅𝑐ℎ 𝑑𝑆𝐼𝑅] 𝑑𝑡 𝑡𝐴+𝑑𝐴 𝑡𝐴 𝑑𝐴 Eq. 5 𝐺 =𝑑𝑊𝑒𝑥𝑡−𝑑𝑊𝑟 𝑑𝐴 Eq. 6
Figure 13:Cumulative source fields Δwd during a notch propagation: (a) [0]2 weft side and (b)
[±45]2 weft side. Changes in Δwd along profile: (c) A and (d) B defined in (a)
Figure 14a shows the changes in Gir depending on cut spread for [0°]2 specimens.
Changes in corresponding G -calculated from the areas method- are given in Figure 14b. The evolution of Gir is comparable for both sides, even if it is found that values obtained on warp face
Notch spread
16 are slightly lower. The same trends are observed for propagation tests on [± 45°]2 specimens
(Figure 14c and d). Mechanical Mechanical Warp Weft Warp Weft Warp Weft Warp Weft
Figure 14: Comparison -on weft and warp faces- of the changes in: (a) Gir and (b) G for [0°]2 specimens
and (c) Gir and (d) G for [± 45°]2 specimens
Table 2 gives the average values (obtained from both methods) for initiation and
propagation. Values for initiation are defined as the mean of the first values obtained for both faces. Propagation values are defined as the average of all the other values.
For [±45°]2 specimens obtained results highlight low values for initiation. It is consistent
with the smaller damaged areas observed previously. However, the initiation value obtained with the areas method is abnormally high (68.5 kJ.m-2). This comes from outliers obtained for initiation on weft face (Figure 14d) linked to the fact that it is difficult to get an accurate measurement of G from the variations of the load/displacement curve at the beginning of the test. If we consider only the initiation value on warp face, Ginit is equal to 26.8 kJ.m-2 which is consistent with the average value obtained for the initiation on [0°]2 specimens.
17
[0°]2 [± 45°]2
Initial Propagation Initial Propagation
Gir G Gir G Gir G Gir G
21.6 26.3 62.4±30.3 69.1±25.3 15.8 68.5 61.5±67.2 69.2±32.8
Table 2: Average values and relative standard deviations of energy release rate calculated for
initiation and propagation (kJ.m-2)
However, the calculated values are slightly lower than those obtained by [29] during 3-point bending tests on monolithic laminates made of glass/epoxy (E- Araldite F/HT972, fibre volume fraction close to 55%). Obtained initiation values are about 30 kJ.m-2 and the propagation values around 90 kJ.m-2.The finding is identical with the values obtained by [30] on [0°/90°]8S
carbon T300/epoxy 913- laminates (initiation: 91.6 kJ.m-2; propagation: 133 kJ.m-2). The proposed method (using the source fields) allows to define more accurately the initiating propagation which may explain the lower obtained values. As materials and failure modes are different, the authors assume that the energy release rates are comparable to those obtained in the literature for the translaminar cracking in mode I. Furthermore, whatever the configuration, obtained source fields on both faces are quantitatively equivalent. Therefore, we will assume that they are representative of the average dissipative sources field.
For both configurations, the heat energy release rates Gir and mechanical G, with associated R-curves (IR fit. and Mec. Fit), are compared in Figure 15. R-curves obtained by measuring heat energy remains below those obtained from the estimation of the mechanical energy. For each configuration, an average value of β is then estimated as the ratio between the calorific and the mechanical R-curves. R-curves are approximated using power laws: G = m.an, where n is respectively set to n0 = 0.24 and n45 = 0.35 for [0°]2 and [±45°]2 configurations. β is
thus the ratio of m coefficients. This set value of n requires that the irreversible mechanical proportion of energy converted to heat remains constant during initiation and propagation of the cut for each configuration. If the spread is stable, notch-tip damages are supposed qualitatively and quantitatively identical and β remains constant. However, define an identical β for propagation and initiation is more debatable. However, areas method is too imprecise to obtain quantitative data when the stiffness variations are small as at the initiation of cracking. β therefore could not be accurately assessed for initiation.
18
Figure 15: Comparison of energy release rates G and Gir for configurations (a) [0°]2 and (b) [±45°]2
The obtained average values are β0 = 0.92 and β45= 0.95. This indicates that the majority of
irreversible mechanical energy is dissipated as heat. As seen previously crack tip damage occurs mainly by multiple microcracks, fibre fractures and interface debonding. With such a high β it can be concluded that the proportion of pseudo-plasticity (shear in the resin) remains low and is mainly localized at the crack tip. It is therefore likely that the damage at the crack tip spreads mainly in the form of longitudinal and transverse microcracks in the yarns, thus relaxing the shear stresses in the resin-rich areas before that they reach their pseudo- hardening threshold.
In addition, the intensity of the measured dissipation field during translaminar propagation test (p'ch ~ 107 W.m-3) is 10 times greater than that obtained from the disoriented tensile tests (p'ch
~ 106 W.m-3) and 100 times greater than that observed for the rail shear test (p'ch ~ 105 W.m-3). So
even if a pseudo-plastic phenomenon manifested in notch tip, its contribution would be negligible compared to that generated by purely dissipative micro- cracking. In conclusion, for the studied laminates, the propagation of a macroscopic cut can be characterized as a highly dissipative cracking phenomenon, spending between 90 and 100% of irreversible mechanical energy into heat (0.9 < β < 1.0).
Conclusion
In this study notch propagation tests were conducted on [0°]2 and [±45°]2 glass/epoxy
woven composites and were monitored using IRT. This allowed to establish damage maps as well as quantitative data in the form of energy release rate (Gir) for both studied configurations ([0°]2
and [±45°]2). The study of heat source fields combined with micrographic observations allowed to
define the matrix micro-cracking as the predominant damage phenomenon in crack tip. The obtained results also highlight that the source fields obtained on warp and weft sides are
IR warp IR weft IR Fit. Mec. warp Mec. weft Mec. Fit. IR warp IR weft IR Fit. Mec. warp Mec. weft Mec. Fit.
19 quantitatively representative of the volumetric heat capacity, although heterogeneity inherent in the material certainly remains, even for thin laminates. The obtained energy release rate Gir corresponded to GIc reported in the literature for translaminar rupture of laminates. Furthermore, when brittle cracking develops in a thermosetting matrix laminate, the majority of irreversible mechanical energy (>90%) is dissipated as heat. The assumption was made that β remained constant during the crack propagation and was measured for both configurations: β0 = 0.92 and
β45 = 0.95. In the case of brittle cracking, the developed method proves to be an efficient
alternative technique for the local measure of energy release rate, even in cases where the variations in stiffness due to cracking phenomena remain low.
References:
[1] John S., Herszberg I. and Coman F. (2001). Longitudinal and transverse damage taxonomy in woven composite components. Composites Part B : Engineering, 32(8):659–668.
[2] Osada T., Nakai A. and Hamada H. (2003). Initial fracture behavior of satin woven fabric composites. Composite Structures, 61(4):333-339.
[3] Daggumati S., Van Paepegem W., Degrieck J., Xu J., Lomov S. and Verpoest I. (2010). Local damage in a 5-harness satin weave composite under static tension: part I- experimental analysis. Composites Science and Technology, 70(13):1926-1933.
[4] Vieille B., Casado V.M. and Bouvet C. (2014). Influence of matrix toughness and ductility on the compression after impact behavior of woven-ply thermoplastic and thermosetting composites: a comparative study. Composites Structures, 110:207-218.
[5] Jumahat A., Soutis C., Jones F. and Hodzic A. (2010). Fracture mechanisms and failure analysis of carbon fibre/toughened epoxy composites subjected to compressive loading. Composite Structures, 92(2):295–305.
[6] Laffan M., Pinho S., Robinson P. and McMillan A. (2012). Translaminar fracture toughness testing of composites : A review. Polymer Testing, 31(3):481–489.
[7] Jose S., Kumar R. R., Jana M. and Rao G. V. (2001). Intralaminar fracture toughness of a cross-ply laminate and its constituent sub-laminates. Composites Science and Technology, 61(8):1115 –1122.
[8] Gutkin R., Pinho S., Robinson P. and Curtis P. (2010). On the transition from shear-driven fibre compressive failure to fibre kinking in notched CFRP laminates under longitudinal compression. Composites Science and Technology, 70(8):1223–1231.
[9] Catalanotti G., Camanho P., Xavier J., Dávila C. and Marques A. (2010). Measurement of resistance curves in the longitudinal failure of composites using digital image correlation. Composites Science and Technology, 70(13):1986–1993.
20 [10] ASTM International (2004). Standard test method for translaminar fracture toughness of laminated polymer matrix composite materials. ASTM International, E1922-04.
[11] ASTM International (2006). Standard test method for linearelastic plane strain fracture toughness KIc of metallic materials. ASTM International, E399-06.
[12] Chrysochoos A, Louche H. (2000). An infrared image processing to analyse the calorific effects accompanying strain localisation. Int J Eng Sci, 38:1759–88.
[13] Dumoulin S, Louche H, Hopperstad O and Borvik T. (2010). Heat sources, energy storage and dissipation in high-strength steels: experiments and modeling. Eur J Mech A/Solids, 29:461– 74.
[14] Wattrisse B, Muracciole JM and Chrysochoos A. (2002). Thermomechanical effects accompanying the localized necking of semi-crystalline polymers. Int J Therm Sci,4 1(5):422–7.
Int J Solids Struct, 38(20):3549–3562.
[15] Chrysochoos A, Chezeaux JC and Caumon H. (1989). Analyse thermomécanique des lois de comportement par thermographie infrarouge. Rev Phys Appl, 24(2):215–25.
[16] Soumahoro Z. (2005). Etude du couplage thermomécanique dans la propagation dynamique de fissure. Université à Palaiseau, Ecole Polytechnique, Palaiseau.
[17] Lisle T., Bouvet C., Pastor M.L., Margueres P. and Prieto Corral R. (2013) Damage analysis and fracture toughness evaluation in a thin woven composite laminate under static tension using IRT. Composite Part A, 53:75–87.
[18] Lisle T., Bouvet C., Hongkarnjanakul N., Pastor M.L., Rivallant S. and Margueres P. (2015). Measure of fracture toughness of compressive fiber failure in composite structures using infrared thermography. Compos Sci Technol, 112:22–33.
[19] Freund LB. and Hutchinson JW. (1985). High strain-rate crack-growth in rate-dependent plastic solids. J Mech Phys Solids, 33(2):169–191.
[20] Taylor GI. and Quinney H. (1934). The latent energy remaining in a metal after cold working. In: Royal society A: mathematical, physical and engineering sciences.
[21] Rittel D. (1999). On the conversion of plastic work to heat during high strain rate deformation of glassy polymers. MechMater, 31(2):131–139.
[22] ZH L. and Lambros J. (2001) Strain rate effects on the thermomechanical behavior of polymers.
[23] Bizeul M. (2009). Contribution à l’étude de la propagation de coupure en fatigue dans les
revêtements composites tissés minces. Thèse de doctorat, Université de Toulouse.
[24] Bizeul M., Bouvet C., Barrau J. and Cuenca R. (2011). Fatigue crack growth in thin notched woven glass composites under tensile loading. part I : Experimental. Composites Science
21 [25] Bigaud D., Goyhénèche J.-M. and Hamelin P. (2001). A globallocal non-linear modelling of effective thermal conductivity tensor of textile-reinforced composites. Composites Part A:
Applied Science and Manufacturing, 32(10):1443–1453.
[26] Emery T., Dulieu-Barton J., Earl J. and Cunningham P. (2008). A generalised approach to the calibration of orthotropic materials for thermoelastic stress analysis. Composites Science and
Technology, 68(3-4):743–752.
[27] Shindo Y., Inamoto A. and Narita F. (2005). Characterization of mode i fatigue crack growth in GFRP woven laminates at low temperatures. Acta Materialia, 53(5):1389–1396.
[28] Garcia P. G. (2013). Behaviour of 8-harness satin weave composite under static tensile loads: Failure analysis of woven composites. Final degree project in aerospace engineering, Escuela Universitaria de Ingeniería Técnica Aeronaútica (EUITA) - Institut Supérieur de l’Aéronautique et de l’Espace (ISAE).
[29] Gershon B. and Marom G. (1975). Fracture toughness and mechanical properties of glass fibre-epoxy composites. Journal of Materials Science, 10(9):1549–1556.
[30] Pinho S., Robinson P. and Iannucci L. (2006). Fracture toughness of the tensile and compressive fibre failure modes in laminated composites. Composites Science and Technology, 66(13):2069–2079.
![Figure 4: Micrographic views in notch tip obtained under SEM [Garcia, 2013]](https://thumb-eu.123doks.com/thumbv2/123doknet/12182655.314578/8.892.148.748.87.595/figure-micrographic-views-notch-tip-obtained-sem-garcia.webp)


![Figure 13: Cumulative source fields Δw d during a notch propagation: (a) [0] 2 weft side and (b) [±45] 2 weft side](https://thumb-eu.123doks.com/thumbv2/123doknet/12182655.314578/17.892.144.762.357.945/figure-cumulative-source-fields-δw-notch-propagation-weft.webp)
![Figure 14: Comparison -on weft and warp faces- of the changes in: (a) Gir and (b) G for [0°] 2 specimens and (c) Gir and (d) G for [± 45°] 2 specimens](https://thumb-eu.123doks.com/thumbv2/123doknet/12182655.314578/18.892.138.746.149.578/figure-comparison-weft-warp-faces-changes-specimens-specimens.webp)
