HAL Id: hal-02888533
https://hal-mines-albi.archives-ouvertes.fr/hal-02888533
Submitted on 3 Jul 2020
HAL is a multi-disciplinary open access
archive for the deposit and dissemination of
sci-entific research documents, whether they are
pub-lished or not. The documents may come from
teaching and research institutions in France or
abroad, or from public or private research centers.
L’archive ouverte pluridisciplinaire HAL, est
destinée au dépôt et à la diffusion de documents
scientifiques de niveau recherche, publiés ou non,
émanant des établissements d’enseignement et de
recherche français ou étrangers, des laboratoires
publics ou privés.
In situ Raman composition profiling in drying droplets
Roger de Souza Lima, Andreas Braeuer, Patricia Arlabosse, Maria-Inês Ré
To cite this version:
Roger de Souza Lima, Andreas Braeuer, Patricia Arlabosse, Maria-Inês Ré.
In situ Raman
composition profiling in drying droplets.
Powder Technology, Elsevier, 2020, 373, pp.232-241.
In situ
Raman composition profiling in drying droplets
R. de Souza Limaa,∗, A.S. Braeuerb, P. Arlabossea, M.-I. R´ea
aUniversit´e de Toulouse, IMT Mines Albi-Carmaux, CNRS UMR 5302, Centre RAPSODEE, Campus Jarlard, 81013 Albi CEDEX 09, France bInstitute of Thermal, Environmental- and Resources’ Process Engineering (ITUN), Technische Universit¨at Bergakademie Freiberg (TUBAF),
Leipziger Strasse 28, 09599 Freiberg, Germany
Abstract
Spray drying has become a tool for engineering solid particles to meet the growing demand for better end-use par-ticulate material properties. However, this industrial process still presents scientific challenges, such as a detailed description of the components distribution during drying of multi-component droplets. In order to help overcoming such challenge, in the present work, an in situ Raman technique is applied to assess the temporal and spatial distribu-tion of the components in acoustically levitated drying droplets. Using a dextran-sucrose-water droplet with different solute proportions, different results were experimentally demonstrated: a dextran-rich surface and a sucrose-rich core in a particle; dense or bowl-like particles depending on the dextran-to-sucrose initial proportion.
Keywords: in situRaman spectroscopy, Drying droplet, Particle morphology, Composition profile, Spray-drying
1. Introduction
Spray drying is a well-established industrial process used for quickly producing fine particulate material [1–3]. It consists of atomizing a liquid feed (solution, emulsion or suspension) into droplets within a flow of hot gas (air, steam or nitrogen). The solvent is rapidly evaporated from the droplets (order of some seconds), resulting in dried solid particles.
Such drying process initially attracted attention for its capacity of rapidly producing large amounts of powder with controllable particle size, bulk density and moisture content and the possibility of drying thermal-sensitive substances, like proteins [4]. Dairy products were the first to be dried with this technology in the early 1920’s, but subsequent applications were found in other industrial fields, related to pharmaceuticals, ceramics, painting, base chemicals and optics [5–9]. However, applications of the spray drying as merely a drying process changed over the years to that of a tool for engineering solid particles with better end-use properties [10] (e.g. better controlled content release, dissolution rate or surface chemistry) and varying morphologies and physical structures [5, 11, 12] (e.g. dense or
∗
Corresponding author at: IMT Mines Albi-Carmaux, CNRS UMR 5302, Centre RAPSODEE, Campus Jarlard, 81013 Albi CEDEX 09, France Email address: [email protected] (R. de Souza Lima)
hollow cores, low density particles with controlled surface aspect, highly porous networks, hierarchical structures with nanoparticles sub-units) by manipulating operating and formulation parameters [10, 13].
The prediction of particles structure (physical spatial location of components within the particles) and morpholo-gies is a major scientific challenge regarding the spray drying process [14]. The drying process involves simultaneous heat and mass transfer, phase transition, flow and mechanical instability (during solid formation). The fast drying complicates the sampling and recording of physical phenomena taking place in each droplet during drying. To better understand the mechanisms of particle formation and thus to support and clarify the design of particles with various structures and morphologies, experimental studies are usually carried out at two different study scales [15]: the spray scale and the droplet scale.
The spray method relates changes in the drying conditions (e.g. air inlet temperature, flow rate) and liquid for-mulation (e.g. solute concentration, droplet size) to the final particle properties (e.g. porosity, morphology, surface composition, apparent density, particle size) [13, 16–18]. With this approach, it is not possible to follow every droplet morphological change during drying. In that way, the single droplet method is more appropriate. The droplet is held in place by means of an intrusive device (e.g. a thin filament or a hydrophobic surface) or by a non-invasive method (e.g. acoustic levitation, aerodynamic levitation or free-fall chamber) [19–21]. The longer drying time inherent in this approach allows tracking the droplet morphological changes. With a camera placed in front of the droplet, it has been possible to visualize the droplet’s internal flow and morphological changes [22, 23]. Also, the single droplet method has been used for following the droplet characteristics like mass and temperature [20, 24].
In addition to the physical characteristics, like droplet size, the evolution of the solute spatial distribution in the drying droplets has a major impact on the solid particle structure and morphology. Previous experimental works in the literature using electromagnetic waves (e.g. rainbow refractometry, magnetic nuclear resonance and Raman spectroscopy) focused on the evolution of the water content [25], the concentration of one volatile substance inside a liquid droplet [26, 27] and the morphology and hygroscopicity of micrometer-sized droplets [28]. The novelty in this work is to apply an in situ Raman spectroscopy [27] to assess the evolution of the spatial distribution of two solutes in drying multi-component droplets. The experiments were carried out starting from a model ternary aqueous solution composed of water (component 1) as solvent, dextran (component 2) and sucrose (component 3) as solutes. Dextran-to-sucrose mass proportions and the total dissolved solutes fraction were changed with a focus on observing the segregation of solutes during drying and the effect of formulation composition on the morphology of the resulting solid particle.
After introducing the employed Raman set-up, the methodology developed for transforming the acquired Raman spectra into dextran and sucrose composition profiles is presented. The distribution of components is observed for
two cases where dextran and sucrose do and do not spatially segregate during the drying of the single droplet.
2. Materials and methods 2.1. Reagents
Sucrose (Merck, France) and dextran T40 (Alfa Aeser, Thermo Fisher, Germany) were employed as model solutes. Dextran is a polymer with varying molecular weight produced from the fermentation of glucose. The degree of branching of this polymer is around 5 %. Most of the polymer branches are composed of one or two glucose units.
The fraction T40 corresponds to a molecular mass of approximately 40 000 g mol−1. Distilled water was used for the
preparation of the model solutions.
2.2. The acoustic levitator
The acoustic levitator used in the present work consisted of two concave surfaces containing 32 transducers each [29]. The surfaces were separated by 15 cm. A droplet could then be placed in the pressure nodes of the acoustic field produced by the transducers and be levitated, with no vertical displacement. The most stable droplet position was achieved by placing the droplet in the center of the device, as represented in Fig. 1. The frequency of the acoustic field was 40 kHz.
droplet
standing acoustic field
Concave surface Concave surface with 28 transducers pressure nodes
Figure 1: Representation of the acoustic levitator used in the present work. A droplet can be held in place in the pressure nodes originated from the acoustic field
In order to influence the degree to which the droplet is imprisoned in the acoustic field, in relation to a possible horizontal displacement, the amplitude of the acoustic field could be varied with the help of a voltage regulator. The regulator operated from 5.38 V to 12 V. The lowest used voltage (5.38 V) gives the minimum force required to suspend the droplet, in that way a spherical shape could still be obtained. However, the levitation would be very sensitive to exterior disturbances. An increase in the voltage leads to a deformation of the droplet to an ellipsoidal shape, until the point where the droplet becomes a thin disk at the highest voltage (12 V) and disintegrates. All the experiments were
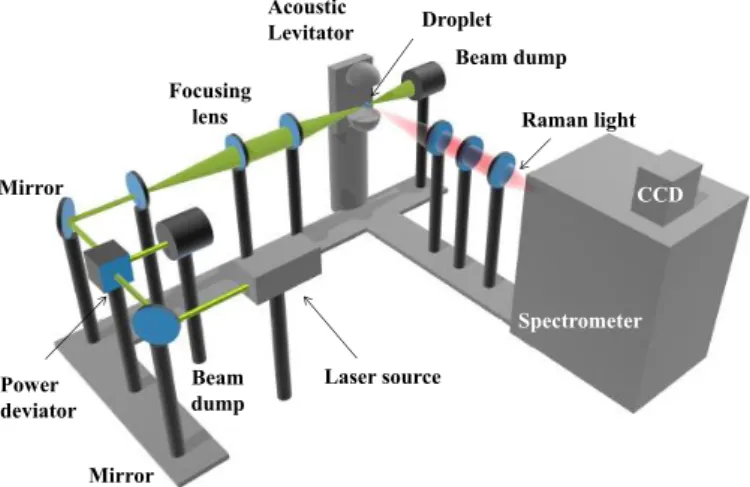
Spectrometer CCD Mirror Beam dump Beam dump Acoustic Levitator Focusing lens Mirror Power deviator Laser source Droplet Raman light
Figure 2: Sketch of the in-house engineered Raman set-up. The trajectory and diameter of the laser light is adjusted through a series of lenses in order to obtain a laser in the form of a thin cylinder inside the droplet
carried out at a voltage of 5.38 V and the droplet horizontal displacement was minimized by avoiding any ventilation or movement in the laboratory during the experiments.
2.3. The Raman set-up
A continuous wave Nd:YVO4laser was used as excitation source. It operated at 532 nm with an output power of
1 W. A set of lenses was used in order to redirect the laser trajectory and to alter its diameter before launching the laser beam through the droplet, as it can be seen in Fig. 2. The laser power could be attenuated using a polarization analyzer in combination with a half-wave plate (power deviator in Fig. 2). In order to avoid non-linear light-matter interactions inside the levitated drops, the laser excitation power was reduced to 200 mW.
After passing through a concave and a convex lens, the laser beam had its diameter expanded. A third lens then focused the laser into the levitated droplet. Around the focal point, the laser beam forms a ”focal beam waist”, which has the shape of a thin horizontal cylinder, with a diameter of approximately 0.1 mm. Along this line-shaped one-dimensional measurement volume, Raman light was scattered by the matter present in the droplet and was captured spatially resolved by an imaging spectrometer. A similar configuration has been used for the analysis of heat and mass transfer processes in vaporizing droplets without solidification [30].
The captured Raman signals were spectrally dispersed inside the spectrometer and were detected spatially and spectrally resolved by a charge coupled device (CCD)-chip. The horizontal axis of the chip is used for the spectral information on 1600 pixels. It covers the wavelength range from 550 nm to 680 nm, which corresponds to Raman shifts of 615 cm−1 to 4091 cm−1. The vertical axis is dedicated to the spatial information coming from the sample.
It possesses 400 pixels and covers 3.2 mm along the beam waist (each pixel represents then 3.2 mm/400= 8 µm). In order to enhance the signal-to-noise ratio, the pixels were binned together, forming superpixels. We used a com-bination of 10 pixels for the spatial axis (which give 40 points in space and a resulting spatial resolution of 80µm) and a combination of 2 pixels for the spectral axis (giving then 800 spectral points). The acquisition time for one measurement (40x800 points) was set to 1 s, while the time interval between two consecutive acquisitions was set as 2 s. The final result was then a set of points in time, space and for every wavelength captured by the sensor.
2.4. Single droplet drying conditions
The acoustic levitator employed in the present work provided no control over the air properties affecting the drying of the droplet (namely temperature, absolute humidity and flow). The air temperature was measured with the help of a thermocouple placed near the droplet and the absolute humidity in the laboratory was evaluated with a digital hygrometer (TP50, ThermoPro, U.S.A.). The acoustically levitated droplet dried under no forced convection and at room temperature and absolute humidity conditions (Table 1).
Table 1: The experimental conditions employed in the drying of the acoustically levitated droplet. All the experiments were carried out at the same air temperature and with no convective air flow
Exp. number Liquid composition (% wt) Drying air conditions Component 1 (water) Component 2 (dextran) Component 3 (sucrose) Temperature (◦C) Absolute humidity (g kg−1) Velocity (m s−1) (1). 90 5 5 2.4 (2). 70 15 15 19 3.5 0 (3). 70 25 5 2.4 (4). 70 5 25 4.7
Different liquid formulations were used in order to modify the droplet drying behavior. The total solute fraction (components 2 and 3) was varied between 10 % wt and 30 % wt, while the dextran-to-sucrose mass proportion changed
between 1:1, 1:5 and 5:1, as shown in Table 1. The initial droplet volume was kept constant and equal to 2µL
throughout the experiments, using a micropipette model 0.5 ± 0.02µL/10 ± 0.05 µL (Ergonomic High-Performance
Pipettor, VWR International, USA). Consequently, the initial droplet diameter used in the trials is around 1.56 mm. In order to ensure the validity of the results presented hereafter, experiments were performed with 5-mL solutions (binary or ternary) in a vial. The objective was to perfect the coupled spectrometer-CCD settings under which the Ra-man light was acquired and also the RaRa-man spectra treatment. Regarding the RaRa-man spectra treatment, the following points were used for its development: the precise evaluation of total solute mass fraction profiles from solutions in the vials with known composition and the precise prediction of the solute proportion (results not shown here). Afterwards,
trials with a levitating droplet were carried out for ensuring that the initial total solute mass fraction profiles and solute proportion in the droplet corresponded to the respective values in the stock solution. One trial with each composition shown in Table 1 could be performed with the appropriate spectrometer-CCD settings after the finalization of the Raman spectra treatment.
3. Results and discussion
3.1. Drying droplet spectra
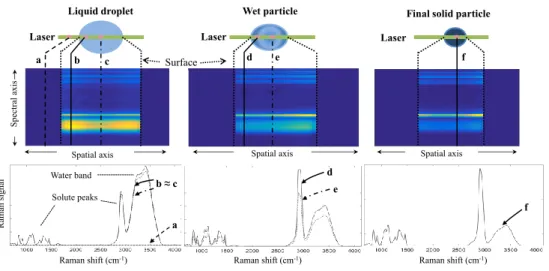
Fig. 3 illustrates the correlation of the Raman spectra acquired from the levitated droplet. The spectra were acquired from a droplet containing initially 15 % (wt) dextran and 15 % (wt) sucrose. From top to bottom, the figure illustrates the laser beam passing into the droplet/wet particle, the spectral and spatial distributions of the recorded signals and examples of spectra from the droplet/wet particle. It is possible to see in the figure that the spectra can be assigned to the droplet components, in the example, water and solutes. From left to right, the figure shows how the spectra look like according to the position in the droplet and over time. At the beginning of the drying process, the solutes (components 2 and 3) present in the liquid droplet are homogeneously distributed. As a result, the spectra obtained at the droplet surface (spectrum b) and at its center (spectrum c) look similar (this can be seen by the similar intensities of the water or the solutes peaks between these two positions in the droplet). For the sake of comparison, the spectrum a in Fig. 3 is the spectrum recorded from air outside the droplet. Due to the low density of air compared to the droplet, no Raman intensity is captured from this region at the laser power employed during the experiments. Next, as a result of the water molecules leaving the droplet in the first moments of drying, the region inside the droplet but in the vicinity of the surface becomes more concentrated in solutes, which means that the radial concentration profile of the solutes decreases inwardly. After attaining a certain critical concentration [31], a solid crust is formed at the surface of the droplet. Then the solid phase grows towards the center of the droplet as the drying progresses. From this moment on, the droplet is considered a wet particle, with a liquid core. The appearance of the crust is represented in Fig. 3 (spectrum d). By comparing with the spectrum obtained from the wet particle liquid core (spectrum e), a higher solute concentration is found at the wet particle surface due to a higher solute-to-water peaks intensity ratio. Finally, the drying process ends when the solid particle generated is in equilibrium with the surrounding air absolute humidity. At this moment, the residual water concentration profile is flat, which means that the spectra coming from the mixture of the components 2 and 3, now in solid state, are very similar throughout the particle solid structure (Fig. 3, spectrum f).
R aman si gnal Raman shift (cm-1) Spatial axis S pe ctra l a xis Liquid droplet Laser Wet particle Laser
Final solid particle Laser
a b c d e f
d e
f
Spatial axis Spatial axis
Raman shift (cm-1) a b ≈ c Raman shift (cm-1) Water band Solute peaks Surface
Figure 3: Representation of the acquired spectra at different positions in the droplet through the drying time. From left to right, (a) represents the spectrum obtained from the gaseous environment; (b) and (c) are the spectra obtained at the beginning of the drying process; (d) stands for the solid crust spectrum while the wet particle core is still liquid (e); (f) shows the spectrum obtained throughout the particle solid structure. The spectra were acquired from a droplet containing initially 15 % (wt) dextran and 15 % (wt) sucrose
3.2. Converting Raman signal to solute mass fraction
A more detailed view of the spectrum obtained from the model drying system (dextran/sucrose/water) for a given
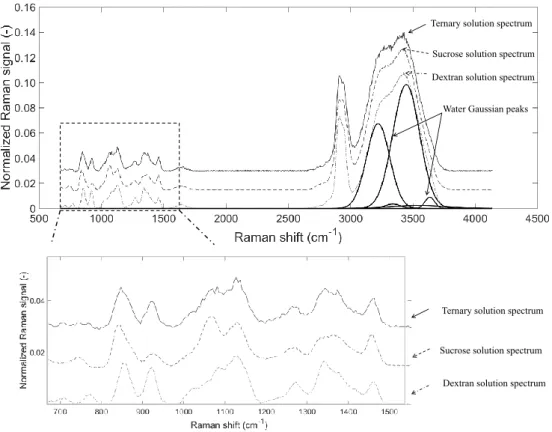
point inside the droplet at an instant t is depicted in Fig. 4 (a droplet containing 15 % (wt) dextran and 15 % (wt) sucrose was used for the example). It also shows the spectrum obtained from aqueous binary solutions of dextran or sucrose (with a solute mass fraction of 30 % (wt) each). In each spectrum in Fig. 4, the region between 805 cm−1and
1500 cm−1is called the fingerprint region and is used to individually characterize each solute present in the mixture.
For example, sucrose has a characteristic peak around 1060 cm−1, while dextran may be differentiated by the peak
around 920 cm−1. At 2780 cm−1, a peak representing the C-H bonding is intertwined with a region coming from
the water symmetric stretching vibration H-O-H that goes up to 3800 cm−1. These bands can be studied separately
through the use of Gauss functions subsequently. For the water band, for example, five Gaussian functions are used to represent it [32].
The information acquired in Fig. 4 can be used to identify the components in the droplet. In order to extract from such spectra quantitative data related to the droplet composition, the treatment applied in the present work correlates peak intensity ratios to mass ratios. This is carried out with the help of calibration curves. Peak intensity here refers to the integration of the sprectrum in a certain Raman shift range. The treatment hereafter is first presented for the creation of calibration curves from binary solutions, and then it covers the steps taken with the ternary mixture spectra. A set of binary solutions with well-defined solute fractions were prepared gravimetrically and the corresponding
Ternary solution spectrum Sucrose solution spectrum Dextran solution spectrum Water Gaussian peaks
Ternary solution spectrum
Sucrose solution spectrum Dextran solution spectrum
Figure 4: Raman spectra obtained from dextran and sucrose binary solutions (with a solute mass fraction of 30 % (wt) each) and multi-component solutions (15 % (wt) dextran and 15 % (wt) sucrose). The set of Gaussian functions representing the water band is also depicted. The spectrum is normalized to the area of the solute’s peaks comprised between 805 cm−1and 1510 cm−1
Raman spectra were measured. For sucrose, mass fraction ranges from 5 % wt to 50 % wt, while for dextran the mass fractions were limited up to 30 % wt. Regarding the treatment of the measured binary Raman spectra, firstly a baseline correction is applied and then the spectra are normalized to the area of the fingerprint region, as shown in Eq. 1, where ν is the Raman shift in the spectrum, S (ν) stands for the spectrum and Snorm(ν) stands for the normalized one. Such normalization step comes from the procedure developed for analyzing the ternary mixture spectrum.
Snorm(ν)= S(ν)
R1500 cm−1
805 cm−1 S(ν)dν
(1)
As a result of the normalization step, the integral over the fingerprint region (which corresponds then to the intensity of the solutes) is equal to unity, as shown in Eq. 2.
Z 1500 cm−1
805 cm−1
Snormfp (ν)dν= 1 (2)
normalized fitted Gaussian functions, as shown in Eq. 3. Iwater= X i Z SnormG water(ν)dν (3) Where Sn
Grepresents the normalized spectrum obtained with the Gaussian function. Next, the ratio between the
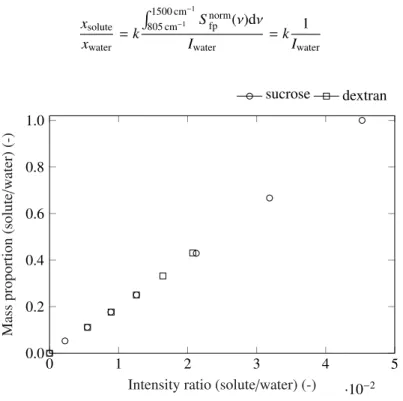
area (i.e. intensity) of the fingerprint region to the intensity of the water band is linearly correlated to the solution solute-to-water mass proportion (Eq. 4). As a result, a calibration line as shown in Fig. 5 is created for each binary solution. These calibration curves are used for the prediction of the evolving fractions of individual species once the drying droplet is a ternary solution.
xsolute xwater = k R1500 cm−1 805 cm−1 Snormfp (ν)dν Iwater = k 1 Iwater (4) 0 1 2 3 4 5 ·10−2 0.0 0.2 0.4 0.6 0.8 1.0
Intensity ratio (solute/water) (-)
Mass proportion (solute /w ater) (-) sucrose dextran
Figure 5: Calibration curve created by relating the solution mass proportion (solute-to-water proportion) to the corresponding Raman peaks ratio. The intensity ratio corresponds to the solute’s peak area (region from 805 cm−1to 1510 cm−1) to the water peak area (obtained from Gaussian deconvolution). Trials performed in duplicata
The treatment of the spectra of a ternary droplet is similar to the one used for creating the calibration curve, with the baseline correction, the normalization step and the area ratio calculation. However, an additional step is included to estimate individual species intensities from the two solutes fingerprint region. This is accomplished by using a least-square function with an active-set algorithm in MATLAB software, so that the fingerprint region peaks can be represented through a linear combination of the individual species reference peaks (Eq. 5). The reference peaks correspond to the normalized spectra measured from the 30 % wt binary solution, as the peaks are well defined.
Snormfp (ν)= αSnorm,refsolute i (ν)+ βSnorm,refsolute j (ν) (5) The resulting coefficients α and β represent the contribution of each solute to the ternary mixture spectrum. As a result of the normalization step, the area of each spectrum shown in Eq. 5 is equal to unity, thus the coefficients α and β can be constrained as shown in Eq. 6
α + β = 1 (6)
With Eq. 6, it is also possible to bound the values of the coefficients α and β between zero and one for the
least-square method. Finally, the Raman intensities related to each solute are presented in Eq. 7.
Isolute i= α Isolute j= β
(7)
Consequently, mass proportion for each solute can be calculated by considering the intensity I of each solute over the intensity of the water band and the respective calibration curve (Eq. 8).
xsolute i xwater
= kIsolute i Iwater
(8)
The mass fraction of each solute is calculated by taking into account the mass proportions from each solute and from water (Eq. 9).
xsolute i=
xsolute i/xwater
(xsolute i/xwater)+ (xsolute j/xwater)+ (xwater/xwater)
(9)
It should be noted that due to no visible difference between the solute spectra in solution or in the solid state, the calibration straight line can be used for the droplet composition estimation for the liquid droplet, but also once the solid phase is formed at higher mass fractions.
3.3. Particle morphology
As mentioned previously, the droplet drying process starts at the surface of the droplet with the water molecules leaving it and the volume of the droplet reducing consequently. The concentration of the solutes near the droplet surface increases until a solid phase is formed [33]. It should be noted that this can happen only if the mass transfer
inside the droplet is smaller than the mass transfer from the droplet surface to the bulk air. With the appearance of the solid crust and its development towards the center of the wet particle, the distribution of the components present in the droplet/wet particle evolve very slowly.
Regarding the model liquid formulations used in the present work, for instance, dextran and sucrose present distinct molecular diffusion coefficients as a result of their considerable difference in molecular size. An estimation using the Stokes-Einstein diffusion equation gives a dextran diffusion coefficient 10 times lower than that of the sucrose
(at 20◦C) [34, 35]. As a consequence, a modification in the dextran-to-sucrose mass proportions or a modification
in the total solute mass fraction could change the final component distribution in the solid particle and alter the crust properties, given that diffusion is the main mechanism controlling the transport of the solutes. The consequence could thus be a modification in the particle morphology.
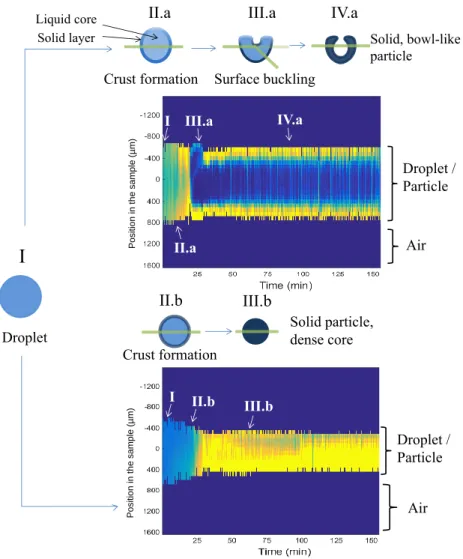
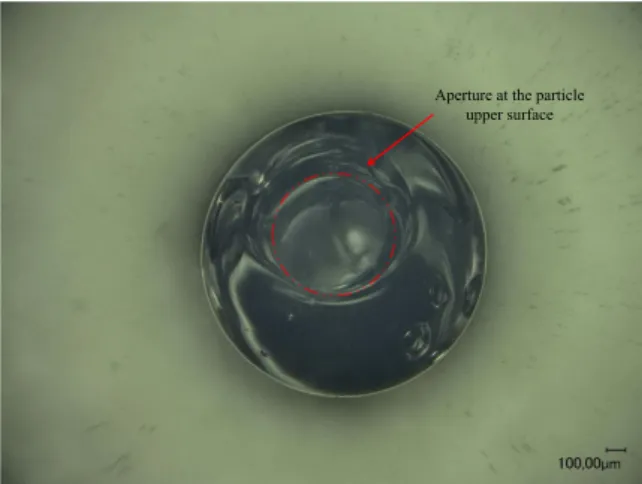
Fig. 6 shows two particle morphologies obtained in the present work (the dark blue color in the droplet represen-tations correspond to the solid phase and the laser beam is represented in green). The droplet in the experiments (1), (2) and (4) became a spherical transparent particle with a dense core, while the droplet in the experiment (3) generated a bowl-like particle, which can be seen in Fig. 7.
Fig. 6 also presents the evolution of the droplet through time as observed from the Raman line imaging technique. This representation is obtained by plotting the Raman intensity obtained from the Raman shift corresponding to the -CH group (at 2900 cm−1). This gives a qualitative view of the increase in solute concentration in the droplet (where
the yellow color represents a higher Raman intensity) and also allows the distinction between droplet and surrounding air.
Regarding the bowl-like particle obtained by drying the solution with initial mass fraction 25 % wt of dextran and 5 % wt of sucrose (trial 3 in Table 1), a closer visual inspection of the process of the core formation showed that, after 20 min of drying, the upper surface of the droplet buckles and moves downward until the point where this bending surface reaches the laser light and starts to deviate its trajectory. As a result, the droplet side facing the laser is brighter than the opposite surface. This can be seen in Fig. 6 from the change between the zones II.a and III.a. The more the buckling process continues, the more the laser light is able to cross the droplet without disturbances in the trajectory. Once both exterior and interior surfaces of the present particle are solidified (at 30 min of drying), the laser light is able to cross the particle crust. From the results shown in Fig. 6, the time interval between the moment the laser trajectory is deviated and the solidification of the interior surface is approximately 10 min.
The Raman intensities in Fig. 6 are presented for the particle with 5 % wt dextran and 5 % wt sucrose (trial 1 in Table 1). From the plot, it is possible to observe a liquid phase at the beginning of the drying process, but also a solid structure after 50 min of drying, which would confirm the presence of a compact solid particle (dense core). The laser
I II.b III.b
I
Droplet I II.a III.a IV.aII.b
III.b
Solid particle, dense coreII.a
III.a
Solid, bowl-like particleIV.a
Crust formationCrust formation Surface buckling
P osi ti on i n t he sampl e ( µm ) P osi ti on i n t he sampl e ( µm ) Droplet / Particle Droplet / Particle Air Air Liquid core Solid layer
Figure 6: Schematic representation of the particle morphologies obtained in the present work: a bowl-like particle and a particle with a dense core. Additionally, a qualitative view of the evolution of droplet through time is represented by plotting the Raman intensity measured at the CH band (2900 cm−1). The yellow color represents a higher Raman intensity. The dark blue color in the droplet representations correspond to the solid phase. The laser beam is represented in green
light is slightly darker at the particle side opposite to the one facing the laser around 100 min. This comes from the fact that the laser beam loses intensity after passing through the solid structure.
3.4. Total solid mass fraction evolution
In Fig. 8, the total solid mass fraction profiles are presented for the formation of the dense particle from trial 2 in Table 1 (with 15 % wt dextran and 15 % wt sucrose). In this figure, the mass fraction profiles are aligned at the center of the droplet. It is possible to observe the spatial evolution of the total solute fraction from the liquid droplet up to a dense solid state. It is noteworthy that the duration of the drying experiments was set in order to obtain, at the end of the experiment, a solid particle that tended to be in equilibrium with the surrounding air.
Aperture at the particle upper surface
Figure 7: Optical micrograph illustrating the bowl-like particle produced from the mixture 25 % wt dextran and 5 % wt sucrose. The small aperture at the upper surface of the solid particle is indicated by the arrow
As can be observed in Fig. 8, the initial mass fraction profile is a flat, horizontal line, as expected when the composition inside the droplet is homogeneous. As the water is removed from the surface, there is a solute enrichment near the droplet surface (Fig. 8, starting at 3 min). As to counteract the creation of such concentration gradient, the dissolved solutes will tend to diffuse towards the center of the droplet. In the present work, even though the employed drying conditions are mild, which would make the solutes inward diffusing process as important as the drying rate, it is possible to observe the solute enrichment of the surface (Fig. 8 at 3 and 8 min).
However, as the crust is formed at the liquid-air interface (Fig. 8 at 13 min), a new barrier for the drying process is created, which will reduce the surface water activity. After the crust formation, the drying rate will decrease progressively. Consequently, the diffusion of the solutes towards the droplet center becomes prominent in definition
of the subsequent mass fraction profiles, which is observed as a reduction in the solute mass fraction difference
between the center to the surface of the wet particle (Fig. 8 at 18 min). At the end of the drying process, the mass fraction profile, on a dry basis, will be a flat profile, similarly to the beginning of the experiment (Fig. 8 at 2 h 4 min and 2 h 55 min).
In Fig. 9 the total solid mass fraction profiles are presented for the formation of the bowl-like particle from trial 3 in Table 1 (with 25 % wt dextran and 5 % wt sucrose). The initial profiles are like the ones presented for the dense particle formation, where the surface becomes rich in solute as the drying process progresses (Fig. 9 at 8 min and 11 min). However, as visualized previously in the image acquired with the spectrometer, the upper wet particle surface will start to buckle and move inward (the beginning of such motion can not be seen in the profiles obtained in the present work, since the laser only passes through the center of the droplet). This process alters the laser trajectory and the center of the sample and thus, affect the evaluation of the mass fraction points. That explains why in Fig. 9,
-1.2 -0.8 -0.4 0 0.4 0.8 1.2 0 0.2 0.4 0.6 0.8 1
Position in the droplet (mm)
T
otal
components
mass
fraction(-)
0 min 3 min 8 min
13 min 18 min 33 min
45 min 50 min 1 h 40 min
2 h 4 min 2 h 55 min
Figure 8: Total solute mass fraction profiles during the drying of the droplet with the formation of a dense particle. The initial composition is 15 % wt dextran and 15 % wt sucrose (trial 2)
the plotted points at 20 min of drying correspond to the droplet surface facing the laser. The subsequent compositions were too noisy and thus were kept out the present figure. Only after the solidification of the interior surface (at 36 min), the mass fraction points in the solid structure could be calculated.
-1.2 -0.8 -0.4 0 0.4 0.8 1.2 0.2 0.4 0.6 0.8 1
Position in the droplet (mm)
T otal components mass fraction (-)
0 min 3 min 8 min 11 min
13 min 15 min 20 min 21 min
36 min 50 min 2 h 55 min
Figure 9: Total solute mass fraction profiles during the drying of the droplet with the formation of a bowl-like particle. The initial composition is 25 % wt dextran and 5 % wt sucrose (trial 3)
3.5. Individual species mass fraction evolution
In this section, two distinct cases are presented, the first one where both solutes dry as one single constituent (trial 2 in Table 1 - 15 % wt dextran and 15 % wt sucrose) and the second one with species segregation (trial 1 in Table 1 - 5 % wt dextran and 5 % wt sucrose). As a reminder, the evaluation of the individual components mass fraction is achieved through a least-square method as described previously and the total solutes Raman intensity is a result of a linear combination of the individual solutes.
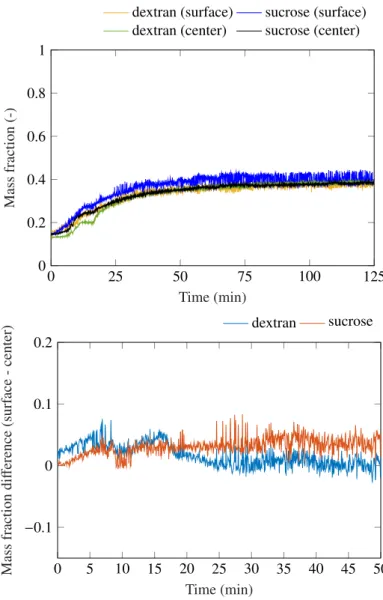
In Fig. 10, it is possible to observe the evolution of the mass fraction of dextran and sucrose in the center (central point in the mass fraction profile) and at the surface (outermost point in the mass fraction profile) from the initial liquid formulation composed of 15 % wt dextran and 15 % wt sucrose (trial 2 in Table 1). In order to detect an eventual separation between the components, the difference between the mass fractions at the surface and at the center of the droplet for each solute was also plotted against the drying time. This plot was created only for the first 50 min of drying, as the solid particle is surely formed after that time and the solutes are fixed in the solid structure. As can be observed from Fig. 10, both dextran and sucrose become slightly more concentrated at the surface in the first 15 min, as a result of drying process (the formation of a concentration gradient from both solutes was highlighted in Fig. 8 as well). However, both solutes seem to be following the same rate for increasing the difference between the mass fraction at the surface and at the center of the liquid phase, and thus a clear separation between the solutes can not be stated. They appear then to be drying as one single solute in the droplet. The slight decrease in dextran mass fraction difference from 25 min to 50 min can be due to the uncertainty in the measure data.
In Fig. 11, however, a much stronger difference between the mass fractions at the surface and at the center of
the droplet can be observed in the experiment with 5 % wt dextran and 5 % wt sucrose (trial 1 in Table 1). As the results are presented in the form of mass fractions, the creation of zones with higher values of mass fractions would
then represent a component segregation. The difference observed between these experiments can be explained by the
initial solution concentration (and consequently, the diffusion coefficient of the solutes in the solution) and the time for the formation of a wet particle. The droplet from trial 1 contains a lower total solute fraction (10 % wt) than the droplet from trial 2 (30 % wt). Furthermore, the initially less concentrated droplet takes a longer drying time before attaining the supersaturated concentration necessary for the formation of the solid particle. This contributes for a higher time in the diffusive process of the solutes inside the droplet in the trial 1. The parameter here leading to a separation between the components was the total solute mass fraction. For the other experiments developed in the present work, no solute segregation was observed.
With the aim of demonstrating the creation of a region richer in one of the solutes present in the droplet, mass fraction profiles for the total solids, dextran and sucrose were represented in Fig. 12 by choosing a random drying
0 25 50 75 100 125 0 0.2 0.4 0.6 0.8 1 Time (min) Mass fraction (-)
dextran (surface) sucrose (surface)
dextran (center) sucrose (center)
0 5 10 15 20 25 30 35 40 45 50 −0.1 0 0.1 0.2 Time (min) Mass fraction di ff erence (surf ace -center) dextran sucrose
Figure 10: Evolution of the individual species mass fraction at the surface (outermost point in the mass fraction profile) and center (central point in the mass fraction profile) of the droplet for the experiment with 15 % wt dextran and 15 % wt sucrose (trial 2). The plotted component segregation is represented as a difference between the mass fraction at the surface and at the center of the droplet
time in the trial 1 (5 % wt dextran and 5 % wt sucrose). These profiles correspond to 28 min of drying. At this point, sucrose is homogeneously distributed in the liquid phase, while dextran already presents a higher concentration at the droplet surface. As mentioned previously, sucrose has a greater diffusion coefficient than dextran, which allows this molecule to diffuse more easily in the liquid phase while being carried towards the surface of the droplet by the water molecules.
Regarding the component distribution in the droplet and the influence of the acoustic levitator, the acoustic levi-tators employed in the literature generate a droplet rotation about both vertical and horizontal axis [24, 36]. Because
0 25 50 75 100 125 0 0.2 0.4 0.6 0.8 1 Time (min) Mass fraction (-)
dextran (surface) sucrose (surface)
dextran (center) sucrose (center)
0 5 10 15 20 25 30 35 40 45 50 −0.1 0 0.1 0.2 Time (min) Mass fraction di ff erence (surf ace -center) dextran sucrose
Figure 11: Evolution of the individual species mass fraction at the surface (outermost point in the mass fraction profile) and center (central point in the mass fraction profile) of the droplet for the experiment with 5 % wt dextran and 5 % wt sucrose (trial 1). The plotted component segregation is represented as a difference between the mass fraction at the surface and at the center of the droplet
the spatial distribution of the droplet components is dependent on the flowfield inside the liquid phase, the presence of a centrifugal force could have an impact on the distribution of the solutes [24, 37, 38]. In those cases, the frequency employed in the acoustic levitator was in the order of 100 kHz. However, in the present work the frequency employed is less than half of that. As a result, no rotation was observed within the liquid droplet at the beginning of the drying process. The rotating motion could be detected only after the solid particle was formed. Thus, the acoustic field in the present work did not influence, by centrifugal force, the solute profiles presented previously, as the rotating motion only appeared when the solutes were already fixed in the particle solid structure.
Mass fraction (-)
Droplet
Position in the droplet Dextran Sucrose Total 0 80 160 240 320 400 480 0.2 0.3 0.4 0.5 0.6
Position in the droplet (µm)
Mass
fraction
(-)
Total solids Sucrose Dextran
Figure 12: Mass fraction profiles taken at 28 min for the experiment with 5 % wt dextran and 5 % wt sucrose (trial 1). At this stage, the droplet surface is starting to have a higher dextran concentration while sucrose is homogeneously dispersed in the liquid medium
4. Conclusion
An in situ Raman technique was developed for following the drying of a multi-component droplet containing dextran and sucrose. The technique was applied to provide spatially and temporally distributed mass fraction profiles for each of these solutes in an acoustically levitated drying droplet. For doing so, the measured Raman light from the multi-component mixture had to be dissociated as a combination of the Raman light from each solute.
The developed set-up could provide information about the generated particle morphology. By changing the dextran-to-sucrose mass proportion, the production of a solid particle with a dense core or a bowl-like particle could be observed in the measured Raman spectra. Most importantly, the set-up could capture a fraction of the process of the bowl-like particle formation.
dextran-to-sucrose initial proportion) on solute segregation was stated within the resulting solid particle. The Raman technique employed in the present work opens a new path for studies related to multi-component solid particles from drying droplets. A whole new set of components may be used in the studies with the present in situ Raman technique and the mass fraction profiles may be acquired from droplet under harsher drying conditions. It should be noted that an adjustment in the data acquisition time, the laser power and wavelength should be cared for as well.
References
[1] P. Schuck, R. Jeantet, B. Bhandari, X. D. Chen, I. T. Perrone, A. F. de Carvalho, M. Fenelon, P. Kelly, Recent advances in spray drying relevant to the dairy industry: A comprehensive critical review, Drying Technology 34 (2016) 1773–1790.
[2] A. Sosnik, K. P. Seremeta, Advantages and challenges of the spray-drying technology for the production of pure drug particles and drug-loaded polymeric carriers, Advances in Colloid and Interface Science 223 (2015) 40–54.
[3] S. Keshani, W. R. W. Daud, M. M. Nourouzi, F. Namvar, M. Ghasemi, Spray drying: An overview on wall deposition, process and modeling, Journal of Food Engineering 146 (2015) 152–162.
[4] K. Masters, Spray Drying Handbook, 5th editio ed., Longman Scientific & Technical, 1991.
[5] R. Vehring, Pharmaceutical particle engineering via spray drying, Pharmaceutical Research 25 (2008) 999–1022.
[6] A. Paudel, Z. A. Worku, J. Meeus, S. Guns, G. van den Mooter, Manufacturing of solid dispersions of poorly water soluble drugs by spray drying : Formulation and process considerations, International Journal of Pharmaceutics 453 (2013) 253–284.
[7] S. M. Thaker, P. A. Mahanwar, V. V. Patil, B. N. Thorat, Synthesis and Spray Drying of Water-Redispersible Polymer Synthesis and Spray Drying of Water-Redispersible Polymer 3937 (2010).
[8] M. Pal, L. Wan, Y. Zhu, Y. Liu, Y. Liu, W. Gao, Y. Li, G. Zheng, Scalable synthesis of mesoporous titania microspheres via spray-drying method, Journal of Colloid And Interface Science 479 (2016) 150–159.
[9] F. Iskandar, Nanoparticle processing for optical applications – A review, Advanced Powder Technology 20 (2009) 283–292. [10] M.-I. R´e, Formulating Drug Delivery Systems by Spray Drying, Drying Technology 24 (2006) 433–446.
[11] S. Zellmer, G. Garnweitner, T. Breinlinger, T. Kraft, C. Schilde, Hierarchical Structure Formation of Nanoparticulate Spray-Dried Composite Aggregates, ACS Nano 9 (2015) 10749–10757.
[12] A. B. D. Nandiyanto, K. Okuyama, Progress in developing spray-drying methods for the production of controlled morphology particles: From the nanometer to submicrometer size ranges, Advanced Powder Technology 22 (2011) 1–19.
[13] M. Munoz-Ibanez, M. Nuzzo, C. Turchiuli, B. Bergenståhl, E. Dumoulin, A. Millqvist-Fureby, The microstructure and component distribution in spray-dried emulsion particles, Food Structure 8 (2016) 16–24.
[14] M. A. I. Schutyser, E. M. Both, I. Siemons, E. M. J. Vaessen, L. Zhang, Gaining insight on spray drying behavior of foods via single droplet drying analyses, Drying Technology 37 (2019) 525–534.
[15] R. de Souza Lima, M.-I. R´e, P. Arlabosse, Drying droplet as a template for solid formation: A review, Powder Technology 359 (2020) 161–171. doi:https://doi.org/10.1016/j.powtec.2019.09.052.
[16] D. A. LeClair, E. D. Cranston, Z. Xing, M. R. Thompson, Optimization of Spray Drying Conditions for Yield, Particle Size and Biological Activity of Thermally Stable Viral Vectors, Pharmaceutical Research 33 (2016) 2763–2776.
[17] J. Bahadur, D. Sen, S. Mazumder, B. Paul, H. Bhatt, S. G. Singh, Control of buckling in colloidal droplets during evaporation-induced assembly of nanoparticles, Langmuir 28 (2012) 1914–1923.
[18] X. Li, N. Anton, T. M. C. Ta, M. Zhao, N. Messaddeq, T. F. Vandamme, Microencapsulation of nanoemulsions: novel Trojan particles for bioactive lipid molecule delivery., International journal of nanomedicine 6 (2011) 1313–1325.
[19] E. M. Both, A. M. Karlina, R. M. Boom, M. A. I. Schutyser, Morphology development during sessile single droplet drying of mixed maltodextrin and whey protein solutions, Food Hydrocolloids 75 (2018) 202–210.
[20] N. Fu, M. W. Woo, X. D. Chen, Single Droplet Drying Technique to Study Drying Kinetics Measurement and Particle Functionality: A Review, Drying Technology 30 (2012) 1771–1785.
[21] C. Sadek, P. Schuck, Y. Fallourd, N. Pradeau, C. Le Floch-Fou´er´e, R. Jeantet, Drying of a single droplet to investigate pro-cess–structure–function relationships: a review, Dairy Science and Technology 95 (2015) 771–794.
[22] S. Manukyan, H. M. Sauer, I. V. Roisman, K. A. Baldwin, D. J. Fairhurst, H. Liang, J. Venzmer, C. Tropea, Imaging internal flows in a drying sessile polymer dispersion drop using Spectral Radar Optical Coherence Tomography (SR-OCT), Journal of Colloid and Interface Science 395 (2013) 287–293.
[23] C. Sadek, P. Schuck, Y. Fallourd, N. Pradeau, R. Jeantet, C. Le Floch-Fou´er´e, Buckling and collapse during drying of a single aqueous dispersion of casein micelle droplet, Food Hydrocolloids 52 (2016) 161–166.
[24] A. Saha, S. Basu, R. Kumar, Particle image velocimetry and infrared thermography in a levitated droplet with nanosilica suspensions, Experiments in Fluids 52 (2012) 795–807.
[25] J. D. Griffith, A. E. Bayly, M. L. Johns, Magnetic resonance studies of detergent drop drying, Chemical Engineering Science 63 (2008) 3449–3456.
[26] F. Lemoine, G. Castanet, Temperature and chemical composition of droplets by optical measurement techniques: A state-of-the-art review, Experiments in Fluids 54 (2013).
[27] J. Qui˜no, T. Hellwig, M. Griesing, W. Pauer, H. U. Moritz, S. Will, A. Braeuer, One-dimensional Raman spectroscopy and shadowgraphy for the analysis of the evaporation behavior of acetone/water drops, International Journal of Heat and Mass Transfer 89 (2015) 406–413. [28] B. J. Dennis-smither, K. L. Hanford, N.-o. A. Kwamena, R. E. H. Miles, J. P. Reid, Phase , Morphology , and Hygroscopicity of Mixed Oleic
Acid/ Sodium Chloride / Water Aerosol Particles before and after Ozonolysis, The Journal of Physical Chemistry (2012) 6159–6168. [29] A. Marzo, A. Barnes, B. W. Drinkwater, TinyLev: A multi-emitter single-axis acoustic levitator, Review of Scientific Instruments 88 (2017)
85105.
[30] A. Braeuer, O. S. Knauer, J. Qui˜no, A. Leipertz, Quantification of the mass transport in a two phase binary system at elevated pressures applying Raman spectroscopy: Pendant liquid solvent drop in a supercritical carbon dioxide environment, International Journal of Heat and Mass Transfer 62 (2013) 729–740.
[31] C. S. Handscomb, M. Kraft, A. E. Bayly, A new model for the drying of droplets containing suspended solids, Chemical Engineering Science 64 (2009) 628–637.
[32] C. Holzammer, A. Finckenstein, S. Will, A. Braeuer, How Sodium Chloride Salt Inhibits the Formation of CO2 Gas Hydrates, The Journal of Physical Chemistry B 120 (2016) 2452–2459.
[33] M. Mezhericher, A. Levy, I. Borde, Multi-Scale Multiphase Modeling of Transport Phenomena in Spray-Drying Processes, Drying Technol-ogy 33 (2014) 2–23.
[34] M. Mathlouthi, P. Reiser, Sucrose: Properties and Applications, 1 ed., 1995.
[35] Y. Rong, Probing the structure of dextran systems and their organization, Ph.D. thesis, The State University of New Jersey, 2008.
[36] A. Saha, S. Basu, R. Kumar, Velocity and rotation measurements in acoustically levitated droplets, Physics Letters, Section A: General, Atomic and Solid State Physics 376 (2012) 3185–3191.
(1995) 256–270.
[38] Y. Wei, W. Deng, R. H. Chen, Effects of internal circulation and particle mobility during nanofluid droplet evaporation, International Journal of Heat and Mass Transfer 103 (2016) 1335–1347.