E L S E V I E R Chemical Physics 191 (1995) 333-346
Chemical
Physics
The dissociative ionization of
C2H 2
and
C2D 2.
The [ CH (CD) ] + dissociation channel.
The H (D) C - C (D) H binding energy
M. Davister, R. Locht *
Ddpartement de Chimie Gdndrale et de Chimie Physique, lnstitut de Chimie. Bdt. B6, UniversiM de Liege, Sart-Tilman par B-4000 Libge l, Belgium
Received 8 September 1994
Abstract
The dissociative electroionization of C2H2(C2D2) has been investigated in CH + (CD + ) dissociation channel. The translational energy distribution of the fragment ion has been examined as a function of the electron energy between 20 and 99 eV. The first differentiated ionization efficiency curve has been measured for KE(CH + ) = 0.0-6.0 eV. Threshold energies of Ctt + and CD + have been measured and the effect of isotopic substitution is discussed. From the lowest onset of both CH + and CD +, and from the kinetic energy measurements, the C - C bond strength has been derived, i.e. Do(itC--CH) = 9.83 + 0.10 eV. Higher appear- ance energies are assigned and reaction mechanisms are proposed. Above 34 eV electron energy, the CH + ions carrying 2.0- 5.5 eV kinetic energy are produced through Coulomb explosion of C2 H22 + states.
1. Introduction
In the framework o f our dissociative electroioniza- tion study of polyatomic molecules, we recently reported about the investigation of these phenomena in acetylene [ 1 ]. The H + and C2 H+ dissociation chan- nels were examined. A detailed discussion o f the H +- and C2H +-producing mechanisms between 18 and 40 eV impinging electron energy has been presented. A value o f the dissociation energy D(H-C2H) has been proposed.
Though most of the dissociative ionization data in acetylene are related to the appearance o f C2H +, a few investigations included the observation o f CH + ions by both electron impact and photoionization mass spec- trometry. This ion represents about 3.5% o f the total * Corresponding author.
0301-0104195/$09.50 © 1995 Elsevier Science B.V. All rights reserved SSD! 0 3 0 1 - 0 1 0 4 ( 94 ) 003 69-6
ionization in the CeHe mass spectrum recorded with 70 eV electrons.
Most of the experimental results about the CH ÷ pro- duction from C2H2 are available from electron impact, i.e. from electroionization mass spectrometry [2-7], dipole ( e - , e - ) spectroscopy and ( e - , e - + ion) coin- cidence spectroscopy [ 8 ]. To our knowledge, only one photoionization experiment reported about the CH + formation from C2H2 and has been published by Hayaishi et al. [9]. All these experiments investigated the ionization efficiency curves, measured branching ratios and oscillator strength [ 8 ] and threshold energies [2-9]. Beenakker and De Heer [ 10] investigated the dissociative excitation of Cell2 into the CH radical by electron impact. They observed the fluorescence o f CH and measured the threshold energy for emission. Excepting the work of Haney and Franklin [ 11 ], none of these experiments included ion translational energy
334 M. Davister, R. Locht / Chemical Physics 191 (1995) 333-346
distribution measurements. The work of Kloster- Jensen et al. [ 12] was focussed on the determination of the bond dissociation energy of X C - C H and XC=CY (X and Y = H, F, C! and Br). They explicitly assumed no kinetic energy to be involved in the dis- sociation processes.
The aim of this work is to report about the investi- gation of the dissociation channel leading to CH ÷ (CD + ) from C2H2 (C2D2) including the measurement of the excess translational energy of the fragments as a function of the impinging electron energy. The main interest of the isotopic substitution is that the isotope effect could bring information on the dynamics of the dissociation and on the internal energy content of the dissociation products.
The conditions of recording the first differentiated ionization efficiency curves are the same as described earlier [ I ]. The appearance energies and kinetic ener- gies reported in the following sections are averaged values and the errors and drawn error bars are given by the standard deviation. In the kinetic energy ( K E ) ver- sus appearance energy (AE) diagrams linear regres- sions are fitted to the experimental data points. The correlation coefficient " r " characterizing these fits is used to calculate the error on both the slope " a " and the extrapolation " b " to zero-kinetic energy KE = 0.0 eV by the equations [ 1 ]
o'a = /---2 - 1 for or. = O'a x~.
V n - z i = l
2. Experimental. Data handling and error
estimation 3. Experimental results
The experimental technique used in this work has been described elsewhere [ 13,14]. Briefly, the ions produced in a Nier-type ion source by the impact of energy controlled electrons are allowed to drift out of the ion chamber, are focussed on the ion source exit hole, energy analyzed by a retarding lens and mass selected in a quadrupole mass spectrometer. The detected ion current is continuously scanned as a func- tion of either the electron energy at fixed retarding potential settings VR or the retarding potential at fixed electron energy E¢. Both signals are electronically dif- ferentiated. Most of the experimental parameters are computer controlled.
The experimental conditions are identical to those described previously [ ! ] and the same precautions are maintained to keep the background signal as low as possible. Acetylene-h2 is of 99.997% purity (under high pressure added with 1% acetone) and acetylene- d2 is 99 at% purity (under 1 atm and acetone-free).
The maximum of the C2H~ ion energy distribution is taken as the zero-kinetic energy scale calibration point. The appearance energy of N +/N2 at 24.294 eV [ 15] and the ionization energy of N, +/N2 at 15.581 eV [ 15] are used for the electron energy scale calibra- tion. When mass m / e interference exists, i.e. for CD + and N 4, the ionization energy of Ne at 21.564 eV [ 16] and/or of C2D2 at 11.403 eV [17] (as an internal standard) is used.
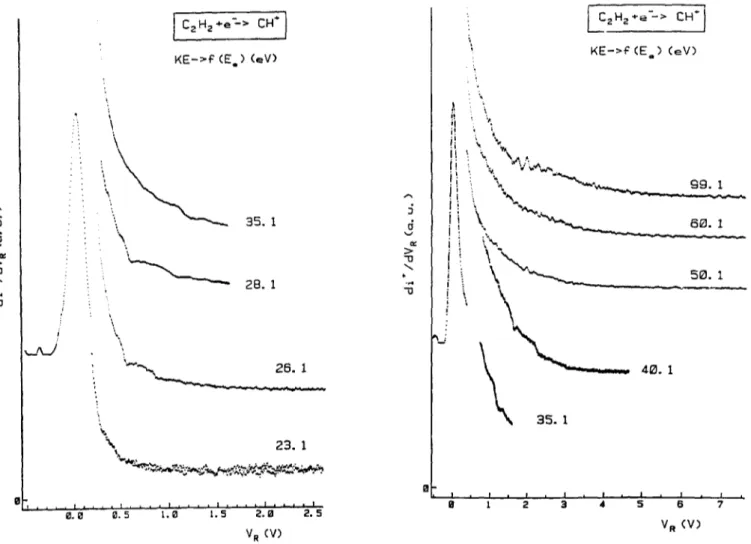
Typical first differentiated retarding potential curves of CH +/C2H2 are displayed in Figs. 1 and 2. The CH 4 ion kinetic energy distributions observed at and close to the threshold are represented in Fig. 1. At the onset, this distribution has a maximum measured at 0.025 +0.008 eV and its F-~HM is of 180 meV, broader than lhe purely thermal C2 H~ distribution with a F W H M = 1 0 0 meV. These peak characteristics remain constant up to 21.1 eV electron energy. At 22.1 e V a new weak structure is observed with a maximum at 300 meV ion energy, for which the intensity increases with increasing electron energy. For higher electron energies up to 99 eV (see Fig. 2) several supplementary distributions are observed between 0.45 and 2.0 eV ion translational energy. An appearance energy range could be determined for each structure. Above 40 eV electron energy the CH ÷ ion energy distribution spreads up to 8.0 cV kinetic energy.
The same distributions were observed for C D + / C2D2. Having the same characteristics, they have not been reproduced here.
The first differentiated ionization efficiency curves of CH ÷ were measured at different retarding potential settings VR ranging from 0.0 to 6.0 V. A sample of these curves is shown in Fig. 3. In the absence of retard- ing field applied to the ion beam, the first differentiated ionization efficiency curve of CH ÷ shows several threshold energies, i.e. at 20.83 ___ 0.05, 21.84_ 0.04,
114. Davister, R. Locht / Chemical Physics 191 (1995) 333-346 335 5 v i , " D • / : : - ~-.,y .-. ! ;4 A , ; " [ C2H~.÷e-->' CH*J KE->~' (E.) (eV)
',.~;~'~ "'~i,-'.~;. -.. r~ 22. 1 ~ . , _ .... . • ~ , ~ . ~ . 2 7 ~ : : . . 7 , , . . , ' : . % :' ' ~' 21. 1 ~,.-....w-'-- " :. ... 2 .-, '.- :. " : - u "'- " . . " , ~ . , , . , - . , " . " . : " • c k~ :~\ 20.6 ';-~[~¢,,. 213. I i i : i I i I i ~ I i i J i I - a . 5 ~ . 6 ta. 5 l . fl V a ( V ) Fig. I, T h e first d i f f e r e n t i a t e d r e t a r d i n g p o t e n t i a l c u r v e s o f C H ÷1 C2H,, c l o s e b e l o w a n d a b o v e t h e a p p e a r a n c e e n e r g y .
24.9_+ 0.3 and 33.8_+ 0. ! eV successively. It has to be stressed that the intensity corresponding to the latter onset drastically decreases with increasing retarding potential.
The onset energies, measured in the first differenti- ated ion yield curves, are plotted as a function of the retarding potential settings ranging from 0.0 to 6.0 eV increased by 0.1 eV steps. A KE-AE diagram is obtained and is displayed in Fig. 4, covering the 20--46 eV electron energy range.
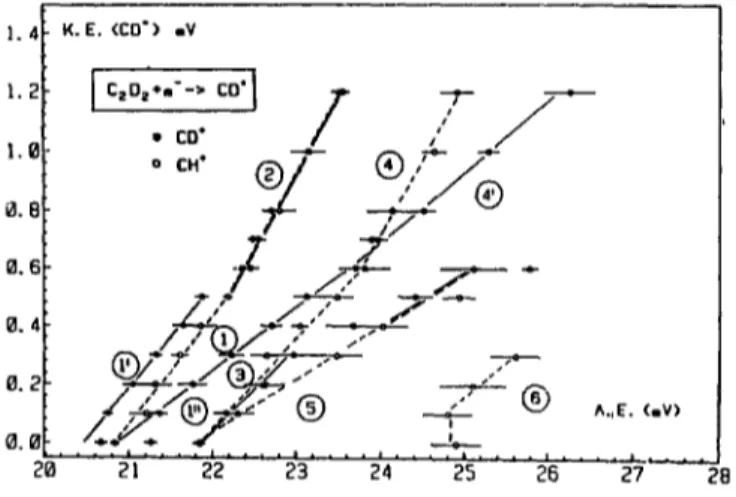
For CD + a sample of first differentiated ionization efficiency curves is reproduced in Fig. 5. Below 33 eV threshold energies were measured at 20.61_+0.07, 21.26 -I- 0.08 and 21.84 _+ 0.07 eV. The result of plotting the onset energies as a function of the retarding poten- tial VR is shown in Fig. 6 between 0.0 and 1.4 eV translational energy carried by the CD ÷ ions. For corn-
parison, the results related to CH ÷ are included in the same figure.
4 . D i s c u s s i o n
To clarify the following discussion, the most impor- tant data used in this work to calculate onset energies for dissociative ionization and dissociative excitation processes giving rise to CH + are gal.hered in Table 1. Ionization energies of C2H2 are included in the same table.
The lowest threshold energy observed for CH + is measured at 20.83 + 0.05 eV when no retarding poten- tial is applied. This energy fits on a straight line extend- ing from KE = 0.0 to 0,5 eV. The linear regression fitted to these data points, represented by the straight line ( 1 ) in Fig. 4, has a co,elation coefficient of 0.992. The extrapolation value corresponding to the onset for K E = 0 . 0 eV is 20.85_+0.05 eV and the slope is 0.39+0.02. It has to be remembered that close to threshold the translational energy carried away by CH + has been measured, i.e. KE=0.025_+0.008 eV or 0.050+_0.018 eV in terms of total kinetic energy involved in the dissociation process.
This onset has to be compared with previous results obtained by electroionization mass spectrometry: 22.2_+0.5 eV [2], 21.68 eV [3], 22.55 eV [5], 23.l eV [6], 20.544-0.05 eV [7], 20.0-+ 1.0eV 38], 21.94 eV [ 11 ] and 21.5 eV [ 12]. By dissociative photoion- ization mass spectrometry the first onset is measured at 20.7 eV [9]. The dissociative excitation of C~H2 pro- ducing CH(A 2A) has been investigated as a function of the electron energy by Beenakker and De Heer [ 10]. The lowest onset for the appearance of this species has been observed at 13.0-+ 1.5 eV. Using the data of Table 1, a threshold of 20.77 + 1.5 eV is deduced for the CH + formation.
The comparison is made difficult because of the fairly large scattering of the results and most of the existing values are reported without error limits. The onset at 22.2_+0.5 eV reported by Kusch et al. [2] is 1.4 eV and the other values [3,5,6,11,12] are at least 0.7 eV above the threshold measured in this work. These have very likely to be related to higher energetic processes, as will be discussed below.
Though outside the reported error limits, two critical energies fall in a range suitable for comparison, i.e.
336 M. Davister. R. l.ocht I Chemical Physics 191 (1995) 333-346 v @¢ > " x t i
]
CzHz
"e-->CHI'
]
KE->~
(E.)
(eV)
\ .1 - : \ :
\
!\
\ 35. 1 g "I3 2 5 . 1 k \ 23. I i d I I Ii
i i f t I Cz Hz +e---> C H ' j KE->~ e ( E ° ) (eV) : % \ • " ~ " ' ~ . " ~ g . I . 6El. 1 \ [] ! t i I ! I J i , t . . . . ~ . . . ' l l @ J . , , = . . . . I . . . . t 0 1 2 3 4 5 D 7 @ . e 0 . 5 } . = ~ P . [ ] 2 . ~ V R (V) V R (V)Fig. 2. The first differentiated retarding potential curves of CH + / C 2 H 2 as observed for 23-99 eV electron energy.
20.54+0.05 eV by electron impact [7] and 20.7 eV by photoionization [9]. The threshold deduced from dissociative excitation experiments [10], i.e. 20.8 + 1.5 eV, could also be considered as being in reasonable agreement.
The first onset measured for CD + is at 20.61 +0.07 eV. The translational energy is lower than the uncer- tainty of 10 meV, i.e. less than 20 meV in terms of total translational energy. The straight line (1') in Fig. 6 is characterized by a correlation coefficient of 0.999. Starting at 20.61 eV, it extrapolates at 20.47 + 0.02 eV with a slope of 0.35 :l: 0.01.
Comparing the KE-AE diagram of both CH + and CD + related to the first onset (see Fig. 6), the slopes and translational energy ranges are identical. In spite of the overlap of a few error bars, the data points related to CD + are systematically lower than those measured for CH +. This systematic displacement seems to have a physical meaning for two other reasons: (i) the very
good correlation coefficients for both straight lines ( 1 ) and ( 1 ') and (ii) the very good agreement between the ,Jtraight lines (2). Both data show a tG,al overlap over the whole range of KE(CH +, CD + ) = 0.5-1.2 eV. A systematic error on the first onsets would have led to a
comparable error•f the same sign on the measurement
of the second thresholds.
The lowest threshold giving rise to CH + from C2He should produce the fragments in their ground vibronic states, i.e.
C2H 2 + e - -*CH+ (X i~ +, v=O)
+CH(X21J, v = 0 ) + 2 e - .
(i)
Taking into account only the lowest onset energy meas- ured for CH + and CD + at KE = 0.0 eV an average value of 20.65 + 0.20 eV is obtained. However, consid- ering the difference observed between CH + and CD + as significant, this threshold should be of 20.47 + 0.02
M. Davister, R. Locht/ Chemical Physics 191 (1995) 333-346 337 v J --j eL IB I c z H 2 +e----> CH"
I
I EC- >'F (V a
)/
0.1 V
0.5V
~ I /
1.8V
23 28 33 38E.
(eV) v J -O "N. l'.,,, I[
C2H2+e-'-> CH" ] / I EC->~ (V R ) ) / "/
/
,
,
/
a¢~
[.~/
'~" ~ . /
~ " ~ - * ~
/ 5 . 5 v.
. . . ,@.'. ~ , : " ~ , ~ ; A / ~ ,~. ~ '~;1.6 V
2.0 V
3 . 2 V I .... I , I I r I .... I .... I .... I , . , 20 25 30 35 4i~ 45 E,a (eV)Fig. 3. A sample of first differentiated ionization efficiency curves of CH +/C,H2 as measured for retarding potential settings ranging from VR = 0.0 to 5.5 V. Vertical bars locate the average onset energies.
eV for KE(CD + ) = 0.0 eV. Subtracting the ionization energy of CH, i.e. 10.64 eV [ 18] from the latter onset, a D o ( H C - C H ) = D o ( D C - C D ) =9.83 ±0.10 eV is obtained. This identity is justified, the error being about 6 times larger than the isotope effect on the dissociation energy.
Only a few experiments were dedicated to measure the HC=CH dissociation energy. Coats and Anderson [4] calculated a bond dissociation energy of 150 kcai mol -~ or 6.505 eV using I E ( C H ) = I I . I eV and AHf(CH)--102 kcal mol - l or 4.423 eV. Only the
~glYf(CH) has been measured by these authors. The
translational energy carried by CH + has been estimated from peak shifts in the mass spectrum. Kloster-Jensen et al. [ 12] reported a measurement of the appearance energy AE(CH +/C2H2) = 21.5 eV but were not able to estimate the D(HC--CH) on the assumption of
KE(CH +) --0.0 eV at threshold. Using negative ion photoelectron spectroscopy of C2H- and CH2C- and the measurement of the gas phase acidity ofC2H2, Ervin et al. [ 19] derived the H C - C H bond strength at 230.6 ± 0.7 kcal reel- ~ or 10.00 + 0.03 eV at 298 K. Different other values are reported in the literature. On spectroscopic and thermodynamic arguments Cottreil [20] proposes an upper limit for the H C - C H disso- ciation energy of 230 kcal reel-~ (9.97 eV), in agree- ment with Benson [21] who chose 230 kcai mol -~ based on thermodynamic considerations on the triple bond in a sequence of isoelectronic molecules. In a review dedicated to bond energies Vedenyev et al. [ 22] put forward the value of 230 ± 2 kcal m o l - m as based on "thermochemical calculations". Herzberg [23] gives a value o f D ( H C - C H ) = 9.886 eV. Fairly recent quantum mechanical calculations, using multirefer-
338 M. Davister, R. Locht / Chemical Physics 191 (1995)333-346 3 . ~ . 3 . 1 2 , ~ . 2 . 0 l . S 1 . 0 0 . 5 0. ~0 g . E . (CH °) mY -.=~-- _ ..o...-""" [ ClI"II'I" "i" C " I
.. ...
G L._ ,~ L.J@ ~ - o j z-
_ i '~'- ~. .,-':-, ..~.~J~"'~ - J ' , O 7"- ~..~ ...
" • 21 22 23 24 25 26 27 2B 29 30 R, E. ( C H ' ) i V"l
-
j=
- @- ' - r [ T -
F
@_~_ ? / " @ 2T J
I ! i ! i ^. E. (ev) . , .4-. I . . . t0 32 34 36 38 40 42 44 46Fig. 4. The KE--AE diagram of CH+/C2H2 obtained for 20--46 eV electron energy. The encircled numbers are used for the discussion (see text). The length of the error bars is given by the standard deviation.
ence-based methods (MCRI-CASSCF-ACPF) pro- vided D ( H C - - C H ) = 226.6 kcal m o i - i or 9.826 eV [24]. The present measurement of 9 . 8 3 + 0 . 1 0 eV or 227 :i: 2 kcal mol- ! satisfactorily fits in this set of val- ues.
The assignment of reaction ( 1 ) to the lowest thresh- old energy should be valid only for the extrapolated onset for KE(CD + ) = 0 . 0 eV at 20.47 + 0 . 0 2 eV. The energy difference between the appearance energies
of CH + and CD +, i.e. ( 2 0 . 8 3 + 0 . 0 8 ) -
(20.47 + 0.02) = 0.36 4- 0.10 eV, should be ascribed to the production of a vibrationally excited species in the dissociative ionization production of CH +. This energy difference fits very well the vibrational excitation energy of CH +, i.e. (%(CH +) = 2737.7 c m - i = 0.339 eV [ 18 ] or of CH, i.e (oe (CH) = 2858.5 cm - J = 0.354 eV [ 18]. 5
v
Z .-g+-.4
I
c z n z ÷ e - - > CO" ^_ V R = O . @ V //A j
I EC- ~" (V R )/
i/
%.
/ / ~_ v. :o. ~v/
!
/ / : ,~p / / Y . , I / / v , =@. BV / / i , ,- ..%-o .~/.v.~'v; i ' / ; , / d v . : l . 2 v/
' "
,." / ! /" i~' I
! /
i i / i,/ /
/ /
V . / / ,,, / ; ( /
.
/ J i
, / /
J 0 , • • l I . . . . I . . . . I I I I i I , , 17 22 27 32 37 E . ( e V )Fig. 5. A sample of first differentiated ionization efficiency curves ofCD +/C,D2 measured for retarding potential settings ranging from
VR = 0.0 to !.2 V. Vertical bars locate the average onset energies.
].41 K. I. (CO*)
iV I . 2 C2Oz*m'': 1,0 • CO ! 0 , 6 0 . 4 0 . 2 0 . 0 2~ . . . . ~1 . . . . ~ . . . . A . . . . A . . . . ~ . . . . 2'6 . . . . ~ ... 28 • co- ~ ~ . . / o c." i~ / (7) , ' / ":7 / / ®/. ,.y. ~
~
^..~. <-~>
Fig. 6. The KF_,-AE diagram of CD +/C2D2 restricted to translational energies of CD + of 0.0 to 1.5 eV. Full straight lines and full circles refer to CD ÷. For comparison, the data related to CH+/C2H2 are introduced in this diagram (dotted lines, empty circles). Encircled numbers are used for the discussion (see text).
M. Davister, R. Locht / Chemical Physics 191 (1995) 333-346 339
Table I
Dissociation ( D ) , excitation ( E E ) and ionization (IE) energies ( e V ) o f C2H2, C2, CH, C H +, H2, C and H used in this work ~
D(H--C2H) = 5.33 + 0.23 t, D ( H C - - C H ) = 9.83 + 0. I 0 t D ( C - H ) = 3A65 D ( H - H ) = 4 . 4 7 8 c IE(CH) = 10.64 IE(C) = 11.264 ¢ IE(C2, H2, X 2H,) = 11.403 A 22~- ) = 16.297 d B 2~+ ) = 18.391 E E ( C H , a4~, - ) = 0.724 A 2A) = 2.875 B 2,V., - ) = 3.229 ~ C :~, + ) = 3.943 E E ( C H + , a 3II) = 1.141 A q l ) = 2 . 9 8 9 b -~5~ - ) = 4.736 ~ B IA) = 6 . 5 1 3 E E ( C , ' D ) = 1.264 ~ ' S ) = 2 . 6 8 4 g a I eV = 2 3 . 0 6 0 kcal m o l - ~ = 8065.73 c m - '. b R e £ l l ] . ~Ref. l l 8 l . d R e £ l l 7 l . ~ R e £ 1 1 6 l . f As determined in this work.
g Re£ I311.
For both CH + and CD + the slope of the straight lines ( I ) and (1') in the KE-AE diagram (see Figs. 4 and 6) is significantly lower than the expected value as given by the ratio mca/mc2H2 = 0.500. This discrep- ancy is always indicative of the partitioning of the excess energy with respect to the dissociation limit between translational energy and internal (rotational and vibrational) energy of the fragments involved in the dissociation process. On the other hand, both the CH + and CD + ions show a straight line with about the same slope, i.e. s (CH) = 0.39 + 0.02 and si(CD) = 0 . 3 5 + 0 . 0 1 or a ratio of si/s=0.90+O.07.
As has been shown earlier [25,26], the relationship between the ratio of the slopes and the isotope effect on the vibrational wavenumber should be given by s i
7 =
In these relations #i, ¢a~ and s i are the usual symbols t,,sed for the reduced mass, waveaumber and slope • respectively related to the isotopicaily labeled species. For CD + and CH ÷ t9=0.549 whereas for CD and CH 19 = 0.539. Both quantities significantly differ from the experimental value.
For both CH + and CD + an energy balance of the reaction (1) could be made. For the two ions the involved translational energy spreads up to 0.5 eV or 1.0 eV in terms of total energy. Subtracting this quantity from the 2 1 . 9 0 - 2 0 . 4 7 = 1.43 eV for CD + (see Fig. 6), one obtains an energy difference of 0.4+_0.1 eV which best fits one or lwo vibrational quanta in CD + or CD for which ~ ( C D + ) = 0 . 2 5 1 eV or
~e(CD) =0.260 eV [ 18]. On the other hand, as men- tioned earlier, the process ( ! ) in C2H2 produces CH + or CH vibrationally excited at v = 1 in the ground elec- tronic state. The same amount of total excess transla- tional energy being observed for CH +, the energy difference between 2 2 . 1 - 2 0 . 8 5 = 1 . 2 5 eV and K E = 1.0 eV, i.e. 0.25+0.1 eV (see Fig. 6), could only fit one vibrational quantum number, i.e. to~(CH +) =0.339 eV and t%(CH) =0.354 eV [ 18].
The difference in vibrational energy content of the products of reaction ( 1 ) could be an explanation of the observed slopes. The electron energy covered by the CH + (CD + ) production through this reaction extends over the upper limit of the CeH~- (B 22+ ) band and a structureless band observed in the threshold photoelec- tron spectrum of C2H2 [ 27 ]. In this spectrum, recorded between 11.0 and 27.5 eV photon energy, the B 2~+ state spreads up to 21.0 eV where a new band starts, probably corresponding to an autoionizing state. Part of this threshold photoelectron spectrum is represented in Fig. 7. For comparison, in the He(I)-photoelectron spectrum the B 2y.,+ state extends up to 20. ! eV or 20.3 eV for C2H~- and C2D~- respectively. The reaction
(1) could be described by the mechanism
C 2 H 2 ( C 2 D 2 ) + e - ~ [ ( C 2 H 2 ( C 2 D 2 ) ] * Auto [C2H2(C2D2) ] + (B 2~2 ) p,~i~> C H + ( X ,,y., +, v= 1 4-*2) X 2Ha + C H ( X 2II) + 2 e - ~,Ji~$ C D + ( X ly., +, v = 0 ~ 2 ) X 2nu + C D ( X 211) + 2 e - ,
where the excitation energy could equally be trans- ferred to CH. With the fragments in the ' 2 + and in the 2II state, only a C2H~" (211) state can be correlated. In the energy ranging from the first ionization energy up to 21.0 eV, only the X zII. state of C2H~- is known and has the proper symmetry. The CH + fragment probably appears by predissociation of the B 22.+ state by the continuum of the X 2Ilu state. The B 22~+ state should be populated through an autoionizing CzH* state. The fairly unexpected and dramatic isotope effect, as
340 M. Davister, R. Locht / Chemical Physics 191 (1995)333-346 d v 0 .£ O. 0 4~ 0 .C 13. • ; ° . ~.'., IB B
"r"
[ THRESH'PES-CeH2 [ 1 8 - 2 7 eV R o n g e C 2Z° 9 • " ~ 7 . " ' : - . "~._+... .~z~? ." . . ... • '.~..~ .,:: . . . . ~-:.. %-,'- . . . ~.:-'-:" .- : . - _ . - . ~ - - . ~ . . . • "~.-.-~/...-..÷-.~ ' -e~.-~ . . . . r , 2e 2~ 2~' . . . . ~3' . . . ~4 2s '26" . . . . 2"'7Pholon Energy (eV)
Fig. 7. The threshold photoelectron spectrum of C2H2 obtained by photoionization using synchrotron radiation [27]. The spectrum obtained in the 18-2"/eV photon energy range is reproduced.
observed at the thresbo!d of CH ÷, has already been mentioned for the proton production [ 1 ]. Here also a better understanding of the dynamics and a definite explanation would need a good description of the hypersurfaces near the dissociation limits.
In the KE-AE diagram of CD + a second appearance energy at 21.26 + 0.08 eV is observed and is related to ions with about KE = 0.0 eV. This is the starting point of the straight line ( l " ) (see Fig. 6) which at most extends from about 0.1 to 1.2 eV. However, up from 0.5 eV translational energy this straight line could be related to the isotopic counterpart of straight line (4) observed for CH + between 0.5 and 1.2 eV kinetic energy.
The linear regression (1") fits the data points with a correlation coefficient of 0.999. The slope is 0.224+0.004 and the extrapolated energy to KE(CD +) = 0 . 0 eV is 20.90+0.05 eV which is in excellent agreement with the extrapolated value of 20.85 ± 0,05 eV determined for CH +. This could be an argument to relate these data with those observed for CH + and to assign to this energy the same process, i.e.
C2D 2 ~-e- ~ C D + ( X mY.+, v) + C D ( X 2II) + 2 e - .
Further experimental evidence supporting this assump- tion is the slope of the straight line (1"). As r~ported earlier in this section, the relationship between the iso- tope effect on the vibrational energy constant of the reaction products and the slope measured in the KE- AE diagram is given by s i / s = p = ((o~/(oe) 2. In the present case s'= 0.224 and s--0.390 whereas for the ions (o~ = 2029.3 c m - 1 and (o6 = 2737.7 c m - i [ 18] or the neutral radicals w~ = 2099.8 c m - ~ and (o6-- 2858.5 c m - ~ [ 18]. The experimental and calculated ratio p is
S i
- - = 0 . 5 7 4 ± 0 . 0 4 , pi°n=0.5396, p " ~ " ~ = 0 . 5 4 8 6 . $
Experimental and predicted values are in very good agreement. It is not possible to decide on whether CD and/or CD + are vibrationally excited. Furthermore, in the KE(CD+)=0.0--0.5 eV range 1.3 eV excess energy is available for internal energy excitation, e.g. 5 vibrational quanta. The dissociation process in C2De at 20.90-23.2 eV is e.g.
C2D 2 + e - ~ C D + (X iE+, v = 1, 2 ~ v = 6 , 7) + C D ( X 2H) + 2 e - ,
M. Davister, R. Locht / Chemical Physics 191 (1995) 333-346 341
where the energy could equally be transferred to CD or shared by CD and CD +.
The straight line (2) related to both CH + and CD + (see Figs. 4 and 6) corresponds to ions carrying 0.5- 1.2 eV translational energy. The correlation coefficient of the linear regression is r ( C H + ) = 0 . 9 9 9 and r(CD +) =0.998. For the CH + ion, the extrapolation is 21.23_+0.04 eV with a slope of 0.52+0.02. In the case of the CD + ion, the extrapolation is 21.18 +- 0.07 eV with a slope of 0.52 + 0.02. The very good agree- ment between experimental and expected slope in both cases indicates that the excess energy with respect to the dissociation limit is entirely converted into trans- lational energy carried by the fragments.
From earlier electron impact experiments [2-7,11, 12] the onset determined by Kloster-Jensen et ai. [ 12], i.e. 21.5 eV, fits at best the present determination. The present work unambiguously shows that the assump- tion made by the authors that KE(CH +) =0.0 eV is far from being justified. An amount of at least KEtot(CH + ) = 1.0 eV is involved in this process.
The most obvious dissociative ionization process which gives rise to these CH + (CD + ) ions would be C2H2(C2D2) -I-e- --~ [C2H2 (C2D2) ]* ~ autoioniz. [ C2 H ~ (CaD~-) ( B 22+ ) + 2e - ] ~ predissoc. 4y~ CH + (CD + )(X I~+, v~_0) +CH(CD)(a4~ -, v--0) (2) where the CH + (CD + ) ion is produced in its vibronic ground state and the CH(CD) radical in the ground vibrational level of its first electronic excited state. The energy difference between the first two threshold ener- gies for KE(CH +) =0.0 eV, i.e. ( 2 1 . 2 0 + 0 . 1 0 ) - (20.47+_0.02)=0.73+0.12 eV fits fairly well the excitation energy EE(CH, a42 - ) =0.724 eV [ 18]. The slope of the straight line indicates that the internal energy of both fragments remains constant. In reaction (2) the fragments can only correlate with a C2H~ (42) ionic state.
As mentioned earlier in this discussion, the threshold photoelectron spectrum of C2H2 recorded with syn- chrotron radiation [27], shows a structureless band
starting at 21.0 eV and peaking at 22.5 eV. It lies below
the
C2H ~- (C
22; )
third ionic excited state for whichthe vertical ionization energy is measured at about 23.5 eV. This latter band has also been observed in the He(II) photoelectron spectrum [28]. The state at 21.0 eV has to be populated by autoionization only, giving rise to threshold photoelectrons and could be the 4~ state. This state is able to predissociate the C2H~-(B 22+ ) state and should be repulsive in the Franck--Condon region as it is suggested by the absence of any vibrational structure in the photoelectron spec- trum [27] (see Fig. 7).
At 21.8+0.1 eV a straight line (3) covers the KE(CH + ) =0.0--0.6 eV range and is defined by seven data points. The linear regression fits these data with a correlation coefficient of 0.993 and is characterized by a slope of 0.304-0.02. For the CD + ion the same appearance energy is measured at 21.83 4- 0.03, but the KE(CD +) ranges from 0.0 to 0.3 eV. The slope is 0.264-0.01 with a correlation coefficient of 0.998, although only four data points are available to define this linear regression.
This onset could be compared with those measured by Field and Franklin [3] at 21.68 eV and by Haney and Franklin [ 10] at 21.94 eV. The value reported by Kloster-Jensen et al. [ 12] at 21.5 eV could also be included. In this ease the assumption of the KE(CH + ) --0.0 eV made by the authors is valid.
For both CH + and CD +, the onset at KE=0.0 eV should correspond to the electronic excitation energy of C H + ( C D + ) . By optical spectroscopy the CH + (a3II) state lies at 1.141 eV [ 18] (see also data in Table 1) whereas the energy difference of (21.8 4-0.1) - (20.5 +0.08) = 1.3 4-0.18 eV. The dis- sociative ionization process taking place at 21.8 eV should be
C2H2(C2D2) "t- e - ---* C2H~ / C2H~ (C 2~g )
[
4~ prediss.CH + (a 311) +CH(X 2II) + 2 e -
(3)
where both the C2H* at 21.0 eV and CzH~- (C2Eg )
states are involved, appearance energies being observed over the 21.8-23.5 eV electron energy range. Fragments with 3H and2H
symmetry correlate with342 M. Davister, R. Locht / Chemical Physics 191 (1995)333-346
2"4E
and 2"4A states in the D~h symmetry group. Con-sidering a meg-2'4A as unallowed (AA = 2) and that the energetically lowest state is the 42 according to Hund' s rule, the decomposition of the above mentioned states should occur through a predissociation mecha- nism via the 4E state. A similar mechanism has been invoked earlier for the C2 H~ ions dissociating between 22.0 and 23.5 eV (see straight line (2)).
The slope of the straight line (3) related to both CH + and CD + markedly differs from the expected value of 0.500. This implies partial excess energy con- version into internal energy of the diatomic neutral and/or ionized fragments. As discussed above, the isotope effect on the vibrational energy should be observed by the difference of slopes between CH ÷ and CD + or the ratio s i l s = 0.54 is expected. In the present case this ratio is 0.87. However, as has been pointed out earlier CD + is only observed for KE(CD + ) = 0.0- 0.3 eV, whereas CH ÷ covers the range KE(CH ÷ ) = 0.0--0.6 eV. An internal excess energy is available for CH+(CD +) and/or CH(CD) of 0.8+_0.2 (0.6+0.2) eV which corresponds to two vibrational quanta on one species or shared by both dissociation partners. For the difference between exper- imental and expected slope ratios no direct explanation is available on the basis of only the presently existing data.
Four data points related to CH + and CD + (see Figs. 4 and 6) can fit a straight line (5) which extrapolates at 21.85:0.12 eV with a slope of 0.17 +_0.03 and with a correlation coefficient of 0.994.
The most probable interpretation of these data is to assign the dissociative ionization phenomena of straight line (5) to reaction (3) but where the 2E state, correlated with the 3 H - 21-1 fragments, should predis- sociate the CzH~" (C zE~ ) state. As already men- tioned the succession of the '*E and the 2E states is based on Hund's rule.
C2H2 + e - --) C2H* / C2H ~- (C 2~g )
~
2~ prediss.CH + (a3H) +CH(2II) + 2 e - .
(3')
A major difference between the lines (3) and (5) is the slope value, i.e. 0.30 +- 0.02 instead of 0.17 +_ 0.03.The latter value indicates a more important excess energy conversion into internal energy of the frag- ments. For comparison, from straight line (3) 40% of the excess energy is converted into internal energy of CH and/or CH +, whereas from straight line (5) 66% of this energy is shared by the two dissociation partners. Straight line (4) is related to CH + ions only pro- duced with initial translational energy extending from 0.6 to 1.2 eV. The linear regression fitting these data points has a correlation coefficient of 0.995. The straight line (4) has a slope of 0.53 +_0.03 and extrap- olates to KE(CH + ) =0.0 eV at 22.6+_0.1 eV.
The lowest appearance energy related to these CH + ions is measured at 23.8 +_ 0.2 eV for CH + ions carrying 0.6 eV translational energy. This energy is in very good agreement with the second appearance energy reported by Plessis and Marmet [7] at 23.9+_0.2 eV and obtained by electron impact. By photoionization mass spectrometry Hayaishi et al. [9] determined an onset at 24.1 eV. Both groups interpreted this onset consid- ering no kinetic energy being carried away by the frag- ments at threshold.
Taking the data provided by the present work, the most probable reaction path at 22.6 eV would be
C2H 2 -I- e - --, C2H ~ (C 2E; ) -I- 2 e - l prediss. 2H
CH 4 (a3H, v = 0 ) + C H ( a 4 ~ - , v = 0 ) .
(4)
The thermodynamic threshold for this process is cal- culated at 22.35+0.1 eV. If the discrepancy of 0.25 +- 0.20 eV is significant, this energy would corre- spond to the vibrational excitation of CH + or CH in the v = 1 level. This reaction will run over the C 2Eg state which spreads over the energy range 22.5-26 eV. This ionic state has to decompose through predissocia- tion. An argument favouring this mechanism is the fact that the fragments of 3H and 4E- symmetry respec- tively, correlate only with a H state in doublet, quartet and sextet multiplicities, whereas only the C 2E~- state is populated in the Franck-Condon region (see Fig. 7). The isotopic counterpart of this process is repre- sented by straight line (4') in Fig. 6. It is characterized by a slope of 0.224 + 0.004 with a correlation coeffi- cient of 0.999. Contrary to process (1") where theM, Davister, Ro Locht / Chemical Physics 191 (1995) 333-346 343
experimental and expected isotope effects agree, in this case the ratio
si/s
= 0.22/0.53 = 0.41 -I- 0.03 which sig- nificantly deviates from the expected 0.54 value. As mentioned earlier, abnormal isotope effects have been observed for other dissociation processes examined in C2H 2 and C2D 2. Realistic explanations need data (pres- ently non-existent) concerning the shape of the hyper- surfaces of C2H~ in this energy range.A series of appearance energies are measured between 24.9 and 28.6 eV for ion translational energies K E ( C H ÷ ) = 0 . 0 - 1 . 8 eV (see straight lines (6) and (7) in Fig. 4). Trying to correlate these data, a straight line of slope 0.18+0.01 is fitted to part of the data (straight line (6)). An extrapolation at KE(CH + ) = 0 . 0 eV at 24.5 + 0 . 2 eV is obtained with the expected slope of 0.5. The correlation coefficient is 0.994. A vertical line (7) is positioned at the average appearance energy of 28.6__+ 0.3 eV. These processes were not measured in C2D2, confusion being possible with N +/N2 present in the background mass spectrum and appearing at 24.3 eV [ 15].
This appearance energy could also be compared to the photoionization measurement of 24.1 eV reported by Hayaishi et al. [9] and in this case the assumption made by the authors that no translational energy is carried away by CH + at threshold holds.
The energy difference between the present appear- ance energy and the lowest dissociation level is 4.0+0.2 eV. This excess energy could be converted into (i) dissociation energy of CH --* C(3P) + H(aSg) requiring 3.465 eV or (ii) vibronic excitation of CH and/or CH ÷, i.e.
C2H2+e- --*CH + (A IH) +CH(a4~ - ) + 2 e - , (5) C 2 H 2 + e - ~ C H + (a31-l) + C H ( A 2A) + 2 e - , (6)
C2H2 + e - -oCH+ (X '~+)
+ CH(C 2~ + ) + 2 e - , (7)
for which the thermodynamical onset is calculated at 24.21 +_0.10 eV, 24.51 -I-0.10 eV and 24.41 _0.10 eV respectively. '1-1-4~ states of the fragment correlate with a C2H~ (4II) state, 3II-2A correlate with 2'4A and 2'4(I) states of CaH~- and finally t~+_2~+ correlate only with a C2H~ (2~+) state. As already mentioned in this discussion, the threshold photoelectron spectrum [27] and the X-ray valence-excitation photoelectron spectrum [29] show a number of 2~ ÷ states between
23 and 28 eV. They are predicted to be repulsive in the Franck-Condon region [29]. These facts would favour reaction (7) as being involved up from 24.9 eV.
CH ÷ ions measured at 28.6 + 0.3 eV (vertical line ( 7 ) ) carry up to 1.8 eV translational energy, i.e. 3.6 eV in terms of total kinetic energy. This amount cor- responds to KE(CH + ) =0.0 eV appearing at about 25.0+0.3 eV which is close to the above calculated threshold for reaction (7). Mtiller et al. [ 29 ] performed theoretical predictions up to 30 eV and calculated the potential energy surface along the - - C - C - reaction coordinate. The surface is found to be almost repulsive from 30 eV down to 26 eV. These theoretical predic- tions are accounted for by the present experimental data. It has to be kept in mind that in this energy range, dissociative ionization processes occur also along the same reaction coordinate, but in the H+-producing channel [ 1 ].
A vertical line (8) connecting only three appearance energy measurements is located at 27.6-1- 0.1 eV and is related to CH + ions carrying up to 3.2 eV kinetic energy representing 6.4 eV excess energy involved in the CH +-producing reaction. Subtracting this quantity from the measured onset energy, a threshold of 21.2 + 0.1 eV is obtained for CH ÷ ions with KE = 0.0 eV. This energy is in good agreement with the disso- ciation level measured at 21.23 ___ 0.04 eV (see straight line (2)) and ascribed to
C 2 H 2 + e - ---> C 2 H~- (2E~")
~ C H + (X ~ + ) + C H ( a 4 E - ) + 2 e - , (2') where the same dissociation limit (2) is reached through a direct transition to a 2~g state which is com- pletely repulsive in he Franck-Condon region in the - C - C - reaction coordinate [29].
Four data points fitting straight line (9) with a cor- relation coefficient of 0.999 show a slope of 0.77 + 0.01 and extrapolate at 22.70 +_ 0.12 eV. The, experimental slope is significantly higher than the expected value of 0.5. However, it is in very good agreement with the slope obtained by assuming CH ÷ being produced by dissociative ionization of acetone. In this case the slope would be given by the ratio
(m58-m13)lmss=0.78.
As mentioned in Section 2 of this report, the used high pressure acetylene is added with 1% dimethylcetone. By thermodynamical cycles several thresholds ofCH ÷
344 M. Davister, R. Locht / Chemical Physics ! 91 (! 995) 333-346
produced from acetone can be calculated between 18.6 and 23.1 eV.
After an energy gap of about 5 eV, up from 34 eV electron energy, CH + ions are produced with transla- tional energy only. As already stressed in Section 2, one appearance energy at 33.8 +- 0.6 eV, detected only for VR ---- 0.0-0.1 V, corresponds to a rapidly increasing signal in the first differentiated ionization efficiency curve o f C H + (see Fig. 3). For this reason this thresh- old was first assumed to be related to C2H22+ . This assumption has been confirmed by measuring the ion- ization efficiency curve of C2HD 2 + and observing dou- ble ionization energies at 32.2+-0.2, 33.5+-0.1 and 34.6+_0.3 eV [I].
The CH + ions appearing at an average energy of 33.8+0.3 eV (see vertical line (10) in Fig. 4) carry away KE -- 1.4-3.5 eV. In terms of total translational energy KE,ot(CH + ) -- 2.8-7.0 eV. Assuming no inter- nal energy being carried by the fragments, the disso- ciation levels for the process observed at 33.8 eV would lie at least at 26.3 +_ 0.3 eV. Thissen et al. [ 30] meas- ured the simultaneous formation of two CH + fragment ions by the PEPIPICO technique. In the yield curve below 37 eV, "a rounded foot leading to a first onset at about 34 e V " is observed. The same authors meas- ured a kinetic energy release of 4.4:t: 1 eV, or KE(CH +) =2.2 eV+_ 1 eV, for 38 eV photons. No measurements were reported for 34 eV photons.
As suggested by the threshold energy at 33.8 eV, this process occurs in the double ionization continuum. However, the lowest threshold calculated for
C2H 2 + e - ~ 2 C H + (X IX+) + 3 e -
(8)
lies at 31. I 0 + 0.10 eV. On the basis of energetic argu- ments, the process at 26.3 eV cannot be ascribed to the decomposition of a doubly ionized state of C2H2. The above mentioned reaction could only be assigned to the first data point of the vertical line (10). On the other hand, the energy difference between the dissociation level at 26.3 +-0.3 eV and the lowest dissociative ion- ization limit at 20.5 + 0.1 eV, i.e. 5.8 + 0.4 eV can be ascribed to a large number of processes by combining the data listed in Table 1, e.g. (i) CH + + CH in various excited states or (ii) CH + + C +H. The intermediate state could be a C2H~* state, metastable against autoionization. The set of data collected in this work do not allow us to make an unambiguous assignment.The series of threshold energies between 36.2 and 38.8 eV are related to CH + ions produced with trans- lational energies spread from 1.8 to 3.5 eV or 3.6 to 7.0 eV in terms of total kinetic energy. These ions probably correspond to those observed by Thissen et al. [ 30] in their PEPIPICO experiment up from 37 eV photon energy and with 4.4 + 1 eV kinetic energy release. A straight line (11) (dotted line) could fit the experi- mental data and it extrapolates at KE(CH +) = 0.0 eV at 31.4 +_ 0.5 eV. This energy is in good agreement with the thermodynamical onset calculated for reaction (8) where two C H + ( X I X + ) ions are produced. These fragments could only correlate with a C2H2+ ( ~ +) molecular ion state. The investigation of C2HD 2+ showed the ~X~ to be at least partially stable in the Franck-Condon region [ 1 ]. The potential energy sur- face ofC2H~ 2+ along the - C - - C - coordinate shows the possibility to reach the top of the potential barrier at about 36 eV [30]. This would correspond to the appearance energy measurements at 36.2+_0.5 eV (four data points).
Though they could fit the dotted straight line ( 11 ), the three last data points are fairly well grouped around 38.5 +_0.6 eV. No doubly ionized state of C2H2 has been observed in this energy range [ 1 ]. This has been ascribed to the unstable character of the C2H 2 + states in the Franck-Condon region [ 1 ]. Several doubly ion- ized states were calculated in the energy range of 37- 38 eV, but these are all o f l I symmetry [ 30]. However, a 3IIu state is found to be unstable against dissociation in the Franck--Condon region [30]. The threshold energy of the reaction
C2H 2 -I-e- --*CH + (X IX+)
+ C H + (a3I]) + 3 e - (9)
is calculated at 32.24 +_0.10 eV. The CH + ions carry- ing between 2.9 and 3.5 eV kinetic energy could be assigned to this dissociation pathway. Thissen et al. [ 30] suggested a predissociation mechanism and a pas- sage through several curve crossings to reach finally the iX + + IX + dissociation limit.
Through the large scattering of the appearance energy measurements in the vicinity of 42.0 +_ 1.0 eV in the kinetic energy range 3.5-5.5 eV, an energy bal- ance could be made. It shows that also for the present CH + ions, the dissociation process runs also over reac- tion (8). The only comparison which can be made with
M. Davister, R. Locht / Chemical Physics 191 ( i 995) 333-346 345
literature data is the kinetic energy release measured by PEPIPICO [30], i.e. 5.0+0.3 eV for 40.8 eV pho- ton energy. This measurement should be compared to the 11.0 eV observed in the present experiment. The maximum error of 0.5 has to be ascribed to the adopted 0.5 V width of the retarding potential step in this VR range. By photoionization [30] no appearance energy has been reported.
At this energy the density of C2H~ ÷ states is fairly high. A predissociation mechanism followed by a cas- cade of transitions to the lowest dissociation limit could be proposed. The total excess energy is entirely con- verted into translational energy of the fragments.
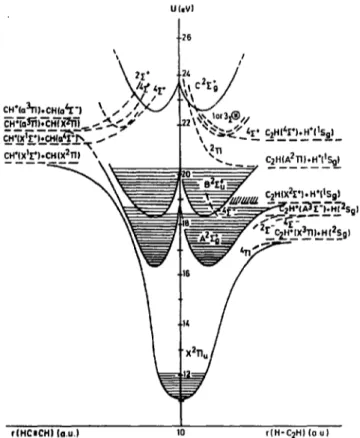
U(mV) ~ I I I \~ ~,. ~2~ / :.'~,~,.c,~,'r'j k , , % / ; " J I ,.~<.; Y,.~m,~ ~ I* CzHI~I'IoH+I1Sgl --,S.).c.tx~.) .... ~ ,,2. CH'lXllr % i _. C2HlA2nl*H'(ISg | ~IX3~I,H (2SOl 5. Conclusions
Up to the end of this report, the dissociative ioniza- tion of C2H 2 in the H +, C2 H÷ and CH + channels has been investigated and analyzed in detail. The three dis- sociations all occur along the internuclear axis of the molecule. The mechanism and dynamics of these reac- tions could be discussed without modification of the linear configuration of the molecule. Therefore, these results could schematically be represented in a two dimensional potential energy diagram along both the H-C2H and HC=CH reaction coordinates. The main results on H +, C2H + and CH + are summarized in the diagram represented in Fig. 8. The energy levels and symmetries of the radicals are based on the most recent experimental and/or theoretical data (see Table 1). Contrary to Fiquet-Fayard [32], the C2Hf (X 2II.) state would converge to C2H+(X3II)+H(2Sg) instead of the C2H(A 211) + H +(~Sg) level. For ener- getic reasons and from correlation rules, the C2H~-(A 2E~-) most likely would converge to the C2H(X 2E +) +H+(ISg) limit.
From the first appearance energy of H + (D + ) and CH + (CD ÷ ) and the translational energy measurement of these fragments at the onset, the dissociation energy of the H--C2H and the HC---CH bonds has been evalu- ated to be 5.33 +0.23 eV and 9.83-1-0.10 eV respec- tively. For these estimates, the polyatomic dissociation products are assumed to be produced in their vibronic ground state.
The lowest appearance energies of H ÷, CH ÷ and C2H + mainly involve the A 2E~- and the B 2~+ states of C2 H~-. The dissociative ionization reactions leading
¢(HCICH) (a.u.) 10 r(H-C2H) (a u)
Fig. 8. Tentative schematic potential energy diagrams of C2 H~ along the H--C2H and the H C - C H reaction coordinates. The areas shaded by horizontal lines define the well depth observed in the He(l) photoelectron spectra. Dashed lines locate the experimental data and the result from the discussion about the H +, C2H + and CH + frag- ments production.
to these fragments are mainly driven by predissociation mechanisms involving the X 2H,, the A 2E~- and the
2 +
B ~g states (see Fig. 8).
The investigation of the isotopically labelled species C2D2 showed marked differences for D + as well as for CD+. Interpretations were attempted, but deeper the- oretical and experimental investigations (e.g. photo- dissociation of ions) would be necessary for a more detailed vision of the reaction dynamics.
The higher lying appearance energies, i.e. in the 21- 28 eV range, the (pre)dissociation of the C2H~- ( C 2 ~ - ) state and higher lying 2E~- states play a major role. Above 34 eV mainly doubly ionized C2H2 states decompose to give rise to H ÷ and CH ÷ .
Acknowledgement
This work has been supported by the Fonds de la Recherche Fondamentale Collective (FRFC) and the
346 M. Davister, R. Locht / Chemical Physics 191 (1995)333-346
Belgian Government through an Action de Recherche Concert~e (ARC). M.D. is indebted to be Belgian Gov- ernment for a grant. We wish to acknowledge Dr. R. Thissen for helpful discussions and Professor P. Natalis for the critical reading of the manuscript.
References
[ 1 ] M. Davister and R. Locht, submitted for publication. [2] P. Kusch, A. Hustrulid and J.T. Tare, Phys. Rev. 52 (1937)
843.
[ 3 ] F.H. Field, J.L. Franklin and F.W. Lampe, J. Am. Chem. Soc. 79 (1957) 2665.
[41 F.H. Coats and R.C. Anderson, J. An'. Chem. Soc. 79 (1957) 1340.
[5] A. Bloch, Advan. Mass Spectrom. 2 (1963) 48.
[6] J. Momigny and E. Derouane, Adv. Mass Spectrom. 4 (1967) 607.
[7] P. Plessis and P. Mariner, Intern. J. Mass Spectrom. Ion Processes 70 (1986) 23.
[8] G. Cooper, T. lbuki, Y. Iida and C.E. Brion, Chem. Phys. 125 (1988) 307.
[91 T. Hayaishi, S. lwata, S. Sa~anuma, E. Ishiguro, Y. Morioka, Y. Iida and M. Nakamura, J. Phys. B 15 (1982) 79.
[101C.I.M. Bcenakker and FJ. De Heer, Chem. Phys. 6 (1974) 291.
[ ! I ] M.A. Haney and J.L. Franklin, J. Chem. Phys. 48 (1968) 4093. [ 12] E. Kloster-Jensen, C. Pascual and J. Vogt, Heir. Chem. Acta
53 (1970) 251.
[ 13 ] R. Locht and J. Schopman, Intern. J. Ma~s Spectrom. Ion Phys. 15 (1974) 361.
I 14] C. Servals, R. Locht and J. Momigny, Intern. J. Mass Spectrom. Ion Processes 71 (1986) 179.
[ 15] A. Lofthus and P.H. Krupenie, J. Phys. Chem. Ref. Data 6 (1977) 113.
[ 16 ] C.E. Moore, Ionization potentials and ionization limits derived from the analyses of optical spectra, NSRDS-NBS 34 (1970). [ 17] J.E. Reutt, L.S. Wang, I.E. Pollard, D.J. Trevor, Y.T. Lee and
D.A. Shirley, J. Chem. Phys. 84 (1986) 3022.
[ 18 ] K.P. Huber and G. Herzberg, Molecular spectra and molecular structure. Constants of diatomic molecules (Van Nostrand Reinhold, New York, 1979).
[19] K.M. Ervin, S. Gronert, S.E. Barlow, M.K. Gilles, A.G. Harrison, V.M. Bierbaum, C.H. DePuy, W.C. Lineberger and G.B. EIlison, J. Am. Chem. Soc. 112 (1990) 5750.
[ 20] T.L. Cottrell, The strengths of chemical bonds (Butterworth, London, 1958).
[21 ] S.W. Benson, J. Chem. Educat. 42 (1965) 502.
[22] V.L Vedenyev, L.V. Gurvich, V.N. Kondrat'yev, V.A. Medvedev and L. Frankevich, Bond energies, ionization potentials andelectron affinities (St. Martin's Press, New York, 1966).
[23] G. Herzberg, Molecular spectra and molecular structure. Vol. 3. Electronic spectra of polyatomic molecules (Van Nostrand, Princeton, 1967).
[24] S.R. Langhoff, C.W. Bauschlicher and P.R. Taylor, Chem. Phys. Letters 180 ( 1991 ) 88.
[ 25 ] R. Locht, J.L. Oliv~er and J. Momigny, Chem. Phys. 43 (1979) 425.
[ 26] R. Locht, Ch. Servais, M. Ligot, M. Davister and J. Momigny, Chem. Phys. 125 (1988) 425.
[ 27 ! R. Locht, K. Hottmann and H. Baumg'~'tel, to be published. [ 28l S. Svensson, E. Zdansky, U. Gelius and H. Agren, Phys. Rev.
A 37 (1988) 4730.
129l J. MOiler, R. Arneberg, H. Agren, R. Manne, P.A. Malmquist, S. Svensson and U. Gelius, i Chem. Phys. 77 (1982) 4895. [30] R. Thissen, J. Delwiche, J.M. Robbe, D. Duflot, J.P. Flament
and J.H.D. Eland, J. Chem. Phys. 99 (1993) 6590.
[311 C.E. Moore, Atomic energy levels, Vol. I, NSRDS-NBS Circular No. 467 (US GPO, Washington, 1949).

![Fig. 7. The threshold photoelectron spectrum of C2H2 obtained by photoionization using synchrotron radiation [27]](https://thumb-eu.123doks.com/thumbv2/123doknet/6742083.185925/8.907.222.706.94.477/threshold-photoelectron-spectrum-obtained-photoionization-using-synchrotron-radiation.webp)