• Aucun résultat trouvé

Persistent drying in the tropics linked to natural forcing

N/A
N/A
Protected

Academic year: 2021

Partager "Persistent drying in the tropics linked to natural forcing"

Copied!
9
0
0

Texte intégral

(1)

HAL Id: hal-01458298

https://hal.archives-ouvertes.fr/hal-01458298

Submitted on 21 Jan 2021

HAL is a multi-disciplinary open access

archive for the deposit and dissemination of

sci-entific research documents, whether they are

pub-lished or not. The documents may come from

teaching and research institutions in France or

abroad, or from public or private research centers.

L’archive ouverte pluridisciplinaire HAL, est

destinée au dépôt et à la diffusion de documents

scientifiques de niveau recherche, publiés ou non,

émanant des établissements d’enseignement et de

recherche français ou étrangers, des laboratoires

publics ou privés.

Distributed under a Creative Commons Attribution - NonCommercial| 4.0 International

License

Persistent drying in the tropics linked to natural forcing

Amos Winter, Davide Zanchettin, Thomas Miller, Yochanan Kushnir, David

Black, Gerrit Lohmann, Allison Burnett, Gerald H. Haug, Juan

Estrella-Martinez, Sebastian F. M. Breitenbach, et al.

To cite this version:

Amos Winter, Davide Zanchettin, Thomas Miller, Yochanan Kushnir, David Black, et al.. Persistent

drying in the tropics linked to natural forcing. Nature Communications, Nature Publishing Group,

2015, 6, �10.1038/ncomms8627�. �hal-01458298�

(2)

Received 5 Sep 2014

|

Accepted 26 May 2015

|

Published 14 Jul 2015

Persistent drying in the tropics linked to natural

forcing

Amos Winter

1

, Davide Zanchettin

2,3

, Thomas Miller

4

, Yochanan Kushnir

5

, David Black

6

, Gerrit Lohmann

7

,

Allison Burnett

8

, Gerald H. Haug

9

, Juan Estrella-Martı´nez

1

, Sebastian F.M. Breitenbach

10,11

, Luc Beaufort

12

,

Angelo Rubino

3

& Hai Cheng

8,13

Approximately half of the world’s population lives in the tropics, and future changes in the

hydrological cycle will impact not just the freshwater supplies but also energy production in

areas dependent upon hydroelectric power. It is vital that we understand the mechanisms/

processes that affect tropical precipitation and the eventual surface hydrological response to

better assess projected future regional precipitation trends and variability. Paleo-climate

proxies are well suited for this purpose as they provide long time series that pre-date and

complement the present, often short instrumental observations. Here we present

paleo-precipitation data from a speleothem located in Mesoamerica that reveal large

multi-decadal declines in regional precipitation, whose onset coincides with clusters of large

volcanic eruptions during the nineteenth and twentieth centuries. This reconstruction

provides new independent evidence of long-lasting volcanic effects on climate and elucidates

key aspects of the causal chain of physical processes determining the tropical climate

response to global radiative forcing.

DOI: 10.1038/ncomms8627

1Department of Marine Sciences, University of Puerto Rico, Mayagu¨ez, Puerto Rico 00681-9000, USA.2The Ocean in the Earth System Department, Max

Planck Institute for Meteorology, Bundesstrasse 53, Hamburg 20157, Germany.3Department of Environmental Sciences, Informatics and Statistics, University of Venice, Dorsoduro 2137, Venice 30123, Italy.4Department of Geology, University of Puerto Rico, Mayagu¨ez, Puerto Rico 00681-9000, USA.

5Division of Oceans and Climate Physics, Lamont-Doherty Earth Observatory of Columbia University, Palisades, New York 10964, USA.6School of Marine

and Atmospheric Sciences, Stony Brook University, Stony Brook, New York 11790, USA.7Division of Climate Sciences and Paleo-climate Dynamics, Alfred Wegener Institute, Helmholtz Centre for Polar and Marine Research, Bremerhaven 27570, Germany.8Department of Earth Sciences, University of Minnesota, Minneapolis, Minnesota 55455, USA.9Geological Institute, Swiss Federal Institute of Technology, Zurich 8092, Switzerland.10Department of Earth Sciences, University of Cambridge, Downing Street, Cambridge CB2 3EQ, UK.11Sediment and Isotope Geology, Ruhr-University Bochum, Universita¨tsstrasse 150,

Bochum 44801, Germany.12Environmental Geosciences, CEREGE (CNRS-Universite´ Aix Marseille), Aix en Provence 13545, France.13School of Human

Settlement and Civil Engineering, Xi’an Jiaotong University, Xi’an 710049, China. Correspondence and requests for materials should be addressed to A.W. (email: amos.winter@upr.edu).

(3)

A

n overall intensification of the global hydrological cycle is

generally reported to occur under a warming climate

1

.

How such general intensification affects regional rainfall

regimes and eventually the distribution of available freshwater,

however, strongly depends on associated large-scale atmospheric

circulation changes

1

. Mesoamerica, the stretch of land separating

the tropical Atlantic and tropical Pacific oceans (Fig. 1a), is

considered to be the tropical region most exposed to climate

change and subject to substantial drying in the future according

to climate projections

2

. To increase our confidence in projected

drying scenarios, it is incumbent to improve our understanding of

the causes and forcing mechanisms of this region’s long-term

hydroclimate variability, also based on information from the

remote past.

The climate of Mesomerica (Fig. 1a) is characterized by a

boreal summer/fall (June–October) rainy season and a relatively

dry winter

3

. Mesoamerica’s rainfall is influenced by moisture

originating usually from the vicinity of the Intertropical

Convergence Zone (ITCZ) via transport into the monsoonal

system over Belize, via the Caribbean low-level jet, and by

localized convection. In summer, the ITCZ migrates to its

northern position, its core stretching across the northern tropical

Atlantic at

B10°N, into northern South America and from there

turning north over Central America to the East Pacific, reaching

to

B12°N and causing widespread rainfall over the land portion

4

.

Because the two ITCZ segments respond to variations in

sea-surface temperatures (SSTs) in both the tropical Atlantic

and the Pacific Oceans, Mesoamerica is exposed to complex

hydrological fluctuations on a broad range of timescales

5

.

Year-to-year rainfall variability in the Guatemala mountain

regions today is correlated with the gradient between SSTs in

the western tropical Atlantic and eastern tropical Pacific

3

. Colder

(warmer) than normal tropical Atlantic SSTs that are consistent

with a stronger (weaker) and more southward (northward)

displaced Atlantic subtropical high, lead to drier (wetter) than

normal conditions in Central America

6,7

. Similarly, anomalously

warm (cold) eastern equatorial Pacific SSTs, e.g., during El Nin˜o

(La Nin˜a) events, force an equatorward (northward) displacement

of the east Pacific ITCZ and contribute to drying (wetting) in

most of Central America

8,9

. Observations also indicate an

association between precipitation conditions over Mesoamerica

and the phasing of the winter North Atlantic Oscillation

10

.

Timing and distribution of precipitation during the summer

season is a critical issue for agricultural yields in Yucata´n: periods

of drought vitally affect agriculture and, hence, local societies

11

.

Observational meteorological records indicate that droughts on

the peninsula are rare, but tend to be more severe than wet

periods

11

. The availability of continuous, long-term hydrological

data beyond the few decades covered by the instrumental

record is a necessary prerequisite to fully characterize regional

hydrological variability and to unequivocally address its

dependence on large-scale climatic fluctuations, especially as far

as the identification of forcing mechanisms at the hemispheric to

global scales is concerned. Elucidation of Mesoamerican

hydroclimate variability and associated dynamics before the

instrumental period will also contribute to the debate on

the intricate cultural changes that occurred in the region during

pre-Columbian times

12

.

Speleothems are increasingly used as terrestrial archives of past

climate and environmental change because they can provide long,

continuous, precisely U-series dated and high-resolution time

series, and are generally unaffected by post-depositional

diagenetic alteration. Here we present results from a new 300

year (1700–2000 C.E.) precipitation reconstruction based on d

18

O

from a Mesoamerican speleothem. Our paleo-precipitation data

reveal large multi-decadal declines in regional precipitation, the

onset of which coincide with clusters of large volcanic eruptions.

Our data show, for the first time, that natural external forcing can

drive successive multi-decadal dry and wet phases in the tropics

and provide new independent evidence of long-lasting tropical

climate response to global radiative forcing, contributing to the

current debate on whether strong tropical volcanic eruptions and

changing solar output have the potential to induce dynamical

responses in the coupled ocean–atmosphere system on decadal

and even longer time scales.

Results

Hydrological reconstruction and volcanic eruptions. The data

for this study derive from stalagmite GU-Xi-1 collected 250 m

inside the large cavern of Xibalba in the Campur Formation

13

located in the Maya Mountains of Guatemala near the Belize

border (Fig 1a, 16.5°N, 89°W). The in-cave elevation is 350 m,

with a cave mean annual temperature of 23 °C. GU-Xi-1 was

actively dripping at the time of collection and chosen for its

candle-shape, its distance from outside atmospheric influences,

and its location of 30 m above the nearby modern river level; the

karst surface is generally 100–150 m above the cave passages

(Fig. 1b). The specimen is 33 cm tall, but only the upper 18 cm are

used for this study (Fig. 2a). Our age model (Fig. 2b) is highly

constrained by nine U/Th multi-collector inductively coupled

plasma mass spectrometry dates (Supplementary Table 1) and by

the collection date in 2007.

The largest amounts of annual precipitation in the region fall

on the high mountain ranges of Guatemala, southwest of the cave.

Summer precipitation values in the Maya Mountains reach

upwards of 400 mm per month, but are approximately half that

amount in the study area. A strong inverse correlation between

speleothem d

18

O and tropical precipitation intensity

14

has

previously been observed for the region

15

. The speleothem

0 300 km Belize city Xibalba Entrance River enters GUXI-1 Continues Continues N Meters (Down) Cave symbols Slope Speleothem Ledge Pool Collapse 150 0

Figure 1 | Geographical characteristics of the study area. (a) Location map of Mesoamerica and of the Xibalba cave; (b) Map of the speleothem site with major physical features of the cave.

(4)

d

18

O significantly correlates (see methods) with precipitation

from nearby Belize City over the instrumental period, when a

lag of 6 years is imposed to the former (Fig. 3). The

inverted correlation patterns of the speleothem d

18

O with the

SST and sea-level pressure (SLP) fields over the Pacific and

Atlantic sectors is consistent with corresponding patterns for

observed precipitation (Fig. 4), supporting the robustness of the

climatological scenario associated with interannual rainfall

variability over the Yucata´n.

The most prominent aspects of our reconstruction are the

occurrences of three distinct multi-decadal drying trends during

the nineteenth and twentieth centuries (Fig. 5e). Based on the

modern relationship between d

18

O and regional precipitation

anomalies

16

, the speleothem data indicate a 25% decrease in

precipitation between 1810 and 1845 C. E., another comparable

precipitation decrease between 1883 and 1925 C. E., and a third,

smaller decrease from 1963 to the present. The drying steps are

separated from one another by brief intervals of precipitation

recovery in mid-century. Our and other available d

18

O records

from Mesoamerica

17,18

correlate with each other with variable

strength during the reconstruction period (Fig. 6, Supplementary

Figs 1, 2), in part reflecting large dating uncertainties in some of

the reconstructions. The different reconstructions feature similar

drying trends during the early and—less so—late nineteenth

century, suggesting a broader regional phenomenon.

Our three pronounced decreases in regional precipitation

coincided with clusters of strong tropical volcanic eruptions

(Fig. 5a). The most prominent of these eruptions are the 1809

eruption of unknown location and Tambora in 1815 (cluster 1),

Krakatau in 1883 (cluster 2), Agung in 1963 and Pinatubo in 1991

(cluster 3). Reconstructed precipitation decreases throughout

each cluster such that the precipitation evolution during these

periods is best described as a function of cumulative volcanic

radiative forcing (Figs 5b–d, Supplementary Figs 3, 4 and

Supplementary Note 1). The different estimates of cumulative

volcanic forcing provided in Fig. 5 exemplify the effects of

uncertainties, such as those in reconstructed aerosol optical

properties used as volcanic forcing input to climate models, those

arising from the presence of additional varying external forcing

factors and those inherent in the model-specific implementation

of volcanic forcing.

The most recent volcanic cluster does not display a statistically

significant correlation between d

18

O and cumulative volcanic

forcing, that we interpret as the result of the different background

climate conditions and of interferences from other dominant

forcing factors during the mid- to late-twentieth century. For the

nineteenth century clusters, the drying trend only reverses when

volcanic activity substantially weakens. The precipitation recovery

is only partial, possibly as part of recurrent drying trends in

Mesoamerica

15,19

. Aerosols are a known critical part of the

overall anthropogenic as well as natural forcing of climate (the

latter associated with aeolian dust and volcanic eruptions)

20–22

.

We thus surmise that the decadal drying trends in the early and

late decades of the nineteenth century and during the second half

of the twentieth century are largely a consequence of the clustered

volcanic forcing, with the most recent period superposed on

long-term anthropogenic drying

23,24

. Periods of strong volcanic

activity during the past millennium also often coincide with

periods of anomalous solar activity. This is the case, for instance,

for the first volcanic cluster that coincides with the prolonged

period of weak solar activity known as Dalton Minimum

25

.

We can thus not attribute the reconstructed changes to volcanic

forcing alone.

Gu-Xi-1 1976 2045 1995 1945 1895 1845 1795 1745 1695 1645 1595 0 2 4 6 8 10 12 14 16 18 20 Depth (cm)

U/Th dates for top section of Gu-Xi-1

y = 0.9419x2 – 34.092x + 2007 R2 = 0.9853 1915 1871 1840 Calendar y e ar 1805 1773 1749 1723 1686 1412

Figure 2 | Image of the speleothem and age model. (a) The photograph of GU-Xi-1 stalagmite shows the height of the specimen used in this study (18 cm), with a rounded top and no ‘cup’ that could imply drip erosion. Also shown is the milling channel for the stable isotopes adjacent to a cm ruler as well as the upper nine pits on stalagmite GU-Xi-1 (upper part) used to for age determination. (b) Age model that we used in this study. A thorough discussion on the age model is presented in the methods section. The vertical lines represent the error bars (two s.d.).

–3.6 –3.4 –3.2 –3 –2.8 GUX-I δ 18O (‰ VPDB) –2.6 1930 1940 1950 1960 1970 Time 1980 1990 2000 2010 –80 –40 0

Wet season rainfall

anomaly (Jun–Nov, mm)

40 80

Figure 3 | Comparison between reconstructed and observed Mesoamerican precipitation. Shown are the time series of speleothem GU-Xi-1 d18O (black line, units in permil) and June–November precipitation

anomalies in Belize City, Belize (deviation from climatology in mm, blue line) smoothed with a second order binomial filter. The d18O time series lags the rainfall time series by 6 years.

(5)

Dynamical interpretation of reconstructed changes. Based on

the close agreement between the drying phases and the volcanic

clusters, we hypothesize that the eruption clusters played a

pri-mary role in these climatic changes by inducing perturbations in

patterns of SST variability that in turn crucially influence the

Pacific–Atlantic tropical SST gradient that dominate the

Mesoa-merican hydroclimate. Specifically, we propose that the volcanic

clusters influence the El Nin˜o Southern Oscillation (ENSO) in the

Longitude Latitude –0.3 –0.2 –0.1 0 0 0 0.1 0.1 0.1 0.1 0.1 0.1 0.2 0.4 Longitude Latitude 60°N 30°N 0° 60°N 30°N 0° 60°N 30°N 0° 60°N 30°N 0° 180° 150°W 120°W 90°W 60°W 30°W 0° 180° 150°W 120°W 90°W 60°W 30°W 0° 180° 150°W 120°W 90°W 60°W 30°W 0° 180° 150 °W 120 °W 90 °W 60 °W 30 °W 0 ° –0.2 –0.1 –0.1 –0.1 0 0 0 0.1 0.1 0.1 0.1 0.1 0.1 0.1 0.1 0.2 0.2 0.2 0.3 0.3 0.3 0 –0.3 –0.2 –0.2 –0.2 –0.2 –0.2 –0.1 –0.1 –0.1 –0.1 –0.1 -0.1 –0.1 0 0 0 0 0 0 0.1 0.1 0.1 0.1 0.1 0.1 0.1 0.2 0.2 0.2 0.3 0.3 0.4 Longitude Latitude 0.2 Longitude Latitude –0.3 –0.2 –0.1 0 0 0 0 0.1 0.1 0.1 0.2 0.2 0.3 0.4 0

Figure 4 | Atmosphere and ocean relationships to Mesoamerican rainfall. (a,b) Correlations between summertime (May–October) observed precipitation averaged over the Yucata´n Peninsula and SST (a) and SLP (b). (c,d) Correlations of the SST and SLP fields with the GU-Xi-1 speleothem d18O (multiplied by  1). Contours in all figures are drawn at 0.1 intervals. Regions where the correlation exceeds the 95% confidence level for significance are shaded in colour (orange for positive and light blue for negative).

–3 –3.5 –10 –8 –6 –4 –2 0 e b a 1 2 3 Year AD

Cum. volc. forcing

W/m

2 ×

year

δ

18O (‰ VPDB)

Original and 9 pt avg.

c d 0 Volcanic forcing ( W/m 2) 2000 1950 1900 1850 1800 1750 1700 –2.5 –4 –30 –15 Year AD 2000 1950 1900 1850 1800 1750 1700

Figure 5 | Persistent drying phases over Mesoamerica and volcanic forcing. (a) Volcanic radiative forcing from 1700–2000 C. E. after ref. 28. Dark vertical shaded areas indicate volcanic eruption clusters noted in the text. (b–d) Different estimates of cumulative top-of-atmosphere radiative flux anomalies from different climate simulations: Bergen Climate Model (Fig. 5b, yellow), CCSM4 (Fig. 5c, white) and ECHAM5/MPIOM (Fig. 5d, brown). (e) Interpolated annual time series of speleothem GU-Xi-1 d18O (grey line) with corresponding 11-year moving average values (thick black line). –4.1 –3.7 –3.3 –2.9 –2.5 δ 18 O (‰ VPDB) –8.6 –8.3 –7.9 –7.6 –7.2 –3.6 –4.5 –5.4 –6.3 –7.2 δ 18 O (‰ VPDB) Tambora Krakatoa

Time (year AD)

1700 1750 1800 1850 1900 1950 2000

δ

18

O (‰ VPDB)

Figure 6 | Comparison between stalagmite records from Mesoamerica. (a) GU-Xi-1 (this study); (b) southwestern Guerrero (Mexico)17; and (c) Yucata´n peninsula (Mexico)18. Open circles represent the raw data from each

record. Solid lines represent the 5-point running average applied to the series. The grey circles represent the locations from which the material for the U/Th dates were obtained and the control points of the age models used. The horizontal grey bars represent the uncertainty of each age control point. The difference in alignments of these records depends on their age models (note poor age control of the Yucata´n record18) sampling resolution and extent of

local and cave environmental overprinting.

(6)

equatorial Pacific and the long-term variations of tropical Atlantic

SSTs, which is governed by the Atlantic Multi-decadal Oscillation

(AMO)

26

. An increasing number of climate reconstructions and

simulations describe statistical and dynamical connections

between volcanic forcing and both ENSO

27

and AMO

28–30

.

Indeed, drying (recovery) phases during the volcanic clusters

correspond to cold (warm) phases in a recent marine proxy-based

AMO reconstruction

31

(Fig. 7a), while reconstructed data

32

suggest

an increased role for ENSO

in Mesoamerican

precipitation variability during the twentieth century (Fig. 7b).

The preferred time scales of significant coherence with the d

18

O

signal differ between ENSO and AMO, as the former index

highlights interdecadal time scales (O(30 years)), while the latter

highlights multi-decadal time scales (O(50 years)), further

suggesting that the linkages may reflect different teleconnection

mechanisms (see also Fig. 7c). Such differences in the relative

roles of climatic modes indicate that internal dynamics play a

substantial role in communicating high atmospheric evolution

during the different volcanic eruption clusters to the surface. This

exemplifies the complexity of a dynamical interpretation, and

hence attribution, of the reconstructed changes in Mesoamerican

precipitation. Moreover, reconstructions of climate modes often

lack robustness due to the inherent uncertainties implicated in

reconstructing large-scale features from a limited number of local

climate proxies. This has been shown for the North Atlantic

Oscillation

33

that captures a dominant part of the short- and

long-term variability of large-scale atmospheric circulation over

the North Atlantic, which is a known factor influencing

Mesoamerican precipitation (Figs 4b,d) and is sensitive to

volcanic forcing

34,35

.

A warranted dynamical interpretation based on modelling

results is also complicated by the fact that last-millennium

simulations from state-of-the-art global climate models do not

show a consistent response of Mesoamerican precipitation to

strong volcanic activity (Fig. 8), failing to robustly reproduce the

patterns reconstructed from our speleothem. The discrepancy

between our reconstruction and the simulations can be ascribed

to general deficiencies still affecting the simulated representation

of key chemical and physical processes related to aerosol forcing,

and to the consequent large uncertainties in the simulated climate

response to volcanic forcing

25,36

. Further possible explanations

are the common model deficiencies concerning regional

precipitation variability at the decadal and multi-decadal time

δ18O - AMO δ18O - ENSO δ18O - (AMO-ENSO)

0.9 0.8 0.5 P er iod (y ears) 4 8 16 32 64 –4 P er iod (y ears) 4 8 16 32 64 0.9 0.8 0.5 –2 2 –5 0 0 –4 –3.5 –2.5 –3 –4 –3.5 –2.5 δ18O AMO –3 0.9 0.8 0.5 P er iod (y ears) Time (year) Time (year) 1800 1820 1840 1860 1880 1900 1920 1940 1960 1980 1800 1820 1840 1860 1880 1900 1920 1940 1960 1800 1820 1840 1860 1880 1900 1920 1940 1960 Time (year) 4 8 16 32 64 –3 –3.5 –4 –2.5 –2 –4 2 0 δ18 O δ18O AMO-ENSO ENSO

Figure 7 | Linkage between reconstructed Mesoamerican precipitation and dominant modes of climate variability. The different panels show wavelet coherences (power in colour shading) between the speleothem d18O and: (a) the AMO reconstruction by Svendsen et al.31; (b) the integrated ENSO/PDO

reconstruction by ref. 32; and (c) the difference between the two. The time series are shown in the top and middle panels (blue: d18O; turquoise: AMO;

magenta: ENSO; black: difference between AMO and ENSO). The arrows illustrate the phase relationship: rightward (leftward) arrows indicate co-phase (anti-phase); northward and southward oriented arrows indicate quadrature. Thick contour lines identify significant62coherence. The thin black lines are the cone of influence, where edge effects occur.

14.00 Model simulated Yucatán Jun – Nov precipitation 12.00 Precipitation (mm/day) Precipitation anomaly (mm/day) 10.00 8.00 6.00 4.00 2.00 0.00 1.2

10–yr running mean model simulated Yucatán Jun–Nov precipitation anomaly 1 0.8 0.6 0.4 0.2 –0.2 –0.4 –0.6 –0.8 –1 1700 MPI-ESM-P mm/day MPI-ESM-P IPSL-CS5A-LR GISS-E2-R FGOALS -gl CCSM4 bcc-csm1–1 1750 1800 1850 Year AD 1900 1950 2000 1950 2000 0 1700 1750 1800 1850 1900 Year AD

Figure 8 | June–November precipitation in Yucata´n from Coupled Model Intercomparison Project 5 simulations covering the period 1700–2005. (a) Raw time series, (b) 10-year running mean, where the climatological mean has been subtracted.

(7)

scales

37

, which are linked to poor and hence less robustly

simulated representation of dominant modes of large-scale

climate variability and associated teleconnections including

ENSO

38

and the AMO

39

. Large uncertainties also affect the

reconstructed forcing

40

and we have very limited knowledge

about the background climate conditions at the time of volcanic

eruptions that occurred before the last half of the twentieth

century

30

.

Discussion

The prolonged post-eruption drying conditions in Mesoamerica

described

by

our

new

speleothem-based

data

provide

independent evidence that volcanic effects on tropical climate

persist well beyond the duration of the direct radiative

imbalance

35

. We suggest that volcanically induced changes in

dominant modes of large-scale, ocean–atmosphere coupled

variability is a likely physical mechanism contributing to such

persistence. Further studies are needed to clarify the dynamics

governing the response. Still, our observation relating clusters of

large volcanic eruptions to prolonged decreased Mesoamerican

precipitation should expand the emerging discussion fostered by

indications from global climate models regarding the strong

sensitivity of the world’s other monsoons to external forcing

41,42

.

Our results, in combination with studies of global stream flows

after large volcanic eruptions

43

, imply that certain tropical

hydroclimates may be highly sensitive to volcanic forcing and,

more generally, to large stratospheric aerosols loading

24

. Global

climate models have become increasingly important to our

physical understanding of such ‘global forcing to regional

response’

connections.

As

discussed,

however,

related

uncertainties affecting the simulated representation (or lack

thereof) of key processes as well as the reconstructed external

forcing

that

is

imposed

on

paleo-simulations

remain

considerable. We need to better understand such critical aspects

of reconstructed as well as simulated pre-industrial tropical

climate evolution in order to increase our confidence in projected

future regional precipitation trends and variability and to

potentially customize solutions for particular regions.

Methods

Speleothem characteristics and analysis

.

We collected the GU-Xi-1 stalagmite in 2007 from the Xibalba cave located in a thick forest near the Guatemala/Belize border (Fig. 1b), and mapped its underground location relative to the surface. The ceiling height varies from 10 m to 440 m. The collection site lies well above the level of modern floods, which eliminates inaccuracies in dating due to possible initial detrital230Th. GU-Xi-1 was active and growing at the time of collection,

with a columnar shape indicating it was a product of a single-drip source. The stalagmite was cut into two sections and a 1-cm thick slab was produced from one of the sections.

Age model

.

An amount of 200 mg of powder was collected with a hand-held dental drill from a polished slab section of GU-Xi-1 along growth layers for dating. Nine230Th dates were analyzed in the upper 175 mm resulting in an age control

point approximately every 30 years (Fig. 2a). We analyzed three samples for thorium and uranium isotopes separately on a Finnigan-MAT Element outfitted with a double focusing sector field magnet in reversed Nier–Johnson geometry and a single Mas Com multiplier. We measured combined ionization plus transmission efficiency of 2.5–3% for uranium and 1.5–2% for thorium. Dating resolution using the machine was 40–80 years. Six more samples were analyzed with a Neptune ICP-MS MC, with a dating resolution ofo4 years. Further details of instrumental procedures are explained in refs 44,45. We obtained these dates with a magnetic sector inductively-coupled plasma mass spectrometer at the University of Minnesota, Isotope Laboratory46. Chemical separation procedures followed those

described in ref. 47. The age model for the speleothem is based on a parabolic curve fit to the230Th dates and the collection date (Fig. 2b). Error bars are larger for the ages determined with a Finnigan-MAT Element compared with the dating resolution obtained using the Neptune ICP-MS MC (Fig. 2b). We used AnalySeries (http://www.lsce.ipsl.fr/logiciels/index.php) to regress the U/Th ages with depth. We found that the upper section of GU-Xi-1 grew according to a second-degree polynomial that was parabolic (r ¼ 0.99). We removed any sampling bias with AnalySeries using the integration method to provide evenly spaced annual samples.

We used the resulting polynomial equation to convert each sample depth to calendar ages from the speleothem, which we used for our age model.

Different possible age models have been tested (Supplementary Fig. 5), including StalAge48, COPRA49, calcium (Ca) layer counting and the average

between StalAge and the Ca count methods (ChronMean). All the tested models agree closely with the timing of the drying event observed from the stable isotope record associated with the Tambora eruption. The largest uncertainty is the timing of the Krakatau eruption. It should be noted that because GU-Xi-1 growth slowed down considerably towards the present (from 1915 to 2007 it grew 2.5 times slower than from 1840 to 1871) any error for the more recent samples in assigning a depth to a U/Th date is exacerbated. StalAge is a routinely used algorithm specifically designed for speleothems. It takes into account outliers and age inversions using a Monte Carlo simulation. In our case, as we do not have outliers or age inversions, it basically performs a linear interpolation between age points. A similar age model49

gives near identical results to that of StalAge. Another approach is to count the annual laminations (clearly present in GU-Xi-1). We are confident the laminations are annual because the number of laminations counted is within 97% confidence limits of the U/Th dates. The annual layers are tedious to count and also produce subjective counting errors. Another more objective method is to count the number of annual Ca peaks that clearly follow the annual banding. During summer more Ca is incorporated in the speleothems50. The results from this method are shown as the Ca counts chronology in Supplementary Fig. 1 and clearly lie to the right (younger) side of the age model especially from 1830 to the present. According to StalAge the ‘Krakatau’ event (as seen in the stable isotopes) occurred in 1864 (about 20 years earlier) but according to the Ca counts the event occurred in 1910 (about 20 years later). StalAge based on U/Th dates may be biased towards recent samples because of the greater uncertainties (5–10% of the absolute age51) for younger

speleothems with low U, thus limiting the possibility to correlate time-series based on speleothems with those based on instruments. A further approach is to take the mean of both the StalAge and the Ca count methods. The mean is shown as the ‘ChronMean’ in Supplementary Fig. 5. The ChronMean model also smoothes any U/Th depth sampling error. The ChronMean is nearly identical to our parabolic fit for stalagmite GU-Xi-1 from 1750 onwards giving us confidence in our age chronology and timing of the isotopes events to the volcano chronology. Furthermore, there is supporting evidence that some stalagmites grow in a parabolic fashion. Parabolic growth of speleothems has been previously noted52

and may be a natural function of conical growth. Finally, the similarity of our record with that from another stalagmite from MesoAmerica17(Fig. 6) increases our confidence on the robustness of our age model.

Samples and d18O isotopic analysis

.

582 samples were continuously milled along

the stalagmite growth axis of GU-Xi-1 stalagmite using a digitally controlled micro-milling machine (SHERLINE 5410). Samples were milled at 0.3 mm intervals (Fig. 2a) giving a temporal resolution ranging between yearly at the top and seasonal at the bottom. Growth rate of the speleothem fluctuated from B1–3 mm per year. The samples were analyzed using a continuous flow isotope ratio mass spectrometry53at the ETH Zurich, Switzerland. Details on the

methodology are given in ref. 53. MS2 was used as in-house reference material (powdered Carrara marble, MS253), with isotope ratios (18O/16O and13C/12C) reported in standard Delta notation relative to the Vienna Pee Dee Belemnite (% VPDB) standard (see Supplementary data 1). The external analytical precision for d18O is better than 0.06%.

Amount effect

.

The amount effect on stalagmites has been rigorously studied for Mesoamerica and has shown to be valid15,16. The comparison between

precipitation and d18O in Fig. 3 indicates that the speleothem’s oxygen isotopic properties capture the low-frequency variations of rainfall outside the cave, with the proportion of heavy isotope inversely proportional to the amount of precipitation.

Observational datasets

.

The precipitation data are from the University of East Anglia—Climate Research Unit gridded historical Time Series version 3.21 for 1901–2012 (for more information, see:http://badc.nerc.ac.uk/view/badc.nerc.ac. uk__ATOM__ACTIVITY_0c08abfc-f2d5-11e2-a948-00163e251233). The SST data are from the NOAA National Climate Data Center Extended Reconstructed Sea Surface Temperature analysis54version 3b averaged over the summer months

between 1901 and 2012 in Fig. 4a, and between1880 and 2006 in Fig. 4c to fit with the length of the observed precipitation and d18O records, respectively. The SLP data are from the NOAA Environmental Research Laboratories Twentieth Century Reanalysis Project55version 2, covering the period between 1901 and 2006 in Fig. 4b and between 1880 and 2006 in Fig. 4d. The SLP data were averaged over the winter (December–March) preceding the summer, as this is when the atmosphere forces the SST pattern seen in Fig. 4a10. Support for the Twentieth Century

Reanalysis Project dataset was provided by the US Department of Energy, Office of Science Innovative and Novel Computational Impact on Theory and Experiment program and Office of Biological and Environmental Research and by the National Oceanic and Atmospheric Administration Climate Program Office.

(8)

Data for Belize-City precipitation is from the National Oceanic and Atmospheric Administration, monthly Global Historical Climatology Network (http://www.ncdc.noaa.gov/ghcnm/).

Simulated precipitation datasets

.

Time series of Yucata´n precipitation covering the period 1700–2005 were obtained from an ensemble of climate model simula-tions from the repository of the Coupled Model Intercomparison Project 5. For each model, the time series were created by merging the data from the last-millennium simulation (past1000, which ends in 1849) with the corresponding data from one of the historical simulations (starting in 1850). Yucata´n is defined as the area between 91°W and 87°W and between 16°N and 22°N (all model data were interpolated to a 2°  2° grid before selecting the region).

Volcanic forcing estimates

.

Forcing estimates from ECHAM5/MPIOM56and

Bergen Climate Model28are derived from volcanic forcing-only and natural (volcanic and solar) last-millennium simulations, respectively. Forcing estimates for CCSM457are derived from the full-forcing last-millennium simulation available

in the Coupled Model Intercomparison Project 5 repository. Long-term influences from greenhouse gases in CCSM4 are accounted for by removing the fourth-order polynomial trend over the period 1750–2005. Natural forcing was then estimated based on clear-sky top-of-atmosphere radiative fluxes to discard cloud related feedbacks. The simulations use different reconstructions of aerosol optical properties for volcanic forcing: ECHAM5/MPIOM uses the reconstruction by58;

Bergen Climate Model uses the reconstruction by59; CCSM4 uses the

reconstruction by60. Cumulative volcanic forcing is obtained by cumulatively adding the forcing of each volcanic event through time.

Statistical significance

.

Statistical significance for correlations accounts for the effective degrees of freedom based on autocorrelation following the method by61.

The lag in Fig. 3 was determined based on a cross-correlation analysis between the two time series with lags varying between  10 and þ 10 years. The binomial smoothed 71-year precipitation record shown in Fig. 3 has 15 degrees of freedom, so that a correlation value of 0.43 is significant at the 95% level using a directional test (appropriate in this case as we can surmise that the precipitation is the driver of the d18O variations and not vice versa).

Wavelet analysis

.

Wavelet coherence spectra were calculated using the tool by ref. 62. For additional information, see ref. 63. The power of the wavelet coherence spectrum can be interpreted as a measure of the strength of the local (in the time-frequency domain) correlation between the two time series.

References

1. Allen, R. P. et al. Physically consistent responses of the global atmospheric hydrological cycle in models and observations. Surv. Geophys. 35, 522–552 (2014).

2. Rauscher, S. A., Kucharski, F. & Enfield, D.B. The role of regional SST warming variations in the drying of Meso-america in future climate projections. J. Climate 24, 2003–2016 (2011).

3. Giannini, A., Kushnir, Y. & Cane, M. A. Interannual variability of Caribbean rainfall, ENSO, and the Atlantic Ocean. J. Climate 13, 297–311 (2000). 4. Waliser, D. E. & Gautier, C. H. A satellite-derived climatology of the ITCZ.

J. Climate 6, 2162–2174 (1993).

5. Richey, J. N., Poore, R. Z., Flower, B. P., Quinn, T. M. & Hollander, D. J. Regionally coherent little ice age cooling in the Atlantic warm pool. Geophys. Res. Lett. 36, L21703 (2009).

6. Lachniet, M. S., Patterson, W. P., Burns, S., Asmerom, Y. & Polyak, V. Caribbean and Pacific moisture sources on the Isthmus of Panama revealed from stalagmite and surface water d18O gradients. Geophys. Res. Lett. 34,

L01708 (2007).

7. Seager, R. et al. Mexican drought: an observational modeling and tree ring study of variability and climate change. Atmo´sfera 22, 1–31 (2009). 8. Kushnir, Y., Seager, R., Ting, M., Naik, N. & Nakamura, J. Mechanisms of

tropical Atlantic SST influence on North American precipitation variability. J. Climate 23, 5610–5628 (2010).

9. Dai, A. & Wigley, T. M. L. Global patterns of ENSO-induced precipitation. Geophys. Res. Lett. 27, 1283–1286 (2000).

10. Hurrell, J. W. et al. The North Atlantic oscillation: climatic significance and environmental impact. AGU Geophysical Monograph 134, 279, 2002). 11. Giddings, L. et al.in The Lowland Maya Area: Three Millennia at the

Human-Wildland Interface (eds Go´mez-Pompa, A., Allen, M. F., Fedick, S. L., Jime´nez-Osornio, J. J.) 77–89 (CRC, 2003).

12. Acuna-Soto, R., Stahle, D. W., Cleaveland, M. K. & Therrell, M. D. Megadrought and megadeath in 16th century Mexico. Emerg. Infect. Dis. 8, 360–362 (2002).

13. Miller, T. E. Geologic and hydrologic controls on Karst and cave development in Belize. J. Cave Karst Stud. 58, 100–120 (1996).

14. Dansgaard, W. Stable isotopes in precipitation. Tellus 16, 436–468 (1964).

15. Kennett, D. J. et al. Development and disintegration of Maya political systems in response to climate change. Science 338, 788–791 (2012).

16. Lachniet, M. S. & Patterson, W. P. Oxygen isotope values of precipitation and surface waters in northern Central America (Belize and Guatemala) are dominated by temperature and amount effects. Earth Planet. Sci. Lett. 284, 435–446 (2009).

17. Lachniet, M. S., Bernal, J. P., Asmerom, Y., Polyak, V. & Piperno, D. A 2400 yr Mesoamerican rainfall reconstruction links climate and cultural change. Geology 40, 259–262 (2012).

18. Medina-Elizalde, M et al. High resolution climate record from the Yucata´n Peninsula spanning the Maya terminal classic period. Earth Planet. Sci. Lett. 298,255–262 (2010).

19. Webster, J. W. et al. Stalagmite evidence from Belize indicating significant droughts at the time of Preclassic Abandonment, the Maya Hiatus, and the Classic Maya collapse. Palaeogeogr. Palaeoclimatol. Palaeoecol 250, 1–17 (2007).

20. Bindoff, N.L. et al.In: Climate Change 2013: The Physical Science Basis. Contribution of Working Group I to the Fifth Assessment Report of the Intergovernmental Panel on Climate ChangeStocker, T.F., Qin, D., Plattner, G.-K., Tignor, M., Allen, S.K., Boschung, J., Nauels, A., Xia, Y., Bex, V. & Midgley, P.M. (eds.) (Cambridge University Press, 2013).

21. Ding, Y. et al. Ocean response to volcanic eruptions in Coupled Model Intercomparison Project 5 (CMIP5) simulations. J. Geophys. Res. 119, 5622–5637 (2014).

22. Santer, B. D. et al. Volcanic contribution to decadal changes in tropospheric temperature. Nat. Geosci. 7, 185–189 (2014).

23. Rauscher, S. A., Giorgi, F., Diffenbaugh, N. S. & Seth, A. Extension and intensification of the Meso-American mid-summer drought in the twenty-first century. Clim. Dynam. 31, 551–571 (2008).

24. Ridley, H. E. et al. Aerosol forcing of the positionof the intertropical convergence zone since AD 1550. Nature Geosci 8, 195–200 (2014). 25. Anet, J. G. et al. Impact of solar versus volcanic activity variations on

tropospheric temperatures and precipitation during the Dalton Minimum. Clim. Past 10, 921–938 (2014).

26. Schlesinger, M. E. An oscillation in the global climate system of period 65-70 years. Nature 367, 723–726 (1994).

27. Li, J. et al. El Nin˜o modulations over the past seven centuries. Nat. Clim. Change 3, 822–826 (2013).

28. Otterå, O. H., Bentsen, M., Drange, H. & Suo, L. External forcing as a metronome for Atlantic multidecadal variability. Nat. Geosci 3, 688–694 (2010). 29. Mignot, J., Khodri, M., Frankignoul, C. & Servonnat, J. Volcanic impact

on the Atlantic Ocean over the last millennium. Clim. Past. 7, 1439–1455 (2011).

30. Zanchettin, D. et al. Background conditions influence the decadal climate response to strong volcanic eruptions. J. Geophys. Res. 118, 1–17 (2013). 31. Svendsen, L., Hetzinger, S., Keenlyside, N. & Gao, Y. Marine-based multiproxy

reconstruction of Atlantic multidecadal variability. Geophys. Res. Lett. 41, 1295–1300 (2014).

32. McGregor, S., Timmermann, A. & Timm, O. A unified proxy for ENSO and PDO variability since 1650. Clim. Past. 6, 1–17 (2010).

33. Lehner, F., Raible, C. C. & Stocker, T. F. Testing the robustness of a precipitation proxy-based North Atlantic Oscillation reconstruction. Quat. Sci. Rev 45, 85–94 (2012).

34. Stenchikov, G. et al. Arctic oscillation response to volcanic eruptions in the IPCC AR4 climate models. J. Geophys. Res. 111, D07107 (2006). 35. Zanchettin, D. et al. Bi-decadal variability excited in the coupled

ocean–atmosphere system by strong tropical volcanic eruptions. Clim. Dyn 39, 419–444 (2012).

36. Timmreck, C. Modeling the climatic effects of large explosive volcanic eruptions. WIREs Clim. Change 3, 545–564 (2012).

37. Ault, T. R., Cole, J. E. & St. George, S. The amplitude of decadal to multidecadal variability in precipitation simulated by state-of-the-art climate models. Geophys. Res. Lett. 39, L21705 (2012).

38. Zou, Y., Yu, J.-Y., Lee, T., Lu, M.-M. & Kim, S. T. CMIP5 model simulations of the impacts of the two types of El Nin˜o on the U.S. winter temperature. J. Geophys. Res. Atmos 119 (2014).

39. Kavvada, A., Ruiz-Barradas, A. & Nigam, S. AMO’s structure and climate footprint in observations and IPCC AR5 climate simulations. Clim. Dyn 41, 1345–1364 (2013).

40. Schmidt, G. A. et al. Using paleo-climate comparisons to constrain future projections in CMIP5. Clim. Past 10, 221–250 (2014).

41. Zorita, E. et al. Climate evolution in the last five centuries simulated by an atmosphere-ocean model: global temperatures, the North Atlantic Oscillation and the Late Maunder Minimum. Meteorol. Z. 13, 271–289 (2004). 42. Ammann, C. M., Joos, F., Schimel, D. S., Otto-Bliesner, B. L. & Tomas, R. A.

Solar influence on climate during the past millennium: results from transient simulations with the NCAR Climate System Model. Proc. Natl Acad. Sci. USA 104,3713–3718 (2007).

(9)

43. Oman, L., Robock, A., Stenchikov, G. L. & Thordarson, T. High-latitude eruptions cast shadow over the African monsoon and the flow of the Nile. Geophys. Res. Lett. 33, L18711 (2006).

44. Shen, C. -C. et al. Uranium and thorium isotopic and concentration measurements by magnetic sector inductively coupled plasma mass spectrometry. Chem. Geology 185, 165–178 (2002).

45. Lauritzen, S. -E. & Lundberg, J. Calibration of the speleothem delta function: an absolute temperature record for the Holocene in northern Norway. Holocene 9, 659–669 (1999).

46. Edwards, R. L., Gallup, C. D. & Cheng, H. Uranium-series dating of marine and lacustrine carbonates. Rev.Mineral. Geochem. 52, 363–405 (2003).

47. Spo¨tl, C. & Vennemann, T. W. Continuous-flow IRMS analysis of carbonate minerals. Rap. Commun. Mass Spectrom. 17, 1004–1006 (2003).

48. Scholz, D. & Hoffmann, D. L. StalAge—An algorithm designed for construction of speleothem age models. Quat.Geochronol. 6, 369–382 (2011).

49. Breitenbach, S. F. M. et al. Constructing proxy records from age models (COPRA). Clim. Past 8, 1765–1779 (2012).

50. Baker, A. et al. Testing theoretically predicted stalagmite growth rate with recent annually laminated samples: implications for past stalagmite deposition. Geochim. Cosmochim. Acta. 62, 393–404 (1998).

51. Fleitmann, D. & Spo¨tl, C. Editorial: advances in speleothem research. PAGES Newslett. 16, 2 (2008).

52. Franke, H. W. The theory behind stalagmite shapes. Stud. Speleol. 1, 89–95 (1965).

53. Breitenbach, S. F. M. & Bernasconi, S. M. Carbon and oxygen isotope analysis of small carbonate samples (20 to 100 mg) with a GasBench II preparation device. Rap. Commun. Mass Spectrom. 25, 1910–1914 (2011).

54. Smith, T. M., Reynolds, R. W., Peterson, T. C. & Lawrimore, J. Improvements to NOAA’s Historical Merged Land-Ocean Surface Temperature Analysis (1880-2006). J. Clim 21, 2283–2296 (2008).

55. Compo, G. P. et al. The Twentieth Century Reanalysis project. Q. J. Roy. Meteorol. Soc. 137, 1–28 (2011).

56. Jungclaus, J. H. et al. Climate and carbon-cycle variability over the last millennium. Clim. Past. 6, 723–737 (2010).

57. Landrum, L. et al. Last millennium climate and its variability in CCSM4. J. Clim. 26, 1085–1111 (2012).

58. Crowley, T. et al. Volcanism and the Little Ice Age. PAGES Newslett. 16, 22–23 (2008).

59. Crowley, T. J. et al. Modeling ocean heat content changes during the last millennium. Geophys. Res. Lett. 30, 1932 (2003).

60. Gao, C., Robock, A. & Ammann, C. Volcanic forcing of climate over the last 1500 years: an improved ice core–based index for climate models. J. Geophys. Res. 113 (2008).

61. Dawdy, D. R. & Matalas, N. C. Statistical and probability analysis of hydrologic data, part III: Analysis of variance, covariance and time series. in VenTe Chow

(ed Handbook of Applied Hydrology, a Compendium of Water-Resources Technology (McGraw-Hill Book Companyp 8.68–8.90, 1964).

62. Grinsted, A, Moore, J. C. & Jevrejeva, S. Application of the cross wavelet transform and wavelet coherence to geophysical time series. Nonlin. Proc. Geophys. 11, 561–566 (2004).

63. Torrence, C. & Compo, G. P. A practical guide to wavelet analysis. Bull. Am. Meteor. Soc 79, 61–78 (1998).

Acknowledgements

A.W. thanks the Swiss Federal Institute of Technology both for hosting his sabbatical and for the analysis of the stable isotopes. A.W. also thanks Cluster of Excellence CliSAP at the University of Hamburg for sponsoring collaboration. Collection of GU-Xi-1 by T.M. was supported through a sabbatical granted by the University of Puerto Rico (Mayagu¨ez) and the National Geographic Society Grant no. 3089-85 to T.M. partially supported survey of the cave and location of the stalagmite. The research was supported in part by the National Science Foundation ATM-1003502. Y.K. was also supported by grant NA10OAR4310137 from the National Oceanic and Atmospheric Administration— Climate Program Office. S.F.M.B. acknowledges financial support from the Schweizer National Fond Project CRS122 132646/1. D.B. was supported by National Science Foundation Grant ATM-1003219. G.L. acknowledges support from Helmholtz through PACES and REKLIM. We acknowledge the World Climate Research Program Working Group on Coupled Modeling, which is responsible for CMIP, and we thank the climate modelling groups for producing and making available their model output. Paul Sammarco (LUMCON) is thanked for some advice regarding statistical and data inter-pretation. This paper is a Lamont Doherty Contribution number 7901. LB was supported by the French National Research Agency under EL PASO grant 10-Blan-608-01.

Author contributions

A.W., Y.K. and D.B. conceived the project. T.M. selected and retrieved the stalagmite, and mapped its locations with respect to the surface. A.W., D.Z., Y.K., D.B., G.L. and A.R. wrote most of the paper. A.B., G.H.H., J.E.M., S.B., L.B., D.Z. and H.C. performed the experiments and analytical work.

Additional Information

Supplementary Informationaccompanies this paper at http://www.nature.com/ naturecommunications

Competing financial interests: The authors declare no competing financial interests. Reprints and permissioninformation is available online at http://npg.nature.com/ reprintsandpermissions.

How to cite this article: Winter, A. et al. Persistent drying in the tropics linked to natural forcing. Nat. Commun. 6:7627 doi: 10.1038/ncomms8627 (2015).

Figure

Figure 1 | Geographical characteristics of the study area. (a) Location map of Mesoamerica and of the Xibalba cave; (b) Map of the speleothem site with major physical features of the cave.
Figure 2 | Image of the speleothem and age model. (a) The photograph of GU-Xi-1 stalagmite shows the height of the specimen used in this study (18 cm), with a rounded top and no ‘cup’ that could imply drip erosion
Figure 5 | Persistent drying phases over Mesoamerica and volcanic forcing. (a) Volcanic radiative forcing from 1700–2000 C
Figure 8 | June–November precipitation in Yucata ´n from Coupled Model Intercomparison Project 5 simulations covering the period 1700–2005.

Références

Documents relatifs

After formalizing the ecological processes studied, results on case studies on generalist vs specific pests & pathogens with low vs high dispersal ability, will

f⫹, which are very similar to long damped Rossby waves propagating westward in an open basin, allow conveniently to describe the part of the response that does not depend on

We define the set of L-primitive pointer recursive functions as the closure of the basic pointer functions of Sections 2 and 4 under composition, (mutual) primitive recursion

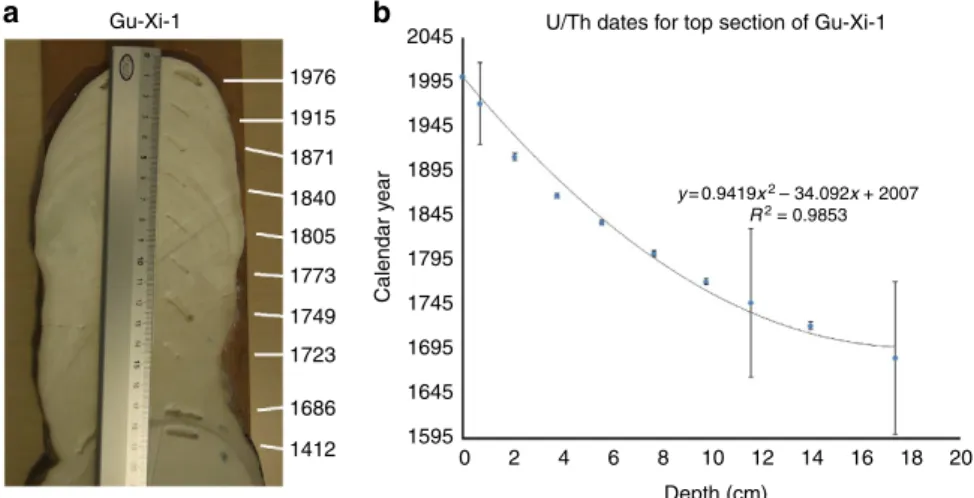
As growth ring formation in dry tropical regions (like Ethiopia), as opposed to temperate and boreal regions, can be more sensitive to conditions that are generally less pre-

This paper illustrates the design of the idealized volcanic perturbation experiments in the VolMIP protocol and describes the com- mon aerosol forcing input data sets to be used..

Previously radiosonde observations from SHADOZ networks have been used to validate tropo- spheric ozone observations obtained from satellites (Ziemke et al., 2006, 2011), to study

Multi-decadal to centennial hydro-climate variability and linkage to solar forcing in the Western Mediterranean during the last 1000

The variability and long-term trends of natural sub-thermocline shelf hypoxia have come to be understood as the result of the dynamical interaction between ventilation, advection