HAL Id: hal-02988094
https://hal.sorbonne-universite.fr/hal-02988094
Submitted on 4 Nov 2020
HAL is a multi-disciplinary open access
archive for the deposit and dissemination of
sci-entific research documents, whether they are
pub-lished or not. The documents may come from
teaching and research institutions in France or
abroad, or from public or private research centers.
L’archive ouverte pluridisciplinaire HAL, est
destinée au dépôt et à la diffusion de documents
scientifiques de niveau recherche, publiés ou non,
émanant des établissements d’enseignement et de
recherche français ou étrangers, des laboratoires
publics ou privés.
Mismatched dynamics of dissolved organic carbon and
chromophoric dissolved organic matter in the coastal
NW Mediterranean Sea
Elvia D.Sánchez-Pérez, Mireille Pujo-Pay, Eva Ortega-Retuerta, Pascal
Conan, Francesc Peters, Cèlia Marrasé
To cite this version:
Elvia D.Sánchez-Pérez, Mireille Pujo-Pay, Eva Ortega-Retuerta, Pascal Conan, Francesc Peters, et
al.. Mismatched dynamics of dissolved organic carbon and chromophoric dissolved organic matter in
the coastal NW Mediterranean Sea. Science of the Total Environment, Elsevier, 2020, 746, pp.141190.
�10.1016/j.scitotenv.2020.141190�. �hal-02988094�
Mismatched dynamics of dissolved organic carbon and chromophoric
dissolved organic matter in the coastal NW Mediterranean Sea
Elvia D. Sánchez-Pérez
a,c,⁎
,1, Mireille Pujo-Pay
b, Eva Ortega-Retuerta
b, Pascal Conan
c,
Francesc Peters
a, Cèlia Marrasé
aa
ICM-CSIC, Institut de Ciències del Mar, Passeig Marítim de la Barceloneta 37-49, 08003 Barcelona, Catalunya, Spain
b
CNRS, UMR 7621, Laboratoire d'Océanographie Microbienne, Observatoire Océanologique, F-666650 Banyuls/mer, France
c
Sorbonne Université, UMR 7621, Laboratoire d'Océanographie Microbienne, Observatoire Océanologique, F-66650 Banyuls/mer, France
H I G H L I G H T S
• DOM composition monitored during 15 months in a NW Mediterranean coastal station.
• Fluorescent DOM dynamics was influ-enced by freshwater intrusions. • A decrease in nutrients due to
stratifica-tion promoted surface DOC accumula-tion.
• A temporal mismatch was found be-tween chlorophyll a and dissolved or-ganic matter. G R A P H I C A L A B S T R A C T
a b s t r a c t
a r t i c l e i n f o
Article history: Received 20 October 2019 Received in revised form 20 July 2020 Accepted 21 July 2020Available online 25 July 2020 Editor: Damia Barcelo
Coastal marine ecosystems are strongly influenced by different occasional events, such as intense winds, mixing, rain and river discharges. These events can directly or indirectly cause changes in dissolved organic matter (DOM) quality through a cascade of different biotic and abiotic processes. Changes in DOM quality are often associated with changes in DOM optical properties. Thus, examining the dynamics of chromo-phoric DOM (CDOM) can provide valuable information about biological and physical processes that have occurred in the ecosystem. Episodic meteorological events, particularly in temperate areas, appear very abruptly and induce very rapid responses; therefore, high time-resolved measurements are needed to cap-ture them. We used a weekly sampling scheme to characterize DOM and nutrient dynamics in the NW Med-iterranean coastal station‘SOLA’. From February 2013 to April 2014, we measured several physical and chemical variables including temperature, salinity, inorganic nutrients, chlorophyll a dissolved organic car-bon (DOC), CDOM andfluorescent DOM (FDOM). During this period, two extremely high fresh water intru-sions greatly influenced the dynamics of some DOM fractions, in particular the FDOM. Inorganic nutrients and chlorophyll a showed seasonal patterns: A winter period characterized by a high nutrient concentration in surface waters favored the phytoplankton spring bloom; then, summer stratification extended until autumn. This stratification led to nutrient depletion and, consequently, lower chlorophyll a values in the photic zone. The CDOM and FDOM optical active fractions did not follow temporal trends similar to total DOC. This was likely because the potential sources and sinks of these DOM pools are microbial activity
Keywords:
Dissolved organic matter Chromophoric DOM Fluorescent DOM Meteorological events Mediterranean Sea
⁎ Corresponding author at: Sorbonne Université, UMR 7621, Laboratoire d'Océanographie Microbienne, Observatoire Océanologique, F-66650 Banyuls/mer, France. E-mail address:[email protected](E.D. Sánchez-Pérez).
1
CONACyT-Instituto Politécnico Nacional-Centro Interdisciplinario de Ciencias Marinas (IPN-CICIMAR), Departamento de Plancton y Ecología Marina, La Paz, BCS, México.
https://doi.org/10.1016/j.scitotenv.2020.141190
0048-9697/© 2020 The Authors. Published by Elsevier B.V. This is an open access article under the CC BY-NC-ND license (http://creativecommons.org/licenses/by-nc-nd/4.0/).
Contents lists available atScienceDirect
Science of the Total Environment
j o u r n a l h o m e p a g e :w w w . e l s e v i e r . c o m / l o c a t e / s c i t o t e n vand light exposure, and these were acting simultaneously but in opposite directions. Interestingly, DOC ex-hibited the highest concentrations in summer, coinciding with nutrient and chlorophyll a minima. To explain this mismatch, we propose a sequence of abiotic and biotic phenomena that drive DOC temporal dynamics.
© 2020 The Authors. Published by Elsevier B.V. This is an open access article under the CC BY-NC-ND license (http:// creativecommons.org/licenses/by-nc-nd/4.0/).
1. Introduction
With 660 Pg C, the oceanic dissolved organic matter (DOM) pool represents one of Earth's largest organic carbon reservoirs, an amount equivalent to C as atmospheric CO2(Hedges, 2002). Therefore, the
mechanisms that produce and recycle DOM in the ocean are crucial for predicting further changes in CO2captured by the ocean (Wagner
et al., 2020). Chromophoric Dissolved Organic Matter (CDOM) is the fraction of dissolved organic matter comprised by optically active com-pounds. CDOM in oceanic regions represents about 70% of the total dis-solved organic carbon (DOC), and this percentage can increase in areas with a riverine influence (Blough and Del Vecchio, 2002;Coble, 2007). Given that light absorption by CDOM occurs mainly in the ultraviolet spectra, this DOM pool is key in regulating UV light penetration in the water column and its consequent damages to biological communities (Kuwahara et al., 2000). However, its significant absorption also in the visible spectra interferes with primary production. This last effect is particularly remarkable in view of efforts to estimate chlorophyll a con-centration from space (Böhm et al., 2016). In addition, CDOM measure-ments allow us to calculate indexes that provide information about chemical structure and biogeochemical processes of DOM in aquatic en-vironments (Green and Blough, 1994). For example, the specific absorp-tion coefficient at 254 nm [a*CDOM(254)], has been used as a proxy for aromaticity (Weishaar et al., 2013), and the slope of the CDOM absorp-tion spectrum can be used as a surrogate of DOM molecular weight (Helms et al., 2008)
The CDOM fraction which contains compounds that emit light when excited by ultraviolet radiation is calledfluorescent dissolved organic matter (FDOM). FDOM dynamics in aquatic systems have been charac-terized usingfluorescence spectroscopy analyses and, in particular, measurements of Excitation-Emission Matrices (EEMs) (Blough and Del Vecchio, 2002;Nieto-Cid et al., 2006;Romera-Castillo et al., 2010).
Coble (1996)used EEMs to define different groups of substances that provide complementary information about DOM origin and lability. In the present study, we focus on two humic-like types (peak–M, and peak–C) and one protein-like type (peak–T). Peak–M has been related to marine prokaryotic heterotrophic activity (Coble et al., 1998;
Romera-Castillo et al., 2011a), while peak–C substances are mostly asso-ciated with materials of terrestrial origin (Coble, 1996;Nieto-Cid et al., 2006). However, somefield and experimental studies have shown that peak–C can also be produced by marine microorganisms (Romera-Castillo et al., 2011b;De La Fuente et al., 2014). Humic-like substances are considered to be recalcitrant but exhibit high photo-lability, in contrast to protein-like peak–T compounds that are consid-ered as a tracer for biologically labile DOM (Yamashita and Tanoue, 2003). Therefore, the protein-like vs humic-like ratio (peak-T/peak-C) has been used as a proxy of DOM lability.
CDOM and FDOM in Mediterranean coastal areas exhibit contrasting temporal patterns depending on the particular site and year (Para et al., 2010;Romera-Castillo et al., 2013). In these coastal systems, plankton dynamics are also highly variable (Cloern and Jassby, 2008;Romero et al., 2014). This high variability emerges from the complex responses of the systems to both seasonal and episodic meteorological events. However, previous sampling efforts in the area have not been intensive enough to capture the response to these episodic phenomena. Here, in order to capture the signal of both types of variability sources and their direct or indirect influence on DOM dynamics, we sampled a
coastal station located in the NW Mediterranean on a weekly basis dur-ing 14-months (SOLA Station, Banyuls sur Mer, France). The aim of our work was to determine the major environmental drivers affecting the dissolved organic matter (DOM) concentration and quality in this area with the aim of discerning recurrent seasonal dynamics from episodic phenomena. To achieve this, wefirst analyzed samples for different DOM fractions together with several environmental variables during a 14-month period. Then, we compared our results with climatological and environmental data (temperature, salinity and inorganic nutrient and chlorophyll a concentrations) collected from January 2000 to April 2014 at the same station.
2. Material and methods 2.1. Site and sample collection
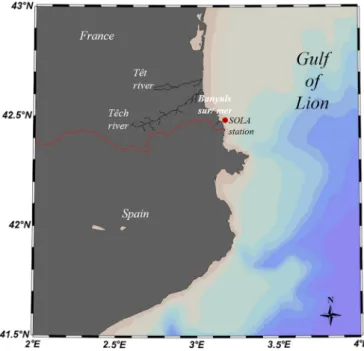
Samples were taken from a NW Mediterranean coastal station (sta-tion SOLA, 42°30′ N, 03°09′ E, 27 m depth), located in the Bay of Banyuls sur Mer. The area receives the discharge of two rivers, the Têch and Têt Rivers. The mouths of the rivers are located at approximately 14 and 27 km north (Fig. 1) and the area is influenced by winter windstorms. Sam-ples for nutrients, chlorophyll a and DOM analyses were collected di-rectly from Niskin bottles weekly at 3 m depth from February 2013 to April 2014 aboard the RV“Nereis II”. We also compiled results from the SOLA station database to examine the temporal trends of a 14-year period (2000–2014).
Temperature and salinity were simultaneously measured using a Seabird 19 Conductivity-Temperature-Depth probe. The data analyzed from the historical time series (years 2000 to 2012) were acquired
Fig. 1. Map of the study area. The red circle represents the SOLA station. The black lines represent the Têch and Têt Rivers.
from the French Coastline Observation Service ( http://somlit.epoc.u-bordeaux1.fr/fr).
Discharge data of the Têt and Têch Rivers for the period 2010–2014 were obtained from the hydro database (http://www.hydro.eaufrance.fr/). 2.2. Chemical and biological analyses
Chlorophyll a concentration was determined byfluorimetry. For each sample, 250 mL of seawater wasfiltered on a Whatman GF/F 25 mm glassfiber filter. All filters were stored at −20 °C until analysis. After extraction by 90% acetone during 24 h in the dark; the total chlo-rophyll and phaeopigment concentrations were measured using a Tuner Design 10-AUfluorimeter (Holm-Hansen et al., 1965) calibrated with standard solid RD-AU10. Samples for inorganic nutrient analyses (NO3−, PO4−3and H4SiO4) were collected in 12 mL polyethylene tubes
and stored at−20 °C until analysis in the laboratory using a colorimetric “Seal-Bran-Luebb AA3HR” auto-analyzer (Germany). Dissolved NH4+
concentrations were determined in fresh samples using a nanomolar fluorometric method according toHolmes et al. (1999)on afluorometer Jasco FP-2020. The accuracy of the measurements was ±0.02μmol L−1
for nitrate (NO3−), ±0.05μmol L−1for silicate (H4SiO4), ±0.01μmol L−1
for phosphate (PO4−3) and ± 2 nM for ammonium (NH4+).
Samples for dissolved organic carbon (DOC) analyses werefiltered through pre-combusted Whatman GF/Ffilters (nominal pore size 0.7 μm) and collected in pre-combusted (12 h at 450 °C) glass ampoules. After acidification with orthophosphoric acid (H3PO4−50μL) to pH <
2, the ampoules were heat sealed and stored in the dark until analysis. DOC was analyzed following the high temperature catalytic oxidation (HTCO) technique (Sugimura and Suzuki, 1998;Cauwet, 1999) using a Shimadzu TOC-L analyzer. The system was calibrated daily with a solu-tion of acetanilide (C8H9NO MW = 135.17).
For particulate organic carbon (POC) analyses, 1 L seawater samples werefiltered on pre-combusted (24 h, 450 °C) glass fiber filters (Whatman GF/F, 25 mm). Thefilters were dried overnight at 50 °C and stored in glass vials in a desiccator until analyzed according to the wet oxidation method described byPujo-Pay and Raimbault (1994)
using a CHN Perking Elmer 2400.
2.3. Chromophoric (CDOM) andfluorescent (FDOM) dissolved organic matter analyses
Samples for DOM absorption (CDOM) andfluorescence (FDOM) werefiltered by gravity through 47 mm pre-combusted Whatman GF/ Ffilters (nominal pore size 0.7 μm) into 250 mL pre-combusted (24 h at 450 °C) glassflasks. We chose GF/F filters instead of 0.2 μm pore sizefilters for our filtrations because GF/F filters have been and are ex-tensively used for oceanographic and biogeochemical analyses. More-over, they can be combusted at high temperatures, which minimizes contamination. Actually, as they shrink slightly after combustion they are comparable to 0.2μm filters in oligotrophic waters. A previous study (Ferrari, 2000) found no significant differences in CDOM mea-surements when it compared samplesfiltered through GF/F and 0.2 μm pore size filters in Western Mediterranean waters. The filtered sam-ples were subsequently frozen at−20 °C in the dark until analysis in the laboratory. Although freezing can alter the structure of some DOM com-pounds, recent studies have reported minimal changes in DOM due to storage (Hancke et al., 2014). However, to evaluate these effects, a test was carried out with coastal water DOM samples from the Blanes Bay Microbial Observatory, NW Mediterranean (BBMO, 41°40′0″ N, 2°48′ 0″ E). FDOM was measured (n = 8) in fresh and in thawed samples after being frozen at−20 °C for eight months. We found no significant differences between the fresh and frozen samples in any FDOM peaks (t-test, p > 0.05). CDOM absorbance was measured in 10 cm quartz cu-vettes using a Varian Cary UV-VIS spectrophotometer. Absorbance spec-tra were performed between 250 and 750 nm at a constant room temperature of 20 °C, with Milli-Q water as reference blank. The
residual backscattering (colloidal material,fine size particle fractions present in the sample) was corrected by subtracting the mean absor-bance from 600 to 750 nm (Bricaud et al., 1981). The CDOM absorption coefficient (aλ) in m−1atλ was calculated according to Eq.(1):
að Þλ ¼ Absð Þλ∗2303=l ð1Þ where Abs(λ)is the absorbance atλ wavelength, l is the optical path
length (m) and 2.303 is a factor for the conversion of the Decimal loga-rithm to the Napierian logaloga-rithm. CDOM spectral slopes were calculated over the wavelength ranges 250–500 nm and 275–295 nm using linear regressions of the natural log-transformed aCDOM(λ) according to
Nelson et al. (2004)andHelms et al. (2008).
FDOM samples were analyzed with a Perkin Elmer luminescence spectrometer LS 55 (United Kingdom) equipped with a xenon discharge lamp, equivalent to 20 kW. Slit widths were 10.0 nm for the wave-lengths of excitation and emission and the scan speed was 250 nm min−1.
Matrices (EEMs) were generated by combining 21 synchronous excitation-emissionfluorescence spectra of the sample, obtained for an excitation wavelength range of 250–450 nm and a 20 nm offset be-tween the excitation and emission wavelengths. The instrument was calibrated with a quinine sulfate dehydrate (QS) standard made up in 0.05 mol L−1of sulfuric acid (Nieto-Cid et al., 2006). Therefore, fluores-cence measurements were expressed in quinine sulfate units (QSU). Milli-Q water was used as a blank and Raman scattering was corrected by subtracting the EEM of the Milli-Q water from the EEM of the sam-ples. Inner Filter Effect (IFE) corrections were not applied to fluores-cence measurements. According to previous studies (Ohno, 2002,
Stedmon and Bro, 2008,Kothawala et al., 2013,Wang et al., 2017), the innerfilter effects on fluorescence measurements are negligible (<5%) when absorbance values are lower than 0.04 (absorption coefficient below 10 m−1) and thus IFE corrections are not necessary. In our data series, the absorbance values ranged from 0.005 to 0.02. Within this range of absorbances, the percent measurement error for non-corrected FDOM values would range from 1.12 to 1.21%. We used a com-bination of different pairs of excitation-emission (EX/EM) wavelengths previously described byCoble (1996)in order to compare our results with previous studies.
Thefluorescence quantum yield at 340 nm was determined using the ratio of the absorption coefficient at 340 nm and the corresponding fluorescence emission between 400 and 600 nm of the water sample and referred to the QS standard ratio (Green and Blough, 1994) accord-ing to Eq.(2): Φ 340ð Þ ¼F 400ð −600Þ aCDOMð340Þ∙ aCDOMð340ÞQS F 400ð −600ÞQS ∙Φ 340ð ÞQS ð2Þ where aCDOM(340) and aCDOM(340)QSare the absorption coef
fi-cients of the sample and of the QS standard, respectively at 340 nm (in m−1); F(400–600) and F(400–600)QSare the average
inte-gratedfluorescence spectra between 400 and 600 nm at a fixed excitation wavelength of 340 nm obtained for each sample and for the QS standard (Romera-Castillo et al., 2011a);Φ(340)QSis
the dimensionlessfluorescence quantum yield of the QS standard and equals 0.54 (Melhuish, 1961). The specific absorption coeffi-cient a⁎CDOM (254) was obtained by dividing the value aCDOM
(254) by the DOC concentration and was expressed in m2g C−1. 2.4. Statistical analyses
Pearson correlations were determined to explore co-occurrence patterns between DOM metrics and environmental parameters. Data were log10-transformed to accomplish the requirements of parametric tests. Data normality was tested using Kolmogorov-Smirnov tests. A correlation matrix was generated to explore the
co-occurrence patterns between physical and chemical properties at our sampling site. A multiple regression was applied to autumn-winter samples to explore the FDOM variability as a function of salin-ity and Chl a.
3. Results
3.1. Hydrological and physiochemical parameters– Long term period (2000–2014)
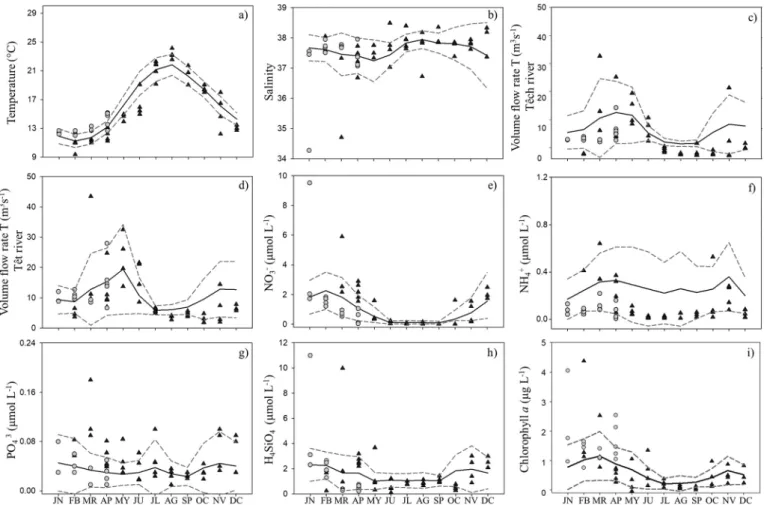
The long-term temporal dynamics of the measured variables showed a strong seasonal signal during the time series. In this section, we describe seasonal variability of averaged values over the study years (seeFigs. 2). The discharges of both the Têch and Têt Rivers showed three well-defined periods: the spring period with highflow (March to May, mean 11.5 ± 11.6 and 13.1 ± 13.7 m3s−1respectively), followed by a lowflow scenario during mid-summer and early autumn (July to September, mean 1.61 ± 1.16 and 2.8 ± 2.1 m3s−1respectively) and continuing with an interval
of moderateflow from mid-autumn to early winter (October to De-cember, mean 7.1 ± 8.6 and 8.6 ± 9.0 m3s−1, respectively).
The temperature tended to increase from mid-spring (mean of 14.98 ± 2.33 °C) to mid-summer (mean 21.6 ± 1.66 °C) with a sub-sequent gradual decrease until winter (December, mean 11.6 ± 0.99 °C). The salinity showed values between 34.27 and 38.50. The highest salinities occurred from mid-summer to mid-autumn (July to October). The interannual variability of nitrates and silicates showed a similar seasonal pattern during the time series. Their
concentrations tended to increase from mid-autumn to winter (November to February), mean of 0.75 ± 1.22 and 2.04 ± 1.40 μmol L−1for nitrates, and 1.68 ± 1.46 and 2.13 ± 2.30μmol L−1,
for silicates. Then, a decrease during summer was observed (0.11 ± 0.14μmol L−1for nitrates and 1.12 ± 0.85μmol L−1for silicates).
Phosphate concentrations were low, with maxima in winter (aver-age of 0.042 ± 0.043μmol L−1). Ammonium had two maxima, one
in spring and one in autumn, reaching means of 0.30 ± 0.29 and 0.28 ± 0.22μmol L−1, respectively). Finally, chlorophyll a (Chl a)
concentrations were higher in winter and had a mean value of 0.99 ± 0.83μg L−1.
3.2. Short term period (2012–2014) 3.2.1. Hydrological parameters
The temperature and salinity dynamics followed well-defined sea-sonal patterns (Fig. 2). Temperature values were lowest in February (9.4 and 12.7 °C for 2013 and 2014, respectively) and highest (24.0 °C) in August (Fig. 2a), while salinity ranged from 34.28 to 38.49 and showed two minima, thefirst in March 2013 and the second in January 2014. These minima (34.71 and 34.28, respectively) were exceptionally low (93% and 91% lower than the average for the last 14 years, respec-tively;Fig. 2b). On the other hand, theflow of the Têch and Têt Rivers showed high intra-seasonal variability. The maximum discharges of the two rivers in the study area occurred in early and mid-spring and corresponded to rainy periods (34.0 and 27.0 m3s−1for the Têch
River; 43.5 and 32.5 m3s−1for the Têt River,Fig. 2c, d). During the dry periods the waterflow decreased to 2 m3s−1.
Fig. 2. Time series. a) Temperature (°C), b) salinity, c) discharge from the Têch River (m3
s−1), d) discharge from the Têt River (m3
s−1), (e–h) nitrate, ammonium, phosphate and silicate (μmol L−1) and i) chlorophyll a (μg L−1). The plots indicate the average annual cycle of each variable during 2000–2014; each month displays the average value (black line) ± standard
3.2.2. Inorganic nutrients and chlorophyll a
Similarly, to the longer time series, inorganic nutrient concentra-tions were generally lower in summer than in winter and spring. Ni-trate concentrations ranged from 0.02μmol L−1to 9.5μmol L−1
(Fig. 2e), with values >5.0μmol L−1in early-mid winter (March
2013 and January 2014). Ammonium concentrations ranged be-tween 0.01μmol L−1and 0.64μmol L−1(Fig. 2f), showing
remark-ably low values in late spring and autumn 2013 (<0.1μmol L−1).
The phosphate concentration was low (<0.2μmol L−1) throughout
the entire time series (Fig. 2g). Silicate showed two maxima, one in March 2013 and one January 2014 (9.9μmol L−1and 11μmol L−1
re-spectively,Fig. 2h), coinciding with the salinity minima (Fig. 2b) and with high nitrate values (Fig. 2e). Total chlorophyll (Chl a) ranged from 0.05μg L−1to 4.39μg L−1(Fig. 2i) and showed two peaks
(Feb-ruary 2013 and January 2014) with concentrations of 4.39μg L−1and
4μg L−1, respectively. The winter Chl a peak in 2013 followed a NH 4 +
maximum, while the 2014 peak came after a salinity minimum. In contrast, during spring and summer, Chl a was rather low, reaching values of <0.6μg L−1.
3.2.3. Dissolved and particulate organic carbon
The dissolved organic carbon (DOC) concentration ranged from 60.2 μmol L−1to 116.6μmol L−1. Maximum values occurred in mid to late
summer (August–September), followed by a gradual decrease until the winter period, when DOC values remained low (60.2 to 81.9μmol L−1,Fig. 3a). Particulate organic carbon (POC) concentrations showed high variability throughout the whole period (from 3.9 to 22.4μmol L−1,Fig. 3a) with low concentrations (5.4μmol L−1) in early spring, au-tumn and winter 2013. In contrast, the highest POC values occurred in mid-autumn 2013 and mid-spring 2014 (19.2 and 22.4μmol L−1,
re-spectively). DOC dynamics were significantly correlated to those of tem-perature, nitrates and Chl a (Table 1).
3.2.4. Chromophoric DOM
CDOM absorption coefficients at 254 nm (a254) and 340 nm (a340) showed high variability during the studied period, ranging from 1.6 to 4.6 m−1and from 0.04 m−1to 1.10 m−1respectively (Fig. 3b). Both a254 and a340 coefficients had maxima (4.6 m−1and 1.1 m−1,
respec-tively) in mid-winter (11 March, 2013), concomitant with low salinity (34.71) and low temperature (12 °C). In January 2014, and also coincid-ing with a minimum of salinity (34.28), high a254 and a340 values were also observed (2.6 and 0.6 m−1, respectively). The coincidence between low salinity and high CDOM values was confirmed by significant nega-tive correlations between salinity and a254 and a340. These indexes were also correlated (positively) with inorganic nutrients (Table 1).
The specific absorption coefficient at 254 nm, a*CDOM (254), oscil-lated between 1.43 and 6.4 m−2g C−1and the highest values coincided with the salinity minima (Fig. 3b). This parameter also showed signi fi-cant correlations with salinity (Table 1).
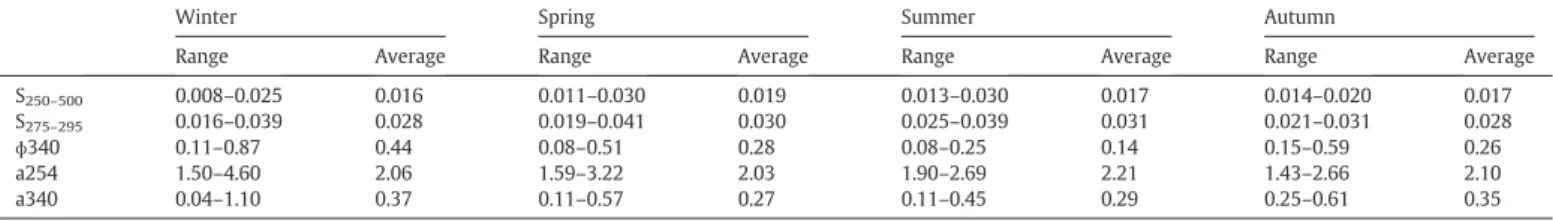
The spectral slopes S250–500and S275–295did not follow a regular
pat-tern during the time series. The valuesfluctuated from 0.008 to 0.030 (S250–500) and from 0.016 to 0.041 (S275–295) (Table 2). For the
(S275–295) slope, which is a surrogate of low molecular weight
sub-stances, the highest values were found in summer coinciding with high DOC concentrations. Significant negative correlations were found between the S275–295 values and inorganic nutrients (nitrates, Fig. 3. Times series from February 2013 to April 2014. (a) Particulate and dissolved organic
carbon (POC and DOC inμmol L−1) and (b) absorption coefficient (a254 and a340, in m−1
and specific absorption coefficient (a*CDOM(254), in m2mol C−1).
Table 1
Correlation coefficients between physical and chemical parameters from February 2013 to April 2014. Colored cells indicate significant correlations (dark = p < 0.01, and light = p < 0.05). Abbreviations: temperature (T, °C), salinity (S), nitrates (NO3−), phosphates (PO−34 ), silicates (H4SiO4), ammonium (NH4+) inμmol L−1, chlorophyll a (Chl a,μg L−1), dissolved organic
car-bon (DOC,μmol L−1), Irradiance (I, W m−2),fluorescence DOM (Peak–M, Peak–C, Peak–T, in QSU), CDOM absorption coefficients (a254 and a340, in m−1), specific absorption coefficient at
254 nm [a*CDOM(254) in m−2g C−1],fluorescence quantum yield at 340 ([ɸ (340)]) and spectral slope (S275–295).
phosphate, silicate and ammonium) and Chl a, while these slopes values were positively related to DOC and solar irradiance (Table 1).
3.2.5. Fluorescent DOM
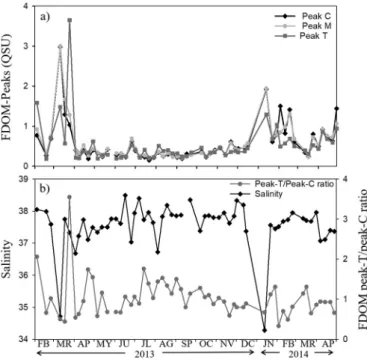
Fluorescent DOM excitation-emission matrices (EEMs) showed markedfluorescence peaks in the areas corresponding to the protein-like and humic-protein-like substances. The EEMs showed a marked temporal variability, with noticeable changes influorescence signals associated with the two most contrasting environmental events: (1) the intrusion of low salinity (34.71) waters in winter (Fig. 4a) and (2) the high light exposure and stratification occurring in summer (Fig. 4b). Coincident with the freshwater inputs, clearly defined peaks in the humic-like areas could be identified in the EEMs (Fig. 4a). For further analyses, we selected the following single excitation/emission wavelength pairs (as inCoble, 1996): 340/440 nm (peak–C), 320/410 nm (Peak-M), 280/350 nm (peak–T).
In the humic-like area, the most intense peaks appeared on 11 March 2013 with values of 2.9 and 3.0 QSU for peak–C and peak–M re-spectively (Fig. 5a). The protein-like FDOM, peak–T, ranged from 0.18 to 3.65 QSU and followed temporal dynamics similar to those of the humic-like substances (Fig. 5a). We could detect variability in the rela-tive concentration of protein-like FDOM with respect to humic-like FDOM: The highest value of the peak–T/peak–C ratio was detected in
March 2013 (Fig. 5b), while low peak–T/peak–C ratios were observed during the minimum salinity periods.
The three FDOM peaks showed significant positive correlations with nitrate and Chl a and negative correlations with DOC, temperature and salinity (Table 1). Solar irradiance was negatively correlated to humic-like FDOM peaks–C and M (Table 1). During the autumn-winter period, multiple regression analyses showed that both salinity and Chl a signif-icantly affected (p < 0.05) the dynamics of the three FDOM peaks (Table 3), although the partial coefficients and significance were always higher for salinity.
Thefluorescence quantum yield at 340 nm (Φ340) ranged from 0.08 to 0.87 (Table 2). The highest values ofΦ340 (>0.50) were ob-served in winter and spring. This parameter was positively related to Chl a (Table 1) and negatively related to irradiance (r =−0.57, p < 0.01, n = 52,Fig. 6).
4. Discussion
4.1. Physical and chemical parameters
Our results show a well-marked seasonal variability of temperature, salinity and nutrients in our study area, as previously described by other authors (Marty et al., 2002;Grémare et al., 2003). Two sharp decreases
Table 2
Seasonal average of the spectral slopes from 250 to 500 (S250–500), from 275 to 295 (S275–295), absorption coefficient (a254 and a340, in m−1) andfluorescence quantum yield at
340 ([ɸ (340)]) during the time series.
Winter Spring Summer Autumn
Range Average Range Average Range Average Range Average
S250–500 0.008–0.025 0.016 0.011–0.030 0.019 0.013–0.030 0.017 0.014–0.020 0.017
S275–295 0.016–0.039 0.028 0.019–0.041 0.030 0.025–0.039 0.031 0.021–0.031 0.028
ɸ340 0.11–0.87 0.44 0.08–0.51 0.28 0.08–0.25 0.14 0.15–0.59 0.26
a254 1.50–4.60 2.06 1.59–3.22 2.03 1.90–2.69 2.21 1.43–2.66 2.10
a340 0.04–1.10 0.37 0.11–0.57 0.27 0.11–0.45 0.29 0.25–0.61 0.35
Fig. 4. Example EEMs showing the two most contrasting environmental events: a) intrusion of water with low salinity in winter and b) water photobleached in summer. Inside the EEMs, the capital letters indicate the different peaks: humic-like substances (Peak–A), terrestrial humic-like substances (Peak–C), marine humic-like substances (Peak–M) and protein-like substances (Peak–T).
in salinity were observed in winter (11 March, 2013 and 13 January, 2014). Coinciding with the salinity minimum of March 2013, we ob-served high water discharges from the Têt and Têch Rivers (≈40 m3s−1each). The salinity minimum in January 2014 could be associated
with other environmental factors, such as rain or wind, since previous studies have noted their influence (e.g. NE tramontane winds) on the coastal ocean circulation (Estournel et al., 2005;Aparicio et al., 2017). Unfortunately, we do not have enough data to assess the relative contri-bution of hydrological factors other than river discharge; however, high nitrate and silicate concentrations were found during the salinity min-ima, which was confirmed by significant correlations (r = −0.34 and −0.42; p < 0.05, n = 57). This could indicate that river flow was actually influencing the nutrient levels, and, for the case of January 2014, proba-bly inducing a peak in chlorophyll a (Fig. 2). The other Chl a maximum was observed in February 2013. This peak did not follow any salinity minima but coincided with a relative maximum of NH4+. This
ammo-nium peak could be originated by sediment resuspension caused by the strong wind observed during that period (mean 19 m s−1, data not shown). High waves and swell have been reported as a cause for sediment resuspension at the SOLA station (Guizien et al., 2007). In fact, coinciding with this Chl a peak, we found a relative minimum of temperature (Fig. 2) that could be a sign of water intrusion from deeper layers.
We compared the results obtained for the 2012–2014 period with climatological and environmental data collected from 2000 to 2014 at the same station. We found that the values for the different variables during the 2012–2014 period, in general, varied within the range of the values observed in the past 14 years. There were, however, two sa-linity outliers. The annual sasa-linity minima found in our study were also the minima for the last 14 years. Considering that these minima are as-sociated with extremely high nutrient concentrations, it would be of in-terest to check whether these phenomena are sporadic or, conversely, associated with a shift in meteorological trends. Notably, the ammonia concentration values were, in general, below the mean of the past 14 years, while the phosphate values tended to be above the average. This change in the tendency in nutrient dynamics may be due to local processes because it did not occur in other coastal areas of the NW Med-iterranean close to the SOLA study site (e.g. the Blanes Bay Microbial Ob-servatory,Nunes et al., 2018).
4.2. Temporal mismatch between dissolved organic matter and inorganic nutrients
In our study site and period, we observed an accumulation of dissolved organic carbon (DOC) towards the end of summer, also observed in previous studies in the NW Mediterranean Sea ( Copin-Montégut and Avril, 1993; Vila-Reixach et al., 2012; Romera-Castillo et al., 2013) and in other oligotrophic ocean areas (Carlson and Hansell, 2015). This accumulation in summer has been attrib-uted to the“malfunctioning of the microbial loop” (Thingstad et al., 1997); that is, the inability of heterotrophic prokaryotes to uptake DOM due to the limitation in inorganic nutrients. Although the Med-iterranean Sea is mainly limited by phosphorus, and subsequent studies have also proven this limitation in the NW area (Sala et al., 2002;Salter et al., 2014;Pinhassi et al., 2006), the concentrations of both dissolved nitrogen and phosphorus are extremely low in summer (close to detection limits 0.05 and 0.02μmol L−1,
respec-tively), and osmotrophs are probably limited by both nutrients as
Sala et al. (2002)also pointed out. Nevertheless, in other NW Medi-terranean zones, relatively high heterotrophic prokaryotic produc-tion, measured as leucine incorporaproduc-tion, has been found in summer, coinciding with the lowest inorganic nutrient concentra-tions (Alonso-Sáez et al., 2008;Laghdass et al., 2010). Later, Vila-Reixach et al. (2012)proposed that accumulated DOC comes from heterotrophic prokaryotic origin. To interpret this mismatch be-tween DOC accumulation and heterotrophic prokaryotic activity, more detailed studies need to be carried out. Top-down control could also contribute to this mismatch, as grazing is also a significant DOM source (Strom et al., 1997). In fact, several studies have re-ported increases in grazing activity with temperature (Marrasé et al., 1992;Vaqué et al., 1994;Unrein et al., 2007).
Fig. 5. Times series from February 2013 to April 2014. a) Fluorescent DOM (Peak–C and M humic-like FDOM, Peak–T protein-like FDOM). Fluorescence is expressed in quinine sulfate units (QSU) and b) Ratio between Peak–T and Peak–C, and salinity.
Table 3
Results of multiple regression analysis between FDOM peaks C, M, and T (log10R.U.,
de-pendent variables) and chlorophyll a (Chl a) and salinity (log10, independent variables)
during the autumn-winter period in the SOLA station. n = 26, b = non-standardized par-tial coefficient; β = standardized parpar-tial coefficient; p: level of significance.
Dependent variable Independent variables
Salinity Chl a
b β p b β p R2
Peak-C −13.9 −0.529 0.002 0.273 0.345 0.034 0.537
Peak-M −13.0 −0.492 0.004 0.300 0.377 0.023 0.524
Peak-T −10.0 −0.470 0.006 0.252 0.391 0.020 0.513
Fig. 6. Relationship between irradiance (W m−2) andfluorescence quantum yield at 340
nm, [Φ (340)]. The lineal regression (black line) was calculated including all the data from the time series; Y = 0.67 (−0.00048)-4ּ X; R2
4.3. Seasonal dynamics of CDOM fractions
At SOLA station we could observe that the sharpest changes in the quality of the FDOM coincided with high river discharges. In fact, the significant negative correlations between FDOM peaks and salinity sug-gest that the incoming fresh waters have a high FDOM content (Table 1) in line with previous studies showing that CDOM and FDOM concentra-tions in coastal areas are influenced by terrestrial-derived inputs (Ferrari, 2000;Blough and Del Vecchio, 2002). However, based on our results we hypothesize that, during most of the year, the variability in humic-like FDOM in the coastal Mediterranean Sea depends on a com-bination of biotic and abiotic factors, and that the autochthonous DOM inputs (e.g. exudation from marine phytoplankton or heterotrophic prokaryotes) (Alonso-Sáez et al., 2009;Romera-Castillo et al., 2011a;
Kramer and Herndl, 2004;Jørgensen et al., 2014) are the main source and photobleaching after sunlight exposure is the main sink (see below).
The significant correlations between all FDOM peaks and chlorophyll could be indicative of a phytoplanktonic source. This contrasts with the lack of correlation between Chl a and DOC and with the negative corre-lation between DOC and the humic-like FDOM peaks (Table 1). This re-flects that the autochthonous processes controlling these two pools of organic matter are uncoupled and are affecting their dynamics in oppo-site directions (Chen and Bada, 1992;Coble, 2007;Romera-Castillo et al., 2013). On the one hand, phytoplankton have been shown to pro-duce humic-like and protein-like FDOM (Romera-Castillo et al., 2010), which could be manifested in our study systems in winter and autumn, when other sources and the main sinks (i.e. photobleaching, see below) are minor. In fact, multiple regression analysis performed with winter and autumn FDOM data for the humic-like peaks (C and M) and also for the protein-like peak (T) revealed significant relationships with both salinity and Chl a (seeTable 3). This corroborates that, although land inputs highly influence the FDOM dynamics, in situ biological ac-tivity may also contribute to this variability. On the other hand, the in-crease in FDOM peaks associated with inin-creases in phytoplankton biomass could be also indirect and mediated by bacterial reprocessing (Coble et al., 1998;Romera-Castillo et al., 2011b).
Low concentrations of humic-like FDOM found during the strati fica-tion period (April to October) coincided with high sunlight exposure (on average: day length 14 h d−1, irradiance 903 W m−2). Thus, photobleaching could be the major FDOM sink during this period. Sim-ilar trends have been observed in other coastal areas (Para et al., 2010;
Romera-Castillo et al., 2013), where humic-like compounds were also low in summer. This pattern was paralleled by the highest values of S275–295,(Table 2) found in summer, when DOC concentrations were
also elevated. High S275–295 values indicate low molecular weight
(LMW) material, possibly photobleaching products (Helms et al., 2008), and, indeed, we observed negative correlations between Irradi-ance and S275–295(Table 1). According to the Size-Reactivity Continuum
hypothesis (Benner and Amon, 2015) most of the refractory DOC re-sides in LMW molecules, and thus increased photobleaching in summer would increase the refractory, i.e. resistant to biodegradation, DOC frac-tion (Obernosterer et al., 1999), favoring the observed accumulation of DOC in summer. Finally, decreases influorescence quantum yield at 340 nm, [Φ (340)], are also related to photobleaching ( Romera-Castillo et al., 2011b, 2013). We found a significant negative relationship between [Φ (340)] and Irradiance (Fig. 6), which corroborates with photobleaching being a main driver of humic-like FDOM decreases in summer.
5. Conclusions
The seasonal patterns of the environmental variables studied could be discerned clearly. The signal of episodic events, such as fresh water intrusions, on DOM dynamics could be captured thanks to the high sam-pling frequency. During the study period, we found a temporal
mismatch between autotrophic biomass (chlorophyll a) and dissolved organic carbon, although correlations between chlorophyll a and FDOM peaks suggest an autochthonous DOM source that drives their dynamics during most of the year and, in particular, in winter-autumn seasons. In summer, when the water column was highly stratified, we observed the highest DOC concentrations concomitant with the lowest chlorophyll a values. Yet, the high DOC concentration in summer coin-cided with lowfluorescence intensities of the humic-like DOM fractions. We attributed this temporal decoupling to photobleaching processes, which are also indicated by lowerfluorescence quantum yields. We pro-pose that photobleaching is one of the main mechanisms rendering DOC recalcitrant, so that it accumulates in the water column during summer. We postulate that a combination of episodic terrestrial inputs, photobleaching in summer, and microbial activity, could subsequently explain the different DOC dynamics and its optically active fractions. CRediT authorship contribution statement
Elvia D. Sánchez-Pérez: Writing - original draft, Formal analysis, Validation. Mireille Pujo-Pay: Methodology, Investigation. Eva Ortega-Retuerta: Writing - review & editing, Visualization. Pascal Conan: Conceptualization, Supervision, Project administration, Funding acquisition. Francesc Peters: Writing - review & editing. Cèlia Marrasé: Conceptualization, Writing - review & editing, Supervision.
Declaration of competing interest
All authors of this manuscript declare that there is no conflict of interest.
Acknowledgements
We are grateful to M. Nieto-Cid for providing the macro script to per-form the analysis of thefluorescence dissolved organic matter. We thank E. Romero, X.A. Álvarez-Salgado and the anonymous reviewers for helpful comments on the manuscript. We also thank L. Oriol and J. Caparros for their help in the analysis of nutrients and dissolved organic carbon. We thank the Service d'Observation en Milieu Littoral (INSU-CNRS, France) for providing data from their monitoring station in Banyuls-sur-mer. This study was supported by the MERMeX/MISTRALS project and is a contribution to international SOLAS program and the projects ANIMA (CTM2015-65720-R) and DOREMI (CTM2012-34294) from the Spanish Ministerio de Economia y Competitividad. E.D. Sánchez-Pérez would like to thank the Consejo Nacional de Ciencia y Tecnologia (CONACyT) for their financial support through a PhD fellowship.
References
Alonso-Sáez, L., Vázquez-Domínguez, E., Cardelús, C., Pinhassi, J., Sala, M.M., Lekunberri, I., Gasol, J.M., 2008.Factors controlling the year-round variability in carbonflux through bacteria in a coastal marine system. Ecosys 11, 397–409.
Alonso-Sáez, L., Unanue, M., Latatu, A., Azua, I., Ayo, B., Artolozaga, I., Iriberri, J., 2009.
Changes in marine prokaryotic community induced by varying types pf dissoved or-ganic matter and subsequent grazing pressure. Plankton Res 31, 1373–1383.
Aparicio, F.L., Nieto-Cid, M., Calvo, E., Pelejero, C., Lopez-Sanz, A., Pascual, J., Salat, J., Sánchez-Pérez, E.D., Gasol, J.M., Marrasé, C., 2017.Wind- induced changes in the dy-namics offluorescent organic matter in the coastal NW Mediterranean. Sci. Total En-viron. 609, 1001–1012.
Benner, R., Amon, R.M., 2015.The size-reactivity continuum of major bioelements in the ocean. Annu. Rev. Mar. Sci. 7, 185–205.
Blough, N.V., Del Vecchio, R., 2002.Chromophoric DOM in the coastal environment. In: Hansell, D.A., Carlson, C.A. (Eds.), Biogeochemistry of Marine Dissolved Organic Mat-ter. Academic Press, San Diego, pp. 509–540.
Böhm, E., Riminucci, F., Bortoluzzi, G., Colella, S., Acri, F., Santoleri, R., Ravaioli, M., 2016.
Operational use of continuous surfacefluorescence measurements offshore Rimini to validate satellite-derived chlorophyll observations. Oper. Oceanogr. 9, 167–175.
Bricaud, A., Morel, A., Prieur, L., 1981.Absorption by dissolved organic-matter of the sea (yellow substance) in the UV and visible domains. Limnol. Oceanogr. 26, 43–53.
Carlson, C.A., Hansell, D.A., 2015. DOM sources, sinks, reactivity and budgets. In: Hansell, D.A., Carlson, C.A. (Eds.), Biogeochemistry of Marine Dissolved Organic Matter, 2nd ed Academic Press, pp. 65–126. https://doi.org/10.1016/B978-0-12-405940-5.00003-0.
Cauwet, G., 1999.HTCO method for dissolved organic carbon analysis in seawater: influ-ence of catalyst on blank estimation. Mar. Chem. 47, 55–64.
Chen, R.F., Bada, J.L., 1992. Thefluorescence of dissolved organic matter in seawater. Mar. Chem. 37, 191–221.https://doi.org/10.1016/0304-4203(92)90078-O.
Cloern, J.E., Jassby, A., 2008.Complex seasonal patterns of primary producers at the land-sea interface. Ecol. Lett. 11, 1249–1303.
Coble, P.G., 1996. Characterization of marine and terrestrial DOM in seawater using excitation-emission matrix spectroscopy. Mar. Chem. 51, 325–346.https://doi.org/ 10.1016/0304-4203(95)00062-3.
Coble, P.G., 2007. Marine optical biogeochemistry: the chemistry of ocean color. Chem. Rev. 107, 402–418.https://doi.org/10.1021/cr0503501.
Coble, P.G., Del Castillo, C.E., Avril, B., 1998. Distribution and optical properties of CDOM in the Arabian Sea during the 1995 Southwest Monsoon. Deep-Sea. Res. PT II. 45, 2195–2223.https://doi.org/10.1016/S0967-0645(98)00068-X.
Copin-Montégut, G., Avril, B., 1993.Vertical distribution and temporal variation of dis-solved organic carbon in the North-Western Mediterranean Sea. Deep-Sea. Res. PT I. 40 (10), 1963–1972.
De La Fuente, P., Marrasé, C., Canepa, A., Álvarez-Salgado, X.A., Gasser, M., Fajar, N.M., Romera-Castillo, C., Pelegrí, J.L., 2014. Does a general relationship exist between fluo-rescent dissolved organic matter and microbial respiration? The case of the dark equatorial Atlantic Ocean. Deep-Sea Res. PT I. 89, 44–55.https://doi.org/10.1016/j. dsr.2014.03.007.
Estournel, C., Durrieu de Madron, X., Marsaleix, P., Auclais, P., Julliand, C., Vehil, R., 2005.
Observation and modeling of the winter coastal oceanic circulation in the Gulf of Lion under wind conditions influenced by the continental orography (FETCH exper-iment). J. Geophys. Res. 108, 8059.
Ferrari, G., 2000.The relationship between chromophoric dissolved organic matter and dissolved organic carbon in the European Atlantic coastal area and in the West Med-iterranean Sea (Gulf of Lions). Mar. Chem. 70, 339–357.
Green, S.A., Blough, N.V., 1994.Natural waters optical absorption andfluorescence of chromophoric properties dissolved organic matter in natural waters. Limnol. Oceanogr. 39 (8), 1903–1916.
Grémare, A., Amouroux, J.M., Cauwet, G., Charles, F., Courties, C., De Bovée, F., Dinet, A., Devenon, J.L., Durrieu De Madron, X., Ferre, B., Fraunie, P., Joux, F., Lantoine, F., Lebaron, P., Naudin, J.J., Albert, Palanques, Pujo-Pay, M., Zudaire, L., 2003.The effects of a strong winter storm on physical and biological variables at a shelf site in the Mediterranean. Oceanology Acta 26 (4), 407–419.
Guizien, K., Charles, F., Lantoine, F., Naudin, J.J., 2007.Nearshore dynamics of nutrients and chlorophyll during Mediterranean-typeflash floods. Aquat. Living Resour. 20 (1), 3–14.
Hancke, K., Hovland, E.K., Volent, Z., Pettersen, R., Johnsen, G., Moline, M., Sakshaug, E., 2014.Optical properties of CDOM across the polar front in the Barents Sea: origin, distribution and significance. J. Mar. Syst. 130, 219–227.
Hedges, J.I., 2002.Why dissolved organics matter. In: Hansell, D.A., Carlson, C.A. (Eds.), Biogeochemistry of Marine Dissolved Organic Matter. Academic Press, Oxford.
Helms, J.R., Stubbins, A., Ritchie, J.D., Minor, E.C., David, J., Mopper, K., Kieber, D.J., 2008.
Absorption spectral slopes and slope ratio as indicators of molecular source, slopes and slope ratios absorption spectral of chromophoric and photobleaching dissolved matter organic. Limnol. Oceanogr. 53 (3), 955–969.
Holmes, M.R., Aminot, A., Kérouel, R., Hooker, B.A., Peterson, B.J., 1999.A simple and pre-cise method for measuring ammonium in marine and freshwater ecosystems. Journal Fish Aquat. Sci. 56, 1801–1808.
Holm-Hansen, O., Lorenzen, C.J., Holmes, R.W., Strickland, J.D.H., 1965.Fluorimetric deter-mination of chlorophyll. Mar. Sci. 30, 3–15.
Jørgensen, L., Stedmon, C.A., Granskog, M.A., Middelboe, M., 2014. Tracing the long-term microbial production of recalcitrantfluorescent dissolved organic matter in seawater. Geophys. Res. Lett. 41, 2481–2488.https://doi.org/10.1002/2014GL059428. Kothawala, D.N., Murphy, K.R., Stedmon, C.A., Weyhenmeyer, G.A., Tranvik, L.J., 2013.
Innerfilter correction of dissolved organic matter fluorescence. Limnol. Oceanogr. Meth. 11, 616–630.
Kramer, G.D., Herndl, G.J., 2004.Photo and bioreactivity of chromophoric dissolved or-ganic matter produced by marine bacterioplankton. Aquat. Microb. Ecol. 36, 239–246.
Kuwahara, V.S., Ogawa, H., Toda, T., Kilkuchi, T., Taguchi, S., 2000.Variability of bio-optical factors influencing the seasonal attenuation of ultraviolet radiation in temperate coastal waters of Japan. Photochem. Photobiol. 72, 193–199.
Laghdass, M., West, N.J., Batailler, N., Caoarros, J., Catala, P., Lantoine, F., Oriol, L., Lebaron, P., Obesnosterer, I., 2010.Impact of lower salinity waters on bacterial heterotrophic production and community structure in the offshore NW Mediterranean Sea. Envi-ron. Microbiol. Rep. 2 (6), 761–769.
Marrasé, C., Lim, E.L., Caron, D.A., 1992.Seasonal and daily changes in bacterivory in a coastal plankton community. Mar. Ecol. Progr. Ser. 82, 281–289.
Marty, J.C., Chiavérine, J., Pizay, M.D., Bernard, A., 2002.Seasonal and interannual dynam-ics of nutrients and phytoplankton pigments in the western Mediterranean Sea at the DYFAMED time-series station (1991–1999). Deep-Sea Res. PT II. 49, 1965–1985.
Melhuish, W.H., 1961.Quantum efficiencies of fluorescence of organic substances: effect of solvent and concentration of thefluorescent solute. J. Phys. Chem. 65, 229–235.
Nelson, N.B., Craig, A.C., Steinberg, D.K., 2004.Production of chromophoric dissolved or-ganic matter by Sargasso Sea microbes. Mar. Chem. 89, 273–287.
Nieto-Cid, M., Álvarez-Salgado, X.A., Pérez, F.F., 2006.Microbial and photochemical reac-tivity offluorescent dissolved organic matter in a coastal upwelling system. Limnol. Oceanogr. 51, 1391–1400.
Nunes, S., Latasa, M., Gasol, J.M., Estrada, M., 2018.Seasonal and interannual variability of phytoplankton community structure in a Mediterranean coastal site. Mar. Ecol. Progr. Ser. 592, 57–75.
Obernosterer, I., Reitner, B., Herndl, G.J., 1999.Contrasting effects of solar radiation on dis-solved organic matter and its bioavailability to marine bacterioplankton. Limnol. Oceanogr. 44, 1645–1654.
Ohno, T., 2002.Fluorescence inner-filtering correction for determining the humification index of dissolved organic matter. Environ. Sci. Technol. 36, 742–746.
Para, J., Coble, P.G., Charrière, B., Tedetti, M., Fontana, C., Sempéré, R., 2010.Fluorescence and absorption properties of chromophoric dissolved organic matter (CDOM) in coastal surface waters of the northwestern Mediterranean Sea influence of the Rhône River. Biogeosci. Discuss. 7, 4083–4103.
Pinhassi, J., Gomez-Consarnau, L., Alonso-Saez, L., Sala, M.M., Vidal, M., Pedros-Alio, C., Gasol, J.M., 2006.Seasonal changes in bacterioplankton nutrient limitation and their effects on bacterial community composition in the NW Mediterranean Sea. Aquatic Microbiol. Ecol. 44, 241–252.
Pujo-Pay, M., Raimbault, P., 1994.Improvement of the wet-oxidation procedure for simul-taneous determination of particulate organic nitrogen and phosphorus collected on filters. Marine Ecol. Progr. Ser. 105, 203–207.
Romera-Castillo, C., Sarmento, H., Álvarez-Salgado, X.A., Gasol, J.P., Marrasé, C., 2010. Pro-duction of chromophoric dissolved organic matter by marine phytoplankton. Limnol. Oceanogr. 55 (1), 446–454.https://doi.org/10.4319/lo.2010.55.1.0446.
Romera-Castillo, C., Nieto-Cid, M., Castro, C.C., Marrasé, C., Largier, J., 2011a. Fluorescence: absorption coefficient ratio — tracing photochemical and microbial degradation pro-cesses affecting coloured dissolved organic matter in a coastal system. Mar. Chem. 125, 26–38.https://doi.org/10.1128/AEM.00200-11.
Romera-Castillo, C., Sarmento, H., Álvarez-Salgado, X.A., Gasol, J.M., Marrasé, C., 2011b.
Net production/consumption offluorescent coloured dissolved organic matter by natural bacterial assemblages growing on marine phytoplankton exudates. Appl. En-viron. Microbiol. 77, 7490–7498.
Romera-Castillo, C., Álvarez-Salgado, X.A., Galí, M., Gasol, J.M., Marassé, C., 2013. Com-bined effect of light exposure and microbial activity on distinct dissolved organic matter pools. A seasonalfield study in an oligotrophic coastal system (Blanes Bay, NW Mediterranean). Mar. Chem. 148, 44–51.
Romero, E., Peters, F., Arin, L., Guillén, J., 2014.Decreased seasonality and high variability of coastal plankton dynamics in an urban location of the NW Mediterranean. J. Sea Res. 88, 130–143.
Sala, M.M., Peters, F., Gasol, J.M., Pedrós-Alió, C., Marrasé, C., Vaqué, D., 2002.Seasonal and spatial variations in the nutrient limitation of bacterioplankton growth in the north-western Mediterranean. Aquat. Microbiol. Ecol. 27 (1), 47–56.
Salter, I., Galand, P.E., Catala, P., Courties, C., Fagervold, S.K., Lebaron, P., Obernosterer, I., Oliver, M.J., Suzuki, M.T., Tricoire, C., 2014.Dynamics of inorganic and organic phos-phorous substrate utilization by extant microbial populations in the North-West Mediterranean Sea. 2014 Ocean Sciences Meeting 2014, Honolulu, Hawaii, USA, 23 February 2014–28 February 2014.
Stedmon, C.A., Bro, R., 2008.Characterizing dissolved organic matterfluorescence with parallel factor analysis: a tutorial. Limnol. Oceanograph-Meth. 6, 572–579.
Strom, S.L., Benner, R., Ziegler, S., Dagg, M.J., 1997.Planktonic grazers are a potentially im-portant source of marine dissolved organic carbon. Limnol. Oceanogr. 42, 1364–1374.
Sugimura, Y., Suzuki, Y., 1998.A high temperature catalytic oxydation method for the de-termination of non-volatile dissolved organic carbon in sea water by direct injection of a liquid sample. Mar. Chem. 24, 105–131.
Thingstad, T.F., Hagstrom, A., Rassoulzadegan, F., 1997.Accumulation of degradable DOC in surface waters: is it cause by a malfunctioning microbial loop? Limnol. Oceanogr. 42 (2), 398–404.
Unrein, F., Massana, R., Alonso-Sáez, L., Gasol, J.M., 2007.Significant year-round effect of small mixotrophicflagellates on bacterioplankton in an oligotrophic coastal system. Limnol. Oceanogr. 52 (1), 456–469.
Vaqué, D., Gasol, J.M., Marrasé, C., 1994.Grazing rates on bacteria: the significance of methodology and ecological factors. Mar. Ecol. Progr. Ser. 109, 263–274.
Vila-Reixach, G., Gasol, J.M., Cardelús, C., Vidal, M., 2012.Seasonal dynamics and net pro-duction of dissolved organic carbon in an oligotrophic coastal environment. Mar. Ecol. Prog. Ser. 456, 7–19.
Wagner, S., Schubotz, F., Kaiser, K., Hallmann, C., Waska, H., Rossel, P.E., Hansman, R., Elvert, M., Middelburg, J.J., Engel, A., Blattmann, T.M., Catalá, T.S., Lennartz, S.T., Gomez-Saez, G.V., Pantoja-Gutiérrez, S., Bao, R., Galy, V., 2020. Soothsaying DOM: a current perspective on the future of oceanic dissolved organic carbon. Front. Mar. Sc.https://doi.org/10.3389/fmars.2020.00341.
Wang, T., Zeng, L.H., Li, D.L., 2017.A review on the methods for correcting the fluores-cence inner-filter effect of fluoresfluores-cence spectrum. Appl. Spectrosc. Rev. 52, 883–908.
Weishaar, J.L., Aiken, G.R., Bergamaschi, B.A., Fram, M.S., Fujii, R., Mopper, K., 2013. Evalu-ation of specific ultraviolet absorbance as an indicator of the chemical composition and reactivity of dissolved organic carbon. Environ. Sci. Technol 37, 4702–4708.
Yamashita, Y., Tanoue, E., 2003. Chemical characterization of protein-likefluorophores in DOM in relation to aromatic amino acids. Mar. Chem. 82, 255–271.https://doi.org/ 10.1016/S0304-4203(03)00073-2.