The precuneus may encode irrationality in human gambling
P. Sacr´e, M. S. D. Kerr, S. Subramanian, K. Kahn,
J. Gonzalez-Martinez, M. A. Johnson, S. V. Sarma, and J. T. Gale
Abstract— Humans often make irrational decisions, especially psychiatric patients who have dysfunctional cognitive and emotional circuitry. Understanding the neural basis of decision-making is therefore essential towards patient management, yet current studies suffer from several limitations. Functional magnetic resonance imaging (fMRI) studies in humans have dominated decision-making neuroscience, but have poor tem-poral resolution and the blood oxygenation level-dependent signal is only a proxy for neural activity. On the other hand, lesion studies in humans used to infer functionality in decision-making lack characterization of neural activity altogether. Using a combination of local field potential recordings in human subjects performing a financial decision-making task, spectral analyses, and non-parametric cluster statistics, we analyzed the activity in the precuneus. In nine subjects, the neural activity modulated significantly between rational and irrational trials in the precuneus (p < 0.001). In particular, high-frequency activity (70–100 Hz) increased when irrational decisions were made. Although preliminary, these results suggest suppression of gamma rhythms via electrical stimulation in the precuneus as a therapeutic intervention for pathological decision-making.
I. INTRODUCTION
Decision-making links cognition to behavior and is a key driver of human personality, fundamental for survival, and essential for our ability to learn and adapt. It has been well-established that humans often make irrational decisions [1]. Thus, psychiatric patients who have dysfunctional cognitive circuitry, frequently have alterations in decision-making that are poorly understood.
Understanding the neural basis of decision-making is therefore essential toward patient management. However, access to the human brain has been limited to a few case studies wherein subjects have lesions in the key decision-making structures such as the orbital frontal cortex [2]–[4], or wherein functional magnetic resonance imaging (fMRI) is used to measure neural activity in several healthy subjects during decision-making [5]. Both of these approaches have limitations. Lesions don’t provide actual neural data to ascer-tain a specific brain regions’s role during behavior. Rather, the region’s function is inferred by absence of behaviors from lesioned subjects when compared to healthy subjects. On the other hand, fMRI provides a correlate of neural
P. Sacr´e and S. V. Sarma are with the Institute for Computational Medicine and the Department of Biomedical Engineering, The Johns Hop-kins University, Baltimore, MD ([email protected], [email protected]). M. S. D. Kerr is with the Department of Engineering, University of Cambridge, UK. S. Subramanian is with the Department of Clinical Neu-rosciences, University of Cambridge, UK. K. Kahn is with Insight Data Science, Palo Alto, CA. J. Gonzalez-Martinez, M. A. Johnson and J. T. Gale are with the Institute for Computational Medicine and the Department of Neurosciences, Cleveland Clinic, Cleveland, OH ([email protected]).
activity (metabolic activity) but suffers from poor temporal resolution. fMRI resolution is on the order of multiple seconds, while decisions are often made on the order of tenths of a second.
Here, we took advantage of a technique called stereo-electroencephalography (SEEG) that allowed us to record high temporal resolution electrophysiological data (electrical activity at the millisecond scale) directly from deep and peripheral brain regions in human subjects while they per-formed a gambling-based decision task. These subjects are implanted with electrodes for clinical purposes, and each contact in the brain generates a local field potential signal.
For our gambling task, nine subjects played a game of high card where they won virtual money if their card was higher than the computer’s card. On each trial, subjects had to decide to bet “high” ($20) or “low” ($5) on their card being higher than the hidden computer’s card. Eighty percent of the trials lead to clear rational decisions where the expected reward for one choice is higher than another. On twenty percent of the trials, however, there is no clear rational decision since the expected reward is equal for both choices. Here, we focussed on scenarios where subjects made choices that would minimize their expected reward even in scenarios where the risk of losing was low. We denote these decisions as “irrational”. The goal of the study is to assess the role of different brain regions in driving these irrational decisions.
To identify neural correlates that drive irrational behav-ior, we computed spectrograms for each brain region (i.e., electrode channel) and each patient across all trials when irrational decisions were made and compared them to spec-trograms when rational decisions were made. Specifically, we examined spectral content before, during, and after the player’s card was shown and implemented a non-parametric cluster statistic to test whether the spectral activity differed between rational and irrational decisions in the given brain region. The non-parametric cluster test generates a cluster defined by a set of adjacent time-frequency windows that gives rise to the smallest p-value. If this p-value is smaller than 0.05, then the brain region (defined by location of the channel) was designated as encoding information about (ir)rationality.
We found that upon examining several brain regions in cognitive, limbic and hippocampal networks, the precuneus encoded information that separated rational decisions from irrational decisions. Specifically, when high-frequency ac-tivity (HFA), defined as 70–100 Hz, was prevalent in this region, then the player was more likely to make an irrational
TABLE I
THIS TABLE PROVIDES CLINICALLY RELEVANT INFORMATION ON EACH SUBJECT:THE GENDER,THE AGE IN YEARS,AND THE DURATION OF
EPILEPSY(“DUR.”)IN YEARS. THIS TABLE ALSO PROVIDES THE NUMBER OF RATIONAL AND IRRATIONAL TRIALS.
ID Gender Age [yr.] Dur. [yr.] Rat. Irr. 1 male 26 3 142 1 2 female 41 38 122 1 3 female 55 52 41 12 4 female 31 13 98 12 5 female 60 8 138 1 6 female 36 36 120 12 7 female 23 5 87 22 8 female 32 13 120 1 9 male 28 11 144 4
decision after he/she sees his card. The precuneus has been implicated in risk-related decision making [6], but no study has had access to electrical activity from this region at a millisecond time-scale. Hence, these findings are the first to show evidence of temporal dynamics of rhythms at a fine resolution when decisions are made. Possible therapies may include electrical stimulation to suppress such HFA to avoid irrationality.
II. METHODS
A. Subjects
At the Cleveland Clinic, patients with medically in-tractable epilepsy routinely undergo SEEG recordings in order to localize the seizure focus. In this study, aside from the behavioral experiments, no alterations were made to the patient’s clinical care, including the placement of the electrodes [7]. Subjects enrolled voluntarily and gave informed consent under criterion approved by the Cleveland Clinic Institutional Review Board. A total of nine subjects volunteered to perform the task. Details on these recordings and eventual annotated seizure focus of these nine patients are noted in Table I.
Subjects were implanted with 8 to 13 depth electrodes. Im-plantation was performed using robot-assisted surgery along with co-registered functional MRIs and angiograms to ensure safe implantation [8]. Once inserted, SEEG electrophysio-logical data were acquired using a Nihon Kohden 1200 EEG diagnostic and monitoring system (Nihon Kohden America, USA) at a sampling rate of 1 kHz or 2 kHz. Behavioral event data were simultaneously acquired through the MonkeyLogic MATLAB® toolbox [9].
B. Stereoelectroencephalography
The innovative approach using SEEG methodology relies on its capability in accessing large-scale networks, providing precise human brain data, from cortical to subcortical areas, in a three-dimensional fashion. In routine placement of depth electrodes, burr-holes that are each 15 mm in diameter are required for safe visualization of cortical vessels, and there-fore only a small number of electrodes are placed. SEEG
A B
Fig. 1. Imaging fusion and placement of multiple electrodes using the SEEG method. Fig. A is a photograph showing 14 electrodes at the skin surface. Fig. B is a fluoroscopy image of an SEEG-implanted subject (coronal view with eye forward). Note the precise parallel placement, with tips terminating at the midline or dural surface.
placement, however, uses several small drill holes (1.8 mm in diameter), allowing many electrodes to be inserted.
Since direct visualization of the cortical surface is not possible with small drills (Fig. 1A–B), the SEEG technique may require detailed pre-procedural vascular mapping using pre-operative imaging with magnetic resonance angiography (MRA) and cerebral angiography. Angiography is an X-ray examination of the blood vessels. The mapping procedure is performed under fluoroscopy using general anesthesia, and an expert neuro-anesthesiologist correctly titrates anesthesia to permit measurement of intracranial EEG. The number and location of implanted electrodes are pre-operatively planned based on a hypothesis, which is formulated in accordance with non-invasive pre-implantation data such as seizure semiology, ictal and inter-ictal scalp EEG, MRI images, PET and ictal single-photon emission computed tomography (SPECT) scans. Thus, the implantation strategy has the goal of accepting or rejecting the pre-implantation hypothesis of the location of the epileptogenic zone (EZ).
SEEG provides a complete coverage of the brain, from lateral, intermediate and/or deep structures in a three-dimensional arrangement recorded over hundreds of chan-nels. Using strict techniques, this procedure is safe and minimally invasive [10], [11].
C. Gambling task
Subjects performed the gambling task in their Epilepsy Monitoring Unit room. The task was displayed via a com-puter screen and the subject interacted with the task using an InMotion2 robotic manipulandum (Interactive Motion Technologies, USA). The manipulandum is controlled by the subject’s hand and allows for 2D planar motion, which translated directly to the position of a cursor on screen.
The gambling task (Fig. 2A) is based on a simple game of high card where subjects would win virtual money if their card beat the computer’s card. Specifically, in the beginning of each trial, the subject controlled a cursor via a planar manipulandum to a fixation target. Afterwards, the subject is shown his card (2, 4, 6, 8, or 10) that is randomly chosen with equal distribution (subjects are given the distribution of
$5 $20
Fixation Show Card Go-Cue Delay Show Deck Feedback
< 8 s 2 s < 6 s 0.35-0.6 s 1.3-1.55 s 1.3 s High bet (%) 0 100 2 4 6 8 10 cardʼs value Reaction time (s) 2 4 6 8 10 cardʼs value 0 1.5 Win $5! A B C 50 1.0 0.5
Fig. 2. Gambling task and behavioral results. (A) Timeline of the behavioral task. After fixation, subjects were shown their card. Once the bets were shown, subjects selected one of the choices and then were shown the computer’s card following a delay. Feedback was provided afterwards by displaying the amount won or lost. (B) Average bet decisions across cards. Subjects predominantly bet low for 2 and 4 cards and bet high for 8 and 10 cards. There was no predominant strategy for 6 cards, which had bout 33 % chance of eliciting a high bet. (C) Reaction times across cards. Subjects reacted faster for cards whose rewards had lower variability.
cards a priori). The computer’s card is initially hidden. The screen then shows their two choices: a high bet ($20) or a low bet ($5). The subject has 6 seconds to select one with his cursor. Following selection, the computer’s card, which follows the same distribution, is revealed. The final screen depicts the amount won or lost.
D. Data analysis
All electrophysiological and behavioral analyses were con-ducted offline using custom MATLAB® scripts.
Data for electrodes in the precuneus structure were sep-arated into rational and irrational trials. A rational trial is defined as a trial in which the subject bets low on a 2- or 4-card, or bets high on a 8- or 10-card, thus maximizing the expected reward conditioned on their card. On the other hand, an irrational trial is defined as a trial in which the subject bets high on a 2- or 4-card, or bets low on a 8- or 10-card. Trials in which the subject receives a 6-card are ignored.
Differences in the neural responses between the task conditions during the 250 ms before and 750 ms after show card were examined by means of a non-parametric cluster statistic. Specifically, spectrograms were constructed for each trial time-locked to when the player’s card is shown. Then the spectrograms for rational trials were compared to those for irrational trials. To see if spectrograms for each group were statistically significantly different, we used a nonparametric cluster-based test [12]. Clusters are defined as a set of adja-cent time-frequency windows whose activity is statistically significant between trials where the subject ends up betting rationally versus irrationally.
1) Spectral analysis: We calculated the oscillatory power using multitapers from the Chronux toolbox [13]. We used three orthogonal tapers with a 300 ms window sliding at
50 ms steps. We dropped frequencies under 10 Hz because of the Rayleigh criterion and analyzed upwards to 100 Hz. Afterwards, we normalize each frequency bin’s power by first taking the natural log of the power in each frequency bin, and then performing a Gaussian normalization based on the power in each frequency bin over the entire recording session.
2) Non-parametric cluster statistical test: Significant dif-ferences between the neural response data in each anatomical region are defined by a non-parametric cluster statistic run on data aggregated from trials by all relevant subjects [12]. This test leverages the dependency between adjacent time-frequency windows in order to avoid over-penalizing with multiple comparison corrections. For each time-frequency window in the spectrogram, a null distribution was created by shuffling these rational and irrational bet labels 1000 times between trials within each subject. Within each shuffle, the average difference between the newly labeled rational and irrational bet spectrograms was calculated. A p-value was assigned for each window by comparing the difference acquired from the true labels with the distribution of differ-ences acquired from the shuffled labels. Clusters were formed by grouping windows with significant p-values (p < 0.05) that were adjacent in either time or frequency. The test statistic for each cluster was calculated by taking the sum of the log of the p-values for each window in the cluster. This prioritizes clusters that both have strong differences as well as large sizes. A null distribution of cluster statistics was created using the same process but with the 1000 spectrograms obtained from the originally shuffled labels. The observed cluster statistic was then compared against this null distribution of cluster statistics in order to obtain the final p-value of the test.
3) High-frequency activity: The high-frequency activity (HFA) metric captures high gamma activity and reflects pre-vious work in SEEG [14] and other invasive recordings. HFA includes the average of all normalized log-power frequency bins between 70 and 100 Hz at each time point.
III. RESULTS AND DISCUSSION
This section summarizes the main findings of our analysis. First, we show the cluster analyses performed on precuneus neural data. Then, we show time-frequency differences of the neural responses around the show card epoch.
While multiple brain regions appear to show some re-sponse (data not shown), the two task conditions only signif-icantly differ after show card in precuneus (p < 0.001). The p-value was computed from a non-parametric cluster statistic described in Section II.
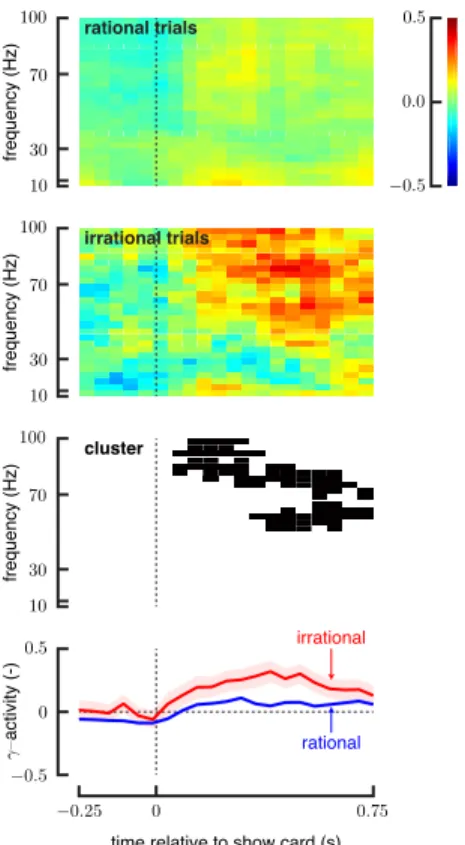
Differences in the neural responses around the show card was examined for precuneus (Fig. 3). Spectrograms of the neural responses between rational and irrational conditions show large differences in the high frequencies after the show card. We summarize the neural activity in the time-frequency domain by averaging the responses over 70–100 Hz. This high-frequency activity increases more for irrational trials in precuneus after the show card epoch.
irrational trials
frequency (Hz)
time relative to show card (s)
frequency (Hz) frequency (Hz) irrational rational rational trials activity (-) cluster
Fig. 3. Differences in the neural responses during the 250 ms before and 750 ms after the show card for precuneus. (First and second rows) Spec-trograms of the neural responses show differences in the time-frequency domain between rational and irrational conditions. (Third row) Clusters emphasize the region of the time-frequency domain where the neural responses show significant differences (p < 0.05). (Fourth row) High-frequency activity (70–100 Hz) increases after the show card for irrational trials while it doesn’t modulate significantly for rational trials. Shaded error bars represent 1 standard error.
The precuneus is a structure located just above the cuneate lobe (in the parietal lobe) of the brain, near the juncture be-tween the two hemispheres. The precuneus is interconnected to a variety of brain structures, making it integral to many systems. Consequently, the precuneus is involved in many functions generating complex human behaviors, including episodic memory, visual-spatial abilities, motor control, self perception, consciousness, and the executive and working memory.
Interestingly, the precuneus is responsible for allowing people to evaluate themselves, rating personality and physical traits. Its self-reflection allows comparisons to be made between the self and others, and informs societal behavior. A recent fMRI study suggested that the precuneus is involved in “reasoning in the social world” [15] and rationality. The authors use the definition of rationality proposed by “communicative action theory” [16], where rationality refers to interpersonal communication rather than to a knowing sub-ject. They showed that the precuneus, among other regions, activated during communicative reasoning.
In our subject population, the neural activity in the precuneus modulated significantly between rational and ir-rational trials (p < 0.001). In particular, high-frequency
activity increased after the show card for irrational trials. Such high frequency temporal dynamics cannot be observed with fMRI, yet decisions are made at such a fine temporal scale.
IV. CONCLUSION
In conclusion, our findings suggest that the precuneus should be taken into account in decision-making studies for examining the role of rationality as defined by maximizing a utility function such as the expected reward. Still, the exact mechanism by which the precuneus is involved in decision making is not known and will therefore remains the focus of future work.
ACKNOWLEDGMENT
This work was supported by a National Science Foundation grant (EFRI-MC3: # 1137237) awarded to S.V.S., J.A.G., J.B. and J.T.G.
REFERENCES
[1] M. Toda, “Emotion and decision making,” Acta Psychologica, vol. 45, no. 1–3, pp. 133–155, 1980.
[2] A. Bechara, “The role of emotion in decision-making: Evidence from neurological patients with orbitofrontal damage,” Brain and Cognition, vol. 55, no. 1, pp. 30–40, 2004.
[3] J. Kim and M. E. Ragozzino, “The involvement of the orbitofrontal cortex in learning under changing task contingencies,” Neurobiology of Learning and Memory, vol. 83, no. 2, pp. 125–133, 2005. [4] I. Bohn, C. Giertler, and W. Hauber, “Orbital prefrontal cortex and
guidance of instrumental behaviour in rats under reversal conditions,” Behavioural Brain Research, vol. 143, no. 1, pp. 49–56, 2003. [5] N. K. Logothetis, “What we can do and what we cannot do with
fMRI,” Nature, vol. 453, pp. 869–878, June 2008.
[6] G. I. Christopoulos, P. N. Tobler, P. Bossaerts, R. J. Dolan, and W. Schultz, “Neural correlates of value, risk, and risk aversion con-tributing to decision making under risk,” The Journal of Neuroscience, vol. 29, no. 40, pp. 12574–12583, 2009.
[7] M. A. Johnson, S. Thompson, J. Gonzalez-Martinez, H.-J. Park, J. Bulacio, I. Najm, K. Kahn, M. Kerr, S. V. Sarma, and J. T. Gale, “Performing behavioral tasks in subjects with intracranial electrodes,” Journal of Visualized Experiments, no. 92, p. e51947, 2014. [8] D. ¨Ong¨ur and J. Price, “The organization of networks within the orbital
and medial prefrontal cortex of rats, monkeys and humans,” Cerebral Cortex, vol. 10, no. 3, pp. 206–219, 2000.
[9] W. F. Asaad and E. N. Eskandar, “A flexible software tool for temporally-precise behavioral control in Matlab,” Journal of Neuro-science Methods, vol. 174, no. 2, pp. 245–258, 2008.
[10] J. Gonzalez-Martinez, J. Mullin, S. Vadera, J. Bulacio, G. Hughes, S. Jones, R. Enatsu, and I. Najm, “Stereotactic placement of depth electrodes in medically intractable epilepsy,” Journal of Neurosurgery, vol. 120, no. 3, pp. 639–644, 2014.
[11] F. Cardinale and G. Lo Russo, “Stereo-electroencephalography safety and effectiveness: Some more reasons in favor of epilepsy surgery,” Epilepsia, vol. 54, no. 8, pp. 1505–1506, 2013.
[12] E. Maris and R. Oostenveld, “Nonparametric statistical testing of EEG-and MEG-data,” Journal of Neuroscience Methods, vol. 164, no. 1, pp. 177–190, 2007.
[13] H. Bokil, P. Andrews, J. E. Kulkarni, S. Mehta, and P. P. Mitra, “Chronux: A platform for analyzing neural signals,” Journal of Neu-roscience Methods, vol. 192, no. 1, pp. 146–151, 2010.
[14] T. Ossand´on, K. Jerbi, J. R. Vidal, D. J. Bayle, M.-A. Henaff, J. Jung, L. Minotti, O. Bertrand, P. Kahane, and J.-P. Lachaux, “Transient suppression of broadband gamma power in the default-mode network is correlated with task complexity and subject performance,” The Journal of Neuroscience, vol. 31, no. 41, pp. 14521–14530, 2011. [15] M. Schaefer, H.-J. Heinze, M. Rotte, and C. Denke, “Communicative
versus strategic rationality: Habermas theory of communicative action and the social brain,” PLoS ONE, vol. 8, p. e65111, May 2013. [16] T. McCarthy, “Translator’s introduction,” in The theory of
communica-tive action: Reason and the Rationalization of Society(J. Habermas, ed.), Beacon Press, 1984.