Display awareness in subjective and objective video quality evaluation
Texte intégral
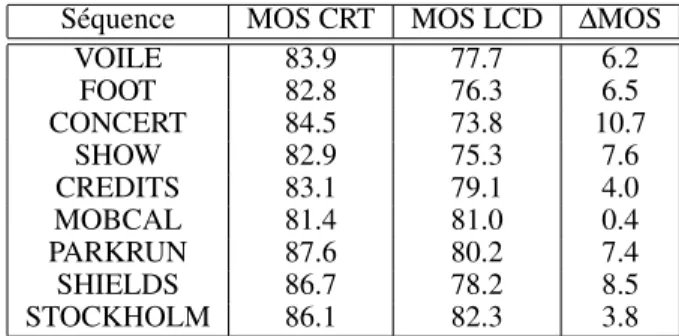
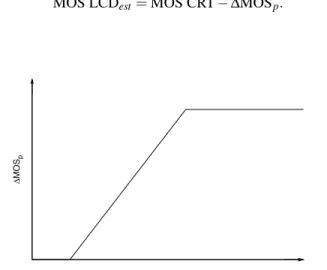
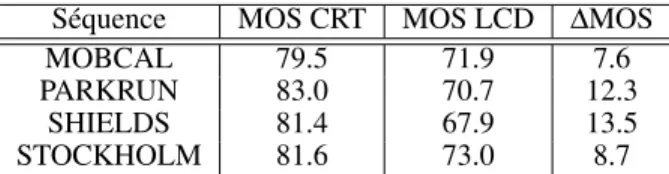
Figure

Documents relatifs
Through the description of two repositories that administrate a Shanoir environ- ment (Neurinfo and OFSEP), we have illustrated how a large variety of users can diffuse,
L’archive ouverte pluridisciplinaire HAL, est destinée au dépôt et à la diffusion de documents scientifiques de niveau recherche, publiés ou non, émanant des
Au regard des objectifs retenus, la politique conduite s'est révélée efficace pour augmenter la production et pour développer l'industrie textile dont les besoins en matière
La cohorte est en cours d’exploration et les résultats préliminaires mettent en évidence une présence des cellules MuStem dans les 2/3 inférieurs du myocarde
En inscrivant ce projet dans une démarche scientifique de suivi de ses impacts sur les écosystèmes, la démarche définie par le Conseil scientifique du Parc, adoptée le
Following the aforementioned literature, we measure innovation effort in nuclear reactors through priority patent applications in twelve OECD countries with commercial NPPs between
- Les PME innovantes créées depuis moins de 5 ans ; - Les entreprises réalisant un projet de Recherche, de développement et d’innovation (RDI) et qui ont déjà bénéficié
Bayesian assignment tests based on 423 AFLP loci and the distribution of 36 species-specific mitochondrial haplotypes both indicate a low frequency of invasive and hybrid
