Titre:
Title
:
Dynamic trace-based sampling algorithm for memory usage
tracking of enterprise applications
Auteurs:
Authors
: Houssem Daoud, Naser Ezzati-jivan et Michel R. Dagenais
Date: 2017
Type:
Communication de conférence / Conference or workshop itemRéférence:
Citation
:
Daoud, H., Ezzati-jivan, N. & Dagenais, M. R. (2017, septembre). Dynamic
trace-based sampling algorithm for memory usage tracking of enterprise applications.
Communication écrite présentée à 2017 IEEE High Performance Extreme Computing Conference, Waltham, MA, USA (7 pages).
doi:10.1109/hpec.2017.8091061
Document en libre accès dans PolyPublie
Open Access document in PolyPublie URL de PolyPublie:
PolyPublie URL: https://publications.polymtl.ca/2979/
Version: Version finale avant publication / Accepted versionRévisé par les pairs / Refereed Conditions d’utilisation:
Terms of Use: Tous droits réservés / All rights reserved
Document publié chez l’éditeur officiel
Document issued by the official publisher Nom de la conférence:
Conference Name: 2017 IEEE High Performance Extreme Computing Conference
Date et lieu:
Date and Location: 2017-09-12 - 2017-09-14, Waltham, MA, USA
Maison d’édition:
Publisher: IEEE
URL officiel:
Official URL: https://doi.org/10.1109/hpec.2017.8091061
Mention légale:
Legal notice:
© 2018 IEEE. Personal use of this material is permitted. Permission from IEEE
must be obtained for all other uses, in any current or future media, including
reprinting/republishing this material for advertising or promotional purposes,
creating new collective works, for resale or redistribution to servers or lists, or
reuse of any copyrighted component of this work in other works.
Ce fichier a été téléchargé à partir de PolyPublie, le dépôt institutionnel de Polytechnique Montréal
This file has been downloaded from PolyPublie, the institutional repository of Polytechnique Montréal
Dynamic Trace-based Sampling Algorithm for Memory Usage
Tracking of Enterprise Applications
Houssem Daoud
Ecole Polytechnique MontrealMontreal, Quebec H3T 1J4 [email protected]
Naser Ezzati-jivan
Ecole Polytechnique MontrealMontreal, Quebec H3T 1J4 [email protected]
Michel R. Dagenais
Ecole Polytechnique MontrealMontreal, Quebec H3T 1J4 [email protected]
Abstract—Excessive memory usage in software applications has become a frequent issue. A high degree of parallelism and the monitoring difficulty for the developer can quickly lead to mem-ory shortage, or can increase the duration of garbage collection cycles. There are several solutions introduced to monitor memory usage in software. However they are neither efficient nor scalable. In this paper, we propose a dynamic tracing-based sampling algorithm to collect and analyse run time information and metrics for memory usage. It is implemented as a kernel module which gathers memory usage data from operating system structures only when a predefined condition is set or a threshold is passed. The thresholds and conditions are preset but can be changed dynamically, based on the application behavior. We tested our solutions to monitor several applications and our evaluation results show that the proposed method generates compact trace data and reduces the time needed for the analysis, without loosing precision.
I. INTRODUCTION
Analysing software systems is becoming exceedingly diffi-cult and complex because of the large-scale parallelism and multiple abstraction layers. Newer systems include multiple nodes in parallel, each containing a large number of cores as well as parallel co-processors for graphics, signal processing and networking. Virtualisation, at the machine and network level, further complicates observability and performance de-bugging.
Dynamic analysis through execution tracing is a solution for the detailed run time analysis of such systems. Tracing works by hooking into the different layers and locations of the software and by collecting runtime data while the software is running. It gathers valuable information about system execution and can be used in software comprehension and for finding problems and misbehaviors.
Although tracing in general is a great solution to analyse runtime behavior of systems, it may present some challenges: the trace size may be huge (in the gigabytes for only a few seconds of tracing). The large tracing data size impacts the storage space required, the analysis time, and may hinder opportunities for the timely detection of sensitive problems.
Our goal is to analyse system memory usage from the kernel point of view, since this is where actual physical resources are eventually consumed. Many state-of-the-art tools perform virtual memory monitoring from userspace [10], [3]. Their methods mostly require the instrumentation of the memory allocator of the programming language, or use a pre-loaded library that overrides the original memory allocation functions.
Those solutions are not portable and can only target a specific runtime environment.
We propose a generic trace-based architecture to monitor and analyse the memory usage of any application, possibly involving multiple processes and programming languages. The challenges we face and aim to solve in this trace-based dynamic memory usage analysis method are as follows:
• The high frequency of memory operations makes for huge
trace files.
• It is not usually possible to reduce the trace size by
just targeting a single process, using basic trace filtering techniques, since the actual physical memory release is done out of the process context.
• Tracing can itself contribute to the memory pressure. This paper presents a dynamic sampling technique to reduce the amount of trace data generated. The technique works by hooking on some memory related functions (i.e., using existing tracepoints) in the operating system kernel and listen to the events. Then, instead of generating events for each occurrence of the function, it only collects samples when a predefined condition is true, (e.g., a predefined but changeable threshold is passed or a particular time duration has elapsed). The proposed method:
• instruments the Kernel to get the required information;
• provides filtering and aggregation mechanisms based on some thresholds to reduce the frequency of events;
• generates metrics and visualizations from the trace file. This can lead to greater efficiency when used to trace high frequency operations like memory allocations. In some applications, memory related functions are called at a very high frequency, (e.g., more than 10,000 times per millisecond), generating huge trace files. As we will see later in the paper, the new approach reduces the size of trace data and the analysis time, while providing the same analysis output and precision.
The contribution of the paper lies in the proposal of an effi-cient architecture for in-kernel trace sampling and aggregation. The solution was tested to track high frequency kernel memory allocation functions, and the efficiency and usefulness of the method were confirmed.
In the remainder of the paper, we first review the related work. Then, after exposing the motivation for this work, we
propose our new architecture and conclude with use cases and evaluations.
II. RELATED WORK
Tracing is a dynamic analysis method that collects trace logs for the execution of a software system. A trace log entry can represent a function call, a system call, a signal, a network packet, etc. Unlike debugging, which is a step by step procedure going through the program execution to get its current state, or discover a problem, tracing is a more background process. Tracing collects runtime data during the execution and stores it on a local or remote disk for later analysis [9]. The tracing impact must be as low as possible to preserve the normal software behavior.
LTTng [6] is a low impact open source Linux tracing tool developed in the DORSAL Lab1to provide tracing capabilities
for the Linux kernel and user-space applications. Kernel trac-ing can be performed dynamically ustrac-ing Kprobes, or statically using the TRACE EVENT macro. Traces generated by LTTng can be used to analyse the run-time behavior of systems. For instance, trace-driven tools are proposed in the literature for disk block analysis [5], virtual machine analysis [1], [2], userspace level applications (e.g., Chromium browser) [15], [12], web applications [4] and live stream analysis [8]. Since LTTng is a low-impact tracer [7], and provides data at multiple system levels, it has been used in this paper to collect the tracing data about memory usage.
Griswold et al. [10] instrumented memory allocation and liberation operations of the Icon programming language. The instrumentation was done using macros, which was not op-timized for multi-threaded applications. The trace generated was used to present the memory usage as a 2D graph where each object allocated is shown as a rectangle, proportional to the size of the allocation.
GCspy [14] is a memory monitoring framework developed by Printezis et al. This tool follows a client-server architecture: the collection of data is done on the server side and the visualization on the client side. The data collection requires using an instrumented memory allocator. The authors started by instrumenting the Java Virtual Machine (JVM) to track memory allocations in the Java programming language.
Cheadle et al. [3] extended GCspy to support dlmalloc, the C memory allocator used by the Glibc library. They also proposed different optimization to GCspy to reduce the communication frequency between the client and the server, as well as an automatic problem detector. GCspy uses animated images to show the state of the heap memory throughout time. This visualization is not appropriate with some applications, since the refresh rate of the animation cannot handle high frequency memory events.
Jurenz et al. [11] extended VampirTrace, a performance analysis tool, to provide a detailed memory analysis based on execution traces. Instrumentation is done using shared
1Distributed open reliable systems analysis lab (DORSAL) http://www.dorsal.polymtl.ca
library pre-loading. Original memory manipulation symbols like malloc, free, calloc, etc. are overridden with new functions that contain the required tracepoints. The limitation of this method is that it targets only the processes that are started with the pre-loaded library. There is no way to trace an already running program, or to trace all the programs running on the system at the same time. TraceCompass2 also provides a memory analysis view that uses library pre-loading to collect LTTng-UST traces.
Massif is a heap memory profiler provided with Val-grind [13]. It hooks into the application loading code using LD PRELOAD and shows its heap memory usage. It can be used to optimize and reduce the memory usage of programs. Although Massif is a useful tool to monitor memory usage, it easily doubles the execution time of the application.
III. MOTIVATION
Tracking memory usage is important to know which pro-cesses are consuming more memory resources and therefore to detect performance problems. The operating system uses complex mechanisms to manage the physical memory. When a process allocates memory, a new virtual memory space is created and assigned to the process. The real physical memory allocation is done afterward, when the memory is actually accessed by the process. The opposite operation is even more tricky. When a process asks the kernel to release (free) the memory, the kernel releases it from its virtual memory space. However, the physical release only happens when another process needs to get more physical memory.
Many tools use sampling to track the memory usage of processes using the /proc filesystem. Most of those tools use a sampling frequency of 1 Hz, which gives a low precision result. Using a fixed sampling frequency is not a good solution, since the rate of memory operations varies considerably from one process to another and through time.
Tracing is another way to get information from the kernel. If we trace memory operations like allocations and liberations, we can track in a very precise way the memory usage of processes. The problem is that those are high frequency events with the potential of overwhelming the tracing subsystem, causing lost events, which prevent precise computations. Even if we were able to collect all events using big tracing buffers, the trace file would be huge and very difficult to read and analyse.
One idea to limit the trace size is to filter the tracing events to include just one process, but this solution is not possible because, as mentioned earlier, the physical memory liberation does not always occur in the context of the target process. It may happen in the context of kernel threads or in the context of another process that reclaims the memory.
In this paper, we combine the benefits of both approaches, tracing and sampling, by proposing a dynamic trace-based sampling method. The sampling rate is defined based on the frequency of the related trace events.
Fig. 1. Sampling
IV. ARCHITECTURE
Memory management of modern operating systems is now much more complex. Each process has a contiguous virtual address space in which it allocates the required memory objects. A physical memory page is associated to a virtual one, by the page fault handler, only when the process actually accesses it.
In this paper, we provide a tool to monitor virtual and physical memory usage using a combination of tracing and sampling techniques. The proposed architecture is shown in Figure 2.
Fig. 2. Architecture
A. Virtual memory monitoring
The method tracks the virtual memory usage from the kernel space. It traces the different system calls related to memory allocation and release, and uses them as triggers for the Kernel Counters Reader.
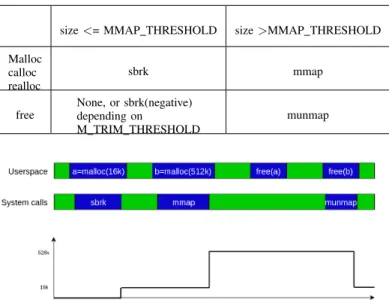
Memory-related functions like malloc(), calloc(), realloc(), and free() use system calls to interact with the operating sys-tem modules where the memory management is accomplished. Table I shows the mapping between library functions and system calls.
The behavior of the allocator differs depending on the size of the allocation. Small allocations are achieved using sbrk system calls, which increase the size of an existing virtual space region. In this case, releasing the memory allocated doesn’t automatically reduce the size of the virtual space. In contrast, big allocations are done using mmap and released right away by munmap after the memory is freed by the applications (Figure 3)
TABLE I
MAPPING BETWEEN MEMORY FUNCTIONS AND SYSTEM CALLS
size<= MMAP THRESHOLD size>MMAP THRESHOLD Malloc calloc realloc sbrk mmap free None, or sbrk(negative) depending on M TRIM THRESHOLD munmap
Fig. 3. Virtual memory growth after allocation and release operations
The virtual memory of a specific process also grows when a shared library is loaded or when a shared segment is mapped into the address space using shmat.
The system calls cited in Table I are used as triggers for the Kernel Counter Reader which reads the exact value of virtual memory usage from the mm struct of the concerned process and generates an LTTng trace event.
B. Physical memory monitoring: Dynamic sampling algorithm Physical memory monitoring presents a big challenge com-pared to virtual memory: the memory manager of the operating system generates a huge number of events, and recording them all in a trace file is almost impossible.
Sampling can be a good solution for this case, but choosing a sampling rate is not an easy task. Some processes demand and access the memory very frequently during the execution, while others access it less frequently. A low sampling rate gives a bad precision but, on the other hand, a high sampling rate generates a huge amount of useless data for inactive processes.
In Algorithm 1, the method that dynamically changes the sampling rate, depending on processes activity, is presented.
It is a 2D sampling algorithm that uses the time and the memory variability to chose the appropriate time to get memory usage information from the Kernel data structures. An event is generated if the timer finishes, or before that if the memory variability of a process exceeds a certain threshold, as shown in Figure 4. The blue points represent timer events, and the red points are the events caused by the threshold.
Memory variability is computed by hooking on kmem mm page alloc and kmem mm page free events, which occur when a physical page is allocated or released. The Kernel keeps information about physical memory usage
Input: Sampling rate Variability threshold //Main thread startTimer(rate)
if Timer tick then
processes←− ListSystemP rocesses()
forprocess in processes do trace memory(process) variability[process]←− 0 end restartTimer() end //Kprobe hook
if memory page allocated/released then
process←− getCurrentP rocess()
variability[process]+ = P AGE SIZE∗ direction
if variability[process] exceeds the threshold then trace memory(process)
end end
Algorithm 1: Dynamic sampling Algorithm
Fig. 4. (Time, Space) Sampling
in the mm struct data structure (RSS: Resident set size) This counter is adjusted each time a physical page is inserted or removed from the page table of the process.
The proposed algorithm is implemented as a Kernel module and is configurable through the proc file system (sampling rate, variability threshold).
Lock-free data structures are used to provide a good scala-bility:
• RCU Hashmap is used to hold process information
• Memory variability is defined as atomic long to avoid using heavy synchronization mechanisms.
V. EVALUATION
In this section, we evaluate the performance and the useful-ness of our tool. Benchmarking was performed with a synthetic
workload and then with real applications. We compared our method with Massif, another state-of-the-art tool, to confirm the correctness of our analysis.
A. Performance
The performance tests are executed on an Intel i7-4790 CPU @ 3.60GHz with 6 GB of main memory and an Intel SSD 530 Series 240 GB hard disk, running Linux Kernel version 4.4. The traces are collected using LTTng 2.8.
The following cases are used for benchmarking:
• No tracing: the program runs without any tracing mech-anism.
• Dynamic sampling:We used our dynamic sampling mod-ule with a sampling period of 10 ms and a memory variability threshold of 10 MB.
• LTTng all memory events: We traced all memory al-location and release events. We used the tracepoints kmem mm page alloc and kmem mm page free.
• Massif: We used Massif, a widely used memory moni-toring tool.
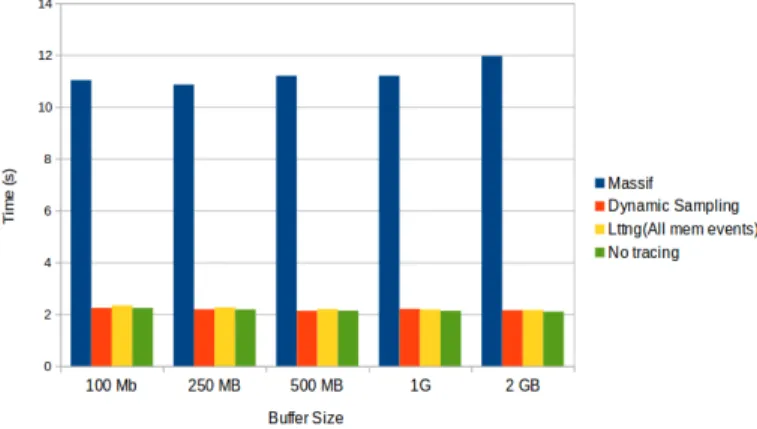
A program was developed to generate a memory access workload. It allocates, accesses and frees a memory buffer of a certain size, and repeats the operation until it reaches 20GB of workload. The execution time of this program with the different configurations is presented in Table II and Figure 5. The same benchmark is also performed with real applications: Firefox, a widely-used web browser, and Totem, the default movie player of the GNOME desktop. The results are reported in Table III.
Fig. 5. Tracing impact on execution time
The results show that the overhead of Massif is very high, as compared to other cases. It is 5x slower with the benchmarking program, 3x slower with Totem and 20x slower with Firefox. In contrast, the overhead of the two other cases is almost negligible. It doesn’t exceed 1% in all cases.
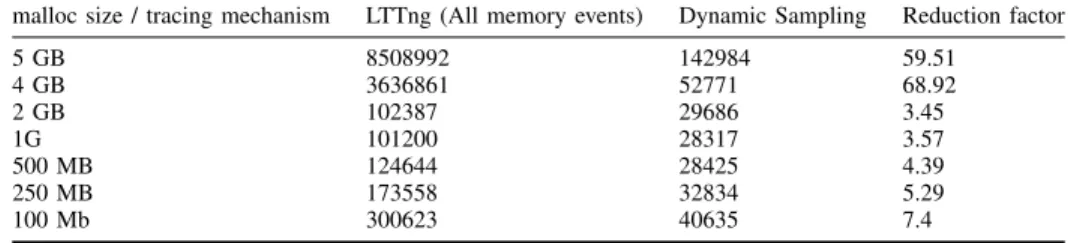
It is expected that the Dynamic sampling algorithm and LTTng all memory events are similar in terms of execution time because we are tracing the same kernel functions in both cases, the difference is in the number of events generated. Table IV shows that with a sampling period of 10 ms and a memory variability threshold of 10 MB, we can reduce the
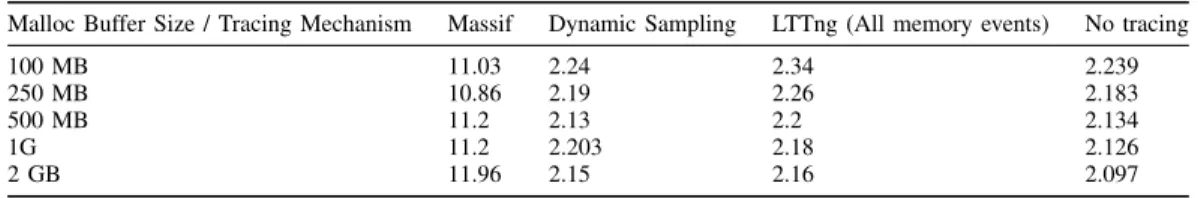
TABLE II
EXECUTIONTIME IN SECONDS AS A FUNCTION OF THEMALLOC BUFFER SIZE,WITH DIFFERENT TRACING MECHANISMS Malloc Buffer Size / Tracing Mechanism Massif Dynamic Sampling LTTng (All memory events) No tracing
100 MB 11.03 2.24 2.34 2.239 250 MB 10.86 2.19 2.26 2.183 500 MB 11.2 2.13 2.2 2.134 1G 11.2 2.203 2.18 2.126 2 GB 11.96 2.15 2.16 2.097 TABLE III
EXECUTIONTIME IN SECONDS FOR SOME APPLICATIONS WITH DIFFERENT TRACING MECHANISMS
Application / Tracing Mechanism Massif Dynamic Sampling LTTng (All memory events) No tracing
Firefox 51 2.509 2.59 2.51
Totem (10 seconds video) 28 10.641 10.645 10.752
Benchmark application (Buffer size = 500 MB) 11.2 2.13 2.2 2.134
size of the trace by a factor between 3 and 7 for a normal workload.
An interesting phenomenon happens when the buffer size is more than 4 GB. The operating system goes into a thrashing state. Memory pages start to be moved between the main memory and the swap space, which creates a huge memory activity. Tracing all memory activity at this point is very inefficient, and somehow impossible since the number of events is very high. The Dynamic Sampling Mechanism is able to handle this case by filtering the unnecessary events on the kernel side.
B. Correctness
In this section, we use our tool to monitor the virtual and the physical memory usage of different applications and we use Massif, the Valgind memory profiler, to validate that the results are the same with both tools.
At first, We traced our program using the dynamic bench-marking mechanism and we used TraceCompass to show the results graphically. The output of our tool (Figure 6) corresponds perfectly to logic behind the code. The program allocates 500 MB, access the allocated memory and the frees it.
We can see that the virtual memory, shown in red, is allo-cated when malloc() is called. The physical memory, shown in blue, is allocated when the memory pages are accessed using memset(). The virtual and physical memory are released during the free() function call.
Fig. 6. Virtual and physical memory usage monitoring
Figures 8 and 7 show that both tools give similar memory usage graphs for Firefox. Totem memory usage is also plotted by both tools in Figures 9 and 10 which displays the same output for both approaches.
Fig. 7. Firefox memory usage at startup using LTTng
Fig. 8. Firefox memory usage at startup using Massif
Our tools bring other important advantages when compared to Massif. Physical memory usage is shown and the analysis covers all the processes running on the system at the same time, not only one targeted process.
TABLE IV
NUMBERS OF EVENTS IN THE TRACE FILE GENERATED BYLTTNG(ALL MEMORY EVENTS)AND THEDYNAMICSAMPLINGMECHANISM malloc size / tracing mechanism LTTng (All memory events) Dynamic Sampling Reduction factor
5 GB 8508992 142984 59.51 4 GB 3636861 52771 68.92 2 GB 102387 29686 3.45 1G 101200 28317 3.57 500 MB 124644 28425 4.39 250 MB 173558 32834 5.29 100 Mb 300623 40635 7.4
Fig. 9. Totem memory usage to play a video using LTTng +
Fig. 10. Totem memory usage to play a video using Massif
VI. CONCLUSION
In this paper, a framework to collect memory usage infor-mation for enterprise applications is proposed. It includes a dynamic sampling algorithm to gather runtime information from the operating system kernel. The method checks if a certain time has elapsed or if a threshold was reached and then gathers information from the kernel data structures and generates trace events to be processed and analysed later. The thresholds are dynamic and can be updated based on the application behavior and memory usage pattern (e.g., the rate of memory allocation calls).
We have tested our method against some real world ap-plications like Firefox and the Totem video player, and the results demonstrate that the performance cost of the proposed approach is negligible while the precision is preserved.
The proposed solution was used to analyse memory usage. However, the architecture is generic enough to be used for any other resource usage metric. It can actually be used
for other high frequency tracing events within the operating system kernel, like network usage, disk I/O, etc. Extending the proposed method to support other kinds of metrics, and using other high frequency events, will be investigated as a future work.
VII. ACKNOWLEDGMENT
We would like to gratefully acknowledge the Natural Sci-ences and Engineering Research Council of Canada (NSERC), Prompt, Ericsson and EfficiOS for funding this project.
REFERENCES
[1] C. Biancheri, N. Ezzati-Jivan, and M. R. Dagenais. Multilayer virtual-ized systems analysis with kernel tracing. In 2016 IEEE 4th Interna-tional Conference on Future Internet of Things and Cloud Workshops (FiCloudW), pages 1–6, Aug 2016.
[2] C´edric Biancheri and Michel R. Dagenais. Fine-grained multilayer virtu-alized systems analysis. J. Cloud Comput., 5(1):69:1–69:14, December 2016.
[3] Andrew M Cheadle, AJ Field, JW Ayres, Neil Dunn, Richard A Hayden, and J Nystrom-Persson. Visualising dynamic memory allocators. In Pro-ceedings of the 5th international symposium on Memory management, pages 115–125. ACM, 2006.
[4] Houssem Daoud and Michel R. Dagenais. Multi-level diagnosis of performance problems in distributed systems. Journal of Systems and Software, pages 1–14, 2017.
[5] Houssem Daoud and Michel R. Dagenais. Recovering disk storage metrics from low-level trace events. SOFTWAREPRACTICE AND EXPERIENCE, pages 1–14, 2017.
[6] Mathieu Desnoyers. Low-impact operating system tracing. PhD thesis, ´
Ecole Polytechnique de Montr´eal, 2009.
[7] Mathieu Desnoyers and Michel R Dagenais. Lockless multi-core high-throughput buffering scheme for kernel tracing. ACM SIGOPS Operating Systems Review, 46(3):65–81, 2012.
[8] Naser Ezzati-Jivan and Michel R Dagenais. Cube data model for multilevel statistics computation of live execution traces. accepted in Concurrency and Computation: Practice and Experience, 2014. [9] Naser Ezzati-Jivan and Michel R Dagenais. Multiscale abstraction and
visualization of large trace data: A survey. submitted to The VLDB Journal, 2014.
[10] Ralph E. Griswold and Gregg M. Townsend. The visualization of dynamic memory management in the icon programming language. University of Arizona, Department of Computer Science, 1989. [11] Matthias Jurenz, Ronny Brendel, Andreas Kn¨upfer, Matthias M¨uller,
and Wolfgang E Nagel. Memory allocation tracing with vampirtrace. In International Conference on Computational Science, pages 839–846. Springer, 2007.
[12] K. Kouame, N. Ezzati-Jivan, and M. R. Dagenais. A flexible data-driven approach for execution trace filtering. In 2015 IEEE International Congress on Big Data, pages 698–703, June 2015.
[13] Nicholas Nethercote and Julian Seward. Valgrind: A framework for heavyweight dynamic binary instrumentation. SIGPLAN Not., 42(6):89– 100, June 2007.
[14] Tony Printezis and Richard Jones. GCspy: an adaptable heap visuali-sation framework, volume 37. ACM, 2002.
[15] Florian Wininger, Naser Ezzati-Jivan, and Michel R. Dagenais. A declarative framework for stateful analysis of execution traces. Software Quality Journal, pages 1–29, 2016. URL: http://dx.doi.org/10.1007/ s11219-016-9311-0.