HAL Id: hal-00250437
https://hal.archives-ouvertes.fr/hal-00250437
Submitted on 14 Feb 2008HAL is a multi-disciplinary open access archive for the deposit and dissemination of sci-entific research documents, whether they are pub-lished or not. The documents may come from teaching and research institutions in France or abroad, or from public or private research centers.
L’archive ouverte pluridisciplinaire HAL, est destinée au dépôt et à la diffusion de documents scientifiques de niveau recherche, publiés ou non, émanant des établissements d’enseignement et de recherche français ou étrangers, des laboratoires publics ou privés.
A robust image watermarking technique based on
quantization noise visibility thresholds
Florent Autrusseau, Patrick Le Callet
To cite this version:
Florent Autrusseau, Patrick Le Callet. A robust image watermarking technique based on quan-tization noise visibility thresholds. Signal Processing, Elsevier, 2007, 87 (6), pp.1363-1383. �10.1016/j.sigpro.2006.11.009�. �hal-00250437�
A Robust image watermarking technique
based on quantization noise visibility
thresholds
Florent Autrusseau, Patrick Le Callet
IRCCyN lab. Polytech’Nantes, Rue Ch. Pauc, BP 50609, 44306 Nantes, France
Abstract
A tremendous amount of digital multimedia data is broadcasted daily over the in-ternet. Since digital data can be very quickly and easily duplicated, intellectual property right protection techniques have become important and first appeared about fifty years ago (see [16] for an extended review). Digital watermarking was born. Since its inception, many watermarking techniques have appeared, in all pos-sible transformed spaces. However, an important lack in watermarking literature concerns the human visual system models. Several Human Visual System (HVS) model based watermarking techniques were designed in the late 1990’s. Due to the weak robustness results, especially concerning geometrical distortions, the interest in such studies has reduced. In this paper, we intend to take advantage of recent advances in HVS models and watermarking techniques to revisit this issue. We will demonstrate that it is possible to resist to many attacks, including geometrical dis-tortions, in HVS based watermarking algorithms. The perceptual model used here takes into account advanced features of the HVS identified from psychophysics ex-periments conducted in our laboratory. This model has been successfully applied in quality assessment and image coding schemes [39,31]. In this paper the human visual system model is used to create a perceptual mask in order to optimize the watermark strength. The optimal watermark obtained satisfies both invisibility and robustness requirements. Contrary to most watermarking schemes using advanced perceptual masks, in order to best thwart the de-synchronization problem induced by geometrical distortions, we propose here a Fourier domain embedding and detec-tion technique optimizing the amplitude of the watermark. Finally, the robustness of the scheme obtained is assessed against all attacks provided by the Stirmark benchmark. This work proposes a new digital rights management technique using an advanced human visual system model that is able to resist various kind of attacks including many geometrical distortions.
Key words: image watermarking, perceptual model, quantization noise, visibility thresholds, geometrical distortions
2. Manuscript
hal-00250437, version 1 - 14 Feb 2008
Author manuscript, published in "Signal Processing 87, 6 (2007) 1363-1383" DOI : 10.1016/j.sigpro.2006.11.009
1 Introduction
1.1 Invisibility versus robustness: HVS and spread spectrum
Data hiding has been used for several purposes such as steganography, index-ing, authentication, fingerprinting copyright protection, copy control and more recently has even been utilised in quality assessment [41,40]. The requirements strongly differ for each of these applications [19]. Concerning digital rights management, the main requirements are copyright invisibility, embedded data capacity and robustness against most attacks the image could undergo. The first watermarking schemes performed slight luminance modifications [7,8] or less significant bits substitutions [37]. These techniques easily ensure the wa-termark invisibility and a high embedding capacity, however, the robustness requirements are not fulfilled. Ensuring the best invisibility versus robust-ness trade-off is not obvious, for instance it is well-known that a watermark embedded into perceptually insignificant data components would easily be re-moved by an appropriate perceptually lossy compression [14]. This observation brought the spread spectrum theory into watermarking techniques. In spread spectrum theory, the media (images, videos, ...) are considered as a commu-nication channel and the embedded watermark is viewed as the signal to be transmitted through this channel. The goal is then to spread the watermark data over as many frequencies as possible. This ensures a good invisibility versus robustness trade-off. Since most watermarking techniques are actually based on ideas from spread spectrum communications [2], we will not provide the details of this theory here, but rather recommend readers to refer to these pioneering works using spread spectrum in watermarking context [15], [14], [2]. In fact, such techniques don’t guarantee the optimal invisibility, which could only be provided by using a HVS model. The interoperability between spread spectrum techniques and HVS models remains a complex issue.
1.2 Visibility and watermarking
Concerning visual aspects, the invisibility of the watermark is usually either empirically assumed or only tested with simplified quality metrics such as Peak Signal to Noise Ratio (PSNR) or Root Mean Square Error (RMSE). Most wa-termarking approaches aiming in the optimization of the robustness versus invisibility trade-off are inspired on well-known perceptual properties from a qualitative point of view rather than on advanced quantitative visual models. This is all the more surprising since several image processing applications, such as quality assessment [9], or compression [45] made the implementation of complex perceptual models possible. In watermarking applications, a few
studies were conducted on the creation of perceptual masks in a data hid-ing context. A perceptual mask or JND (Just Noticeable Difference) mask is supposed to indicate the maximum amount one can add or subtract at every image site without producing any visible difference. A typical example of the exploitation of qualitative HVS properties is addressed in [22], where the au-thors made the following heuristic assumptions: the noise sensitivity is weak on the image edges, smooth areas are very sensitive to variations and textured areas have a high noise sensitivity level. An edges-texture classification is then used in order to create Masks. The so obtained content based watermarking technique was found to be robust against several attacks, such as JPEG com-pression, cropping, or Gaussian noise addition. An original method addressing higher levels of the HVS to define suitable masks has been defined in [34]. The method is based on a qualitative approach to regions of interest. Basically, the watermark is inserted in regions that have either high motion (because such regions are not trackable by the HVS) or slow relative motion (because they are not relevant). A similar study was also conducted in [57], investigating in which region an artifact is noticeable based on color saliency. However, al-though such heuristic properties can be exploited to implement simple masks, some very useful HVS features are not taken into account. For instance, using an advanced HVS model could allow to fully exploit the masking effects, and thus, to optimize both the invisibility and robustness of the mark.
1.3 HVS properties regarding visibility
To create a JND mask we should address low level parts of the HVS related to visibility mechanisms. Unfortunately, even the low level parts are not easy to model and several decades of psychophysics have been necessary to provide el-ements of visibility prediction. Experiments on sine wave gratings have driven the emergence of the contrast sensitivity function (CSF) concept, providing the just noticeable contrast threshold at a given spatial frequency. In this case, the HVS behavior is considered as mono channel, and its Modulation Trans-fer Function (MTF) is the CSF. Several CSF models have been proposed in the literature [55,56]. For luminance component (grey level images), it is well admitted that the CSF is a band-pass although some studies suggested that this is not true for suprathreshold conditions leading to the concept of con-trast constancy. In watermarking applications, we are clearly concerned with visibility around the threshold since only slight modifications of the original signal are performed and one of the goals is to guarantee that these modi-fications are not detectable. Therefore, standard CSFs could be exploited as they are linked to detection whereas suprathreshold conditions are linked to perception. Nevertheless, CSFs are not adapted to predict visibility for com-plex signals such as natural images, essentially because the HVS is modeled by a single channel. Several physiological studies showed that most cells in
the HVS are tuned to specific visual information, such as color, orientation or frequency. Psychophysics experiments [10,35] have pointed out the HVS multi-channel structure and more specifically the existence of spatio-frequency visual channels. These visual channels can be modeled by a filter bank separating each perceptual channel also called perceptual sub-bands. Such multi-channel visual decomposition is perfectly suitable to model masking effects. Masking effects occur when the visibility of a signal is affected by other signals. This effect can imply an important difference in the threshold values compared with those provided by the CSF. Therefore it should be taken into account, carefully addressing the visibility purpose. In the case of luminance images, interactions causing the masking effect occur between signals that are in the same channels. Therefore, only multi channel models are suitable to efficiently model the masking effects.
Masking effects have been the subject of many studies and several models have been proposed [24,18,21,42]. Most authors agree on the general shape of the HVS decomposition, that is usually modeled as a polar representation of separable channels. Nevertheless, although the decompositions are usually based upon angular and radial selectivities, a wide variation is found on the fil-ters paramefil-ters [36,47,11,25]. The complexity of the masking phenomenon led many researchers to study these effects on simple sine-wave gratings. Several studies were conducted on the masking effects of oriented sine-wave gratings [18], for different spatial frequencies [24], or even on chromatic and achromatic signal masking [27]. Besides these models presenting good properties for sim-ple sine-wave gratings, several psychophysics studies have been conducted to identify the visibility of more complex and realistic signals such as quantiza-tion noise. The results have shown some important differences compared with simple signal visibility, but modeling in such a context remains difficult.
1.4 Incompatibilities between HVS properties and DCT or DWT
The major interest of DCT or DWT based watermarking techniques lies in their possible adaptation into compression standards. So, it would be very useful to predict visibility in such transform domains. Attempts have been done by Watson in order to predict the visibility of quantization noise in DCT [48] and DWT domain [43]. The main incompatibility between DWT or DCT and HVS properties is due to the orientation selectivity. Visual channels can be characterized by radial frequency bands and orientation selectivity. Depending on the radial band, the HVS orientation selectivity can be of 30 or 45 degrees. This means that 45 degree oriented signals does not interact with 135 degree oriented signals in terms of visibility since they are in different channels (remember that masking effects occurs between signals in the same visual channel). In both cases, DCT or DWT, energies of 45 degree and 135
degree signals are represented in the same component. For instance, HH bands in the DWT domain mix all the information that are neither horizontal, nor vertical. In the DCT domain, coefficient (i, i) corresponds to orientations of both 45 and 135 degrees. Due to this lack of separation, it is not possible to estimate what are the energies in the real visual bands and subsequently to determine the masking effect on visibility. The DWT provides much more trouble, interested readers can find details in [49].
1.5 Advanced HVS models in watermarking
An interesting study was conducted by Bartolini et al. [54] on perceptual masks. Here the authors built several JND masks. They used a multiple chan-nel HVS model, which was designed to predict the visibility thresholds for simple sine wave gratings. The authors tested the robustness of the water-mark against JPEG compression, circular cropping, de-speckle filtering and dithering. They claimed that the masks based on heuristic considerations pre-sented better detection results than the proposed HVS based mask. How-ever, the exploitation of such JND masks in a spatial domain watermarking technique could probably not withstand any geometrical distortions as a de-synchronization problem would inevitably occur. Furthermore, the assumption that the watermark may be assimilated to a simple signal is erroneous. There-fore, the HVS model is not adequate in this context. Delaigle et al. [17] have performed an interesting watermarking scheme exploiting visual discrimina-tion of edge and texture. In this work, the authors compute the local energy of the image by using analytic filters, and consider the watermark as masked if its energy remains below the computed energy of the mask. In fact, an im-portant key-point in this work was the use of watermarks presenting good auto-correlation properties. Besides these two ideas, the watermark location was not fully described and its spread over the spectrum was not clearly de-tailed. Their watermarking algorithm has been tested against three attacks: noise addition, JPEG compression and low-pass filtering. Podilchuk and Zeng [33] proposed an image adaptive watermarking algorithm for both the DCT and DWT domains. On one hand, the DCT domain JND masks are issued from quantization matrices established by Watson in [48]. On the other hand, JND masks applied to the DWT domain are computed from visual thresh-olds for wavelet quantization error [43]. For both embedding domains, the watermark robustness has been tested against JPEG compression, re-scaling and cropping. It is important to notice in these cases, that the tested scal-ing rates were quite small, and an interpolation was applied prior to usscal-ing the detection algorithm. Moreover, as explained before, such studies are sen-sitive to the interoperability problem between HVS properties and classical transformed spaces (DCT and DWT). Kutter and Winkler presented in [3] an original watermarking technique mixing both a vision model and the
spectrum theory. This work takes into account advanced HVS properties, such as masking effects and band-limited local contrast, but it is based on detec-tion of simple signals (sine wave gratings). The authors clearly stated that their goal was to introduce optimal weighting functions, rather than provide a full digital watermarking technique. Thus, they only tested the robustness of the scheme against JPEG compression. They discussed a few possible ex-tensions of this work in order to withstand geometrical distortions, such as using a reference watermark for spatial synchronization, or the concept of self-reference (multiple watermark embedding). While these techniques usually ensure a good invisibility versus robustness trade-off, their robustness against geometrical transforms is not well established.
Therefore, the main asset of the proposed watermarking technique is the use of an advanced HVS model. In most of the previously cited works, only a few HVS features were taken into account, whereas the proposed model is very accurate and more fully models the HVS behavior. Furthermore, we propose here an in depth evaluation of the watermarking technique both in terms of invisibility (use of objective metrics as well as subjective experiments ) and robustness (the whole set of Stirmark attacks were used).
1.6 The proposed approach
Among the usual weaknesses of HVS based watermarking techniques, one can cite:
• The HVS models use thresholds related to the detection of simple signals. Such signals are not realistic with respect to the watermark properties. • The interoperability between the HVS model and the watermark embedding
technique may not be optimal. To improve the robustness of the mark, many authors chose to embed the watermark in DCT or DWT transformed spaces, however these domains do not allow the implementation of a suitable HVS model.
In our laboratory, we have previously developed a model of quantization noise visibility with a coherent approach according to a HVS multichannel decom-position. This enables the use of a more realistic visibility model than those based on simple signals. Therefore as in [33], the work presented here uses a model of quantization noise visibility thresholds (on complex signals rather than simple sine wave gratings) to determine JND masks. These latter are evi-dently represented in the spatial domain, but the extraction technique operates in the Fourier domain in order to best withstand most attacks. Previous psy-chophysics experiments conducted in our laboratory led to define band-limited local contrast and associated optimal quantization laws with remarkable
erties. The HVS model obtained is mainly used for quality assessment or image coding purpose but has also been exploited in data hiding frameworks, such as JND mask implementation [5], and spatial watermark embedding [6]. Besides the invisibility requirement, a very important issue in the implementation of watermarking schemes is the definition of an optimal embedding space re-garding to robustness requirements. Contrary to previous schemes exploiting perceptual masks [22,54,6], an important aim of this contribution is to pro-vide a watermarking algorithm resilient to geometrical distortions. Although the spatial domain is well known to provide an important embedding capacity while still ensuring the invisibility, it presents very weak robustness features. The major interest of DCT or DWT based watermarking techniques lies in their possible adaptation into compression standards. However, such methods might not allow an efficient watermark detection after geometrical distortions as the ones introduced in the Stirmark benchmark [23,30,29]. Furthermore, as explained in section 1.4, both DCT and DWT domains present serious incom-patibilities with the use of advanced Human Visual System models. Hence, among all possible transformed spaces, we opted for a Fourier space water-marking technique as it allows good robustness properties when subject to many kinds of distortions. Furthermore, unlike most presented HVS based watermarking schemes, this work proposes a perceptual model composed of strictly defined overlapping visual sub-bands. Such a decomposition ensures that masking effects are restricted to the visual sub-band, and thus, the water-marks are completely included in the sub-bands. Our study presents several differences with the previously cited works. The first difference lies in the weighting coefficient computation, which, in our case is based on quantiza-tion noise visibility thresholds established during psychophysics experiments with several observers on complex images. Contrary to Kutter and Winkler [3] we wish to build a full watermarking scheme, and thus, to provide an effi-cient detection algorithm. Here we propose a spatial perceptual mask creation, combined with a Fourier domain detection technique able to withstand vari-ous kind of attacks, including several geometrical distortions. Finally, another important strength of the presented scheme lies in the clear definition of the perceptual sub-bands (unlike Delaigle et al. [17]), allowing a very good delimi-tation of the masking effects in the Fourier spectrum. The HVS model ensures each frequency watermark to be maintained within the visual sub-band, and the interactions with other channels are strictly avoided. An important key-point of this work lies in the use of a Fourier domain watermark embedding technique with an adapted weighting scheme using a spatial perceptual mask. The next section is devoted to a detailed presentation of the used HVS model and the quantization noise visibility threshold computation is given (equa-tion 4). The watermarking technique presented in sec(equa-tion 3 takes advantage of the HVS model’s spectral decomposition to optimize the trade-off between invisibility and robustness. This section details the theoretical watermark per-ceptual stretching to best match the perper-ceptual mask (given in a spatial
resentation). Finally, experimental data is presented to highlight the optimum watermark strength and spectral content are given and the robustness of the technique is assessed against all Stirmark attacks in section 4.
2 Human visual system model 2.1 Perceptual Channel decomposition
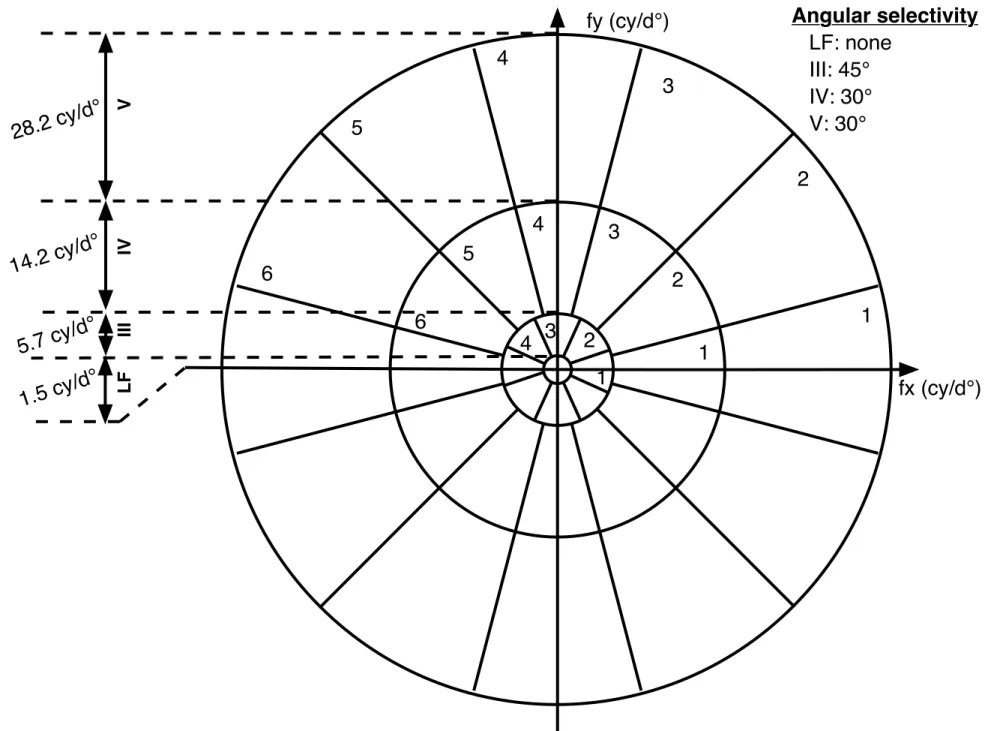
Based on psychophysics experiments conducted in our laboratory, we have derived a Perceptual Channel Decomposition (PCD). The filters of the PCD are similar to the cortex filters developed by Watson [44,47]. However, they have been adapted to the frequency splitting of Fig. 1, which is not dyadic according to radial frequencies. Moreover, in this decomposition the angular selectivity is not constant. The PCD presented in Fig. 1 uses a set of three band-pass radial frequency channels (crown III, IV , V ) each being decom-posed into angular sectors with an oriented selectivity of 45o, 30o and 30o
respectively. Channel number II has been merged with the low-pass channel (crown I), which is non-directional, and gives rise to a simple low-pass radial frequency channel (denoted here as LF). The Cortex filters used are defined as the product between Dom filters which characterize the radial selectivity and Fan filters providing the angular selectivity. Interested readers may consult [38] for more details on the filters creation.
Figure 1. Perceptual sub-band decomposition of the Fourier Spectrum.
2.2 Masking effects through quantization noise visibility
The local band limited contrast introduced by E. Peli [26] takes into account the important fact that the perception of a detail depends on its local neigh-borhood. The computation of local contrast goes through a decomposition of the image into perceptual sub-bands. This local contrast for a given (m, n) image location and i sub-band is defined as the ratio between a sub-band lu-minance and the mean lulu-minance of the channel considered (the sum of all luminances located under the considered sub-band),
Ci(m, n) =
Li(m, n)
!i−1
k=0Lk(m, n)
. (1)
Here i represents the ithradial channel and!i−1
k=0Lk(m, n) is the low frequency
signal corresponding to the ith sub-band. For the PCD presented in section
2.1, this local band limited contrast is slightly modified to take into account the angular selectivity, as follows:
Ci,j(m, n) = Li,j(m, n) !i−1 k=0 !Card(l) l=0 Lk,l(m, n) , (2)
where Li,j(m, n) and Ci,j(m, n) respectively represents the luminance and
con-trast at the (m, n) position of ith radial channel and jthangular sector. Card(l)
is the number of angular sectors in the kth radial channel. The contrast can
be rewritten as Ci,j(m, n) =
Li,j(m, n)
Li(m, n)
, (3)
where Li(m, n) is the local mean luminance at the (m, n) position (i.e. the
spatial representation of all Fourier frequencies below the considered visual sub-band). The local contrast definition is chosen to determine the allowable watermark strength. Previous studies, conducted on the perceptual decompo-sition given in Fig. 1, determined invisible quantization conditions [39]. In this study, each perceptual sub-band went through a quantization process and the image overall quality was assessed by a set of observers. The optimal quanti-zation step (∆C) has been introduced in order to provide the maximum quan-tization step, which does not visually affect the image. From psychophysics experiments [39], this optimal quantization step ∆Ci,j, is given by
∆Ci,j = Ei,j L0 " ∆fi f0,i #λi,j , (4)
where Ei,j is the (i, j) power of the sub-band, L0 is the screen luminance, ∆fi
is the ith radial bandwidth, f
0,i is the central frequency of sub-band i, and λi,j
is a constant depending on sub-band (i, j). The λi,j values for each crown are
given in the Table 1.
Crown III IV V
λi,j -1.52 0.094 -0.28
Table 1
Parameters for intra channel masking for each DPC crown [39].
2.3 Perceptual mask
As seen in the previous section, we are able to define the visibility of quan-tization noise of visual channel content for complex signals. We will now ex-ploit this property in a watermarking context for the strength determination process. Since this model operates in a pyschovisual space, we must transform digital images into luminance. This very important statement, which has never been taken into consideration in any watermarking algorithm, implies that a watermark might be invisible on a specific screen but would present quite annoying artifacts while viewed on another monitor. An ideal perceptual wa-termark should not only be image-dependent, but also display-dependent. It is important to notice here that the luminance is related to the light inten-sity physically emitted by the display, i.e. it strongly depends on the monitor properties. The identification of the monitor ”gamma function” was performed using a spectro-photometer. This ”Gamma function” is usually used to trans-form the digital grey level image values into the photometric quantity known as luminance. We saw in section 2.1 that the Perceptual Channel Decompo-sition may be used to extract any visual sub-band. The watermark can be embedded in any of the so obtained sub-bands. The proposed masking effect model suggests that we can control the visibility at each spatial site of each sub-band. So the most adequate sites of the image can be easily defined by extracting one (or several) spectrum sub-band(s), this selection may be con-tent based, i.e., one could select for each crown, the sub-band with the largest energy. Derived from (3), the maximum variation ∆Li,j(m, n) (maximum
wa-termark strength) allowable for each (i, j) sub-band and for each (m, n) pixel position without providing visible artifacts is given by
∆Li,j(m, n) = ∆Ci,j × Li(m, n) . (5)
These ∆Li,j(m, n) indeed represent the JND mask computed for each (i, j)
sub-band. In the following, the watermark will be assimilated to quantization noise. According to (5), it clearly appears that the maximum variation depends on both the local mean luminance Li,j(m, n), and the optimal quantization
step value ∆Ci,j. It is important to notice that, for each orientation of a
particular crown, the local mean luminance is the same (represented by all the lowest frequencies). This means that the only difference between two masks provided by two sectors of the same crown will come from the ∆Ci,j value of
this particular crown. It is also interesting to note that for the seven images tested, within a frequency crown the computed ∆Ci,j values for each sub-band
showed only a weak variation.
3 Watermarking process
In [5], we have already exploited this HVS model for a JND mask creation technique. The JND mask obtained has been tested in different spaces (DCT, DWT and spatial embedding). According to the results obtained the mask im-plementation steps have been slightly modified [6]. The perceptual mask was first created according to the content of three visual sub-bands (e.g. (III,1) (IV,2) (V,4)) and located in the image edges. Detection reliability tests showed a higher watermark robustness in the uniform areas rather than on the image edges. Although a watermark embedded in the uniform areas offers a very good robustness, the use of a powerful HVS model is crucial as the modifica-tions in such regions are very easily perceptible. The use of the HVS model in these studies ensured the watermark invisibility for every context and op-timized the robustness against many attacks. These techniques, operating a spatial domain extraction process, showed very interesting robustness proper-ties against several distortions. However, theses methods suffered from weak robustness results against most geometrical attacks. Due to its well-known adaptation to the HVS behavior, the Fourier domain presents interesting fea-tures for image watermarking techniques. We present in the next section a watermarking technique developed in the Fourier domain, which also takes into account a perceptual mask.
3.1 JND adaptive watermark
Once the detailed HVS model is implemented and the sub-band dependent JND mask has been obtained, the watermark embedding technique itself is rather simple; The watermark is weighted to best fit within the perceptual mask. As explained above (section 2.3), the perceptual mask obtained is spa-tially defined, which means it provides a maximum variation of luminance for each site. As previously emphasized, for the robustness requirements, the watermark embedding and extraction should be performed in the frequency domain. Thus, regarding the detection process, this will reduce the watermark to a small frequency patch, instead of its spatial representation, spread over the whole image. A frequency watermark is created and modulated onto carrier frequencies within a perceptual sub-band, its spatial representation is com-puted and compared to the spatial perceptual mask, the smallest difference between these two images provides the weighting coefficient. The watermark is then weighted by this weighting parameter and finally embedded into the original data. Due to the Fourier transform linearity property, the perceptual weighting coefficient can be applied either in the frequency or spatial domain. In the algorithm presented, the watermark is a square shaped zero-mean
sian random variable. The perceptual weighting coefficient Ki,j is given by Ki,j = argminm,n ! |∆Li,j(m, n) WS(m, n) | " , (6)
where ∆Li,j(m, n) represents the previously defined visual mask and WS(m, n)
depicts the spatial representation of the watermark.
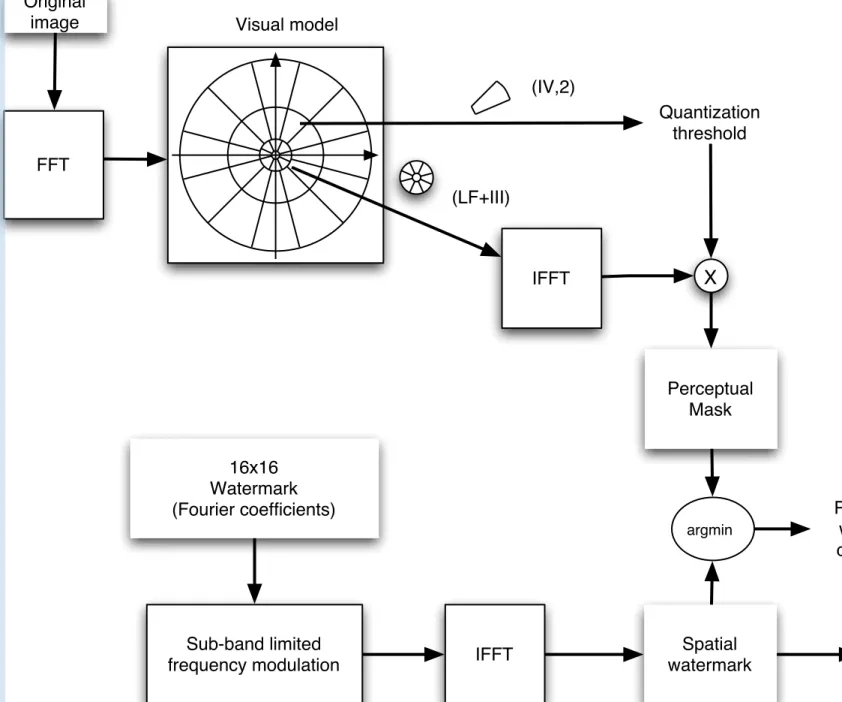
Figure 2. Weighted watermark computation.
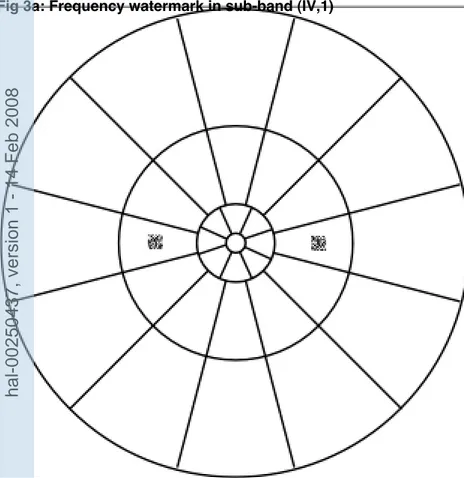
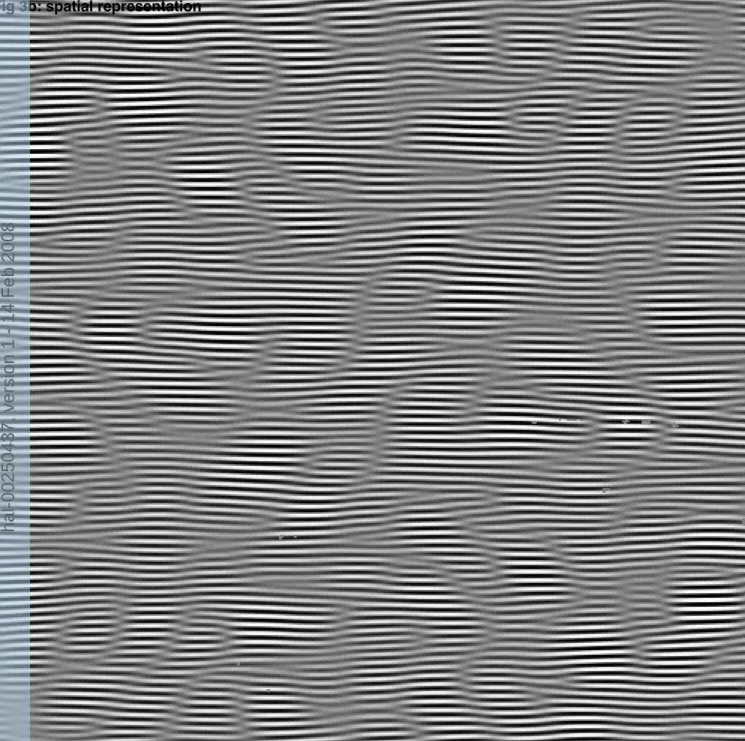
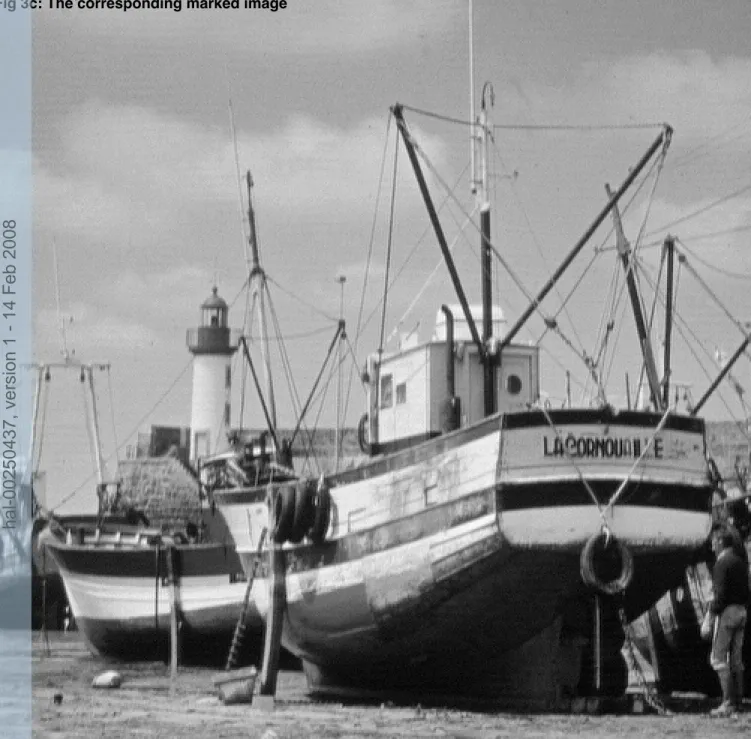
Figure 2 shows the different steps of the weighted watermark computation. The upper branch in Fig. 2 represents the mask creation steps. The Fourier transform of the original image is first computed, and the Perceptual Channel Decomposition is applied on the spectrum obtained. The perceptual mask is then obtained from (5), and the perceptual weighting coefficient computed according to (6). The watermark is finally weighted with this coefficient before being embedded into the image (lower branch in Fig. 2). It is important to notice that to avoid phase reversals, only the real part of the spectrum is modified, while the imaginary part is kept unchanged. Evidently, to respect the symmetry of the spectrum, the symmetry of the watermark is required, as shown in Fig. 3a. Once weighted, the resulting watermark is finally added to the original image. This addition may be performed either spatially into the image or, after a Fourier transform, into the original spectrum coefficients. Figure 3 shows an example of a frequency watermark modulated onto car-rier frequencies placed in the middle of a visual sub-band (represented by the two square noise patterns, superimposed on the PCD in Fig. 3a), the corre-sponding spatial watermark representation (Fig. 3b) and the resulting marked image (Fig. 3c). Here, the watermark is designed as a square patch of random variables (16× 16 coefficients), located in the visual sub-band (IV,1) (see Fig. 1).
3.2 Detection process
For each tested image, the cross-correlation was computed between the stored original watermark and the portion of the image spectrum supposedly con-taining the mark. The only data required during the retrieval procedure is the original frequency watermark, and the carrier frequencies where the mark is embedded (2-D coordinates). The previously computed weighting coefficient
(a) Frequency watermark
(b) Spatial watermark
(c) Marked image
Figure 3. (a) Frequency watermark in sub-band (IV,1), (b) spatial representation of the frequency watermark. (c) The corresponding marked image.
could also be stored along with the watermark frequency values in order to allow a watermark extraction, providing a reversible watermarking scheme. The cross-correlation function between two data sets x and y is given by r(d) in (7), where x and y represents the sequences’ mean value.
r(d) = ! i[(xi− x) ∗ (yi−d− y)] " ! i(xi− x)2 " ! i(yi−d− y)2 . (7)
The most intuitive behavior we could expect from such technique would be to obtain good detection features for soft geometrical distortions, but this scheme might not present very competitive detection rates for stronger geometrical at-tacks. However, it is important to notice that this technique might present very interesting detection features after an approximative geometrical distortion compensation. The detection process was reinforced by combining the one-dimensional cross-correlation function with a two-one-dimensional version, very useful for a re-synchronization process. The two-dimensional cross-correlation function between x and y is given according to the Fourier theorem by
x !y = F−1#X(ν)· Y (ν)$, (8)
where ! is the correlation operator, X(ν) and Y (ν) respectively represent the Fourier spectrums of x and y, and X is X’s complex conjugate, F−1 represents
the inverse Fourier transform. The main advantage of such correlation is to assist in locating a correlation peak shift in two dimensions. This peak shift
information may be very useful to compensate a possible geometrical distor-tion. Effectively, by comparing the new location of the correlation peak to the original location of the watermark (the stored frequency carrier), we can easily determine the possible distortions the image underwent. Evidently most corre-lation based detection techniques must include a detection threshold selection process [51,52,53]. The next section presents a study of the false alarm and missed detection rate in order to select the optimal detection threshold for the proposed watermarking algorithm.
4 Results
This section is devoted to the evaluation of the watermarking algorithm pre-sented. Both invisibility and robustness are assessed. The invisibility is as-sessed by objective quality metrics as well as subjective experiments. The robustness of the technique is evaluated against 89 Stirmark attacks. Further-more, the false alarm rates are accounted for and an appropriate detection threshold is measured for two distinct watermark sizes.
4.1 Preliminary tests
4.1.1 Impact of mark size and frequency band on robustness
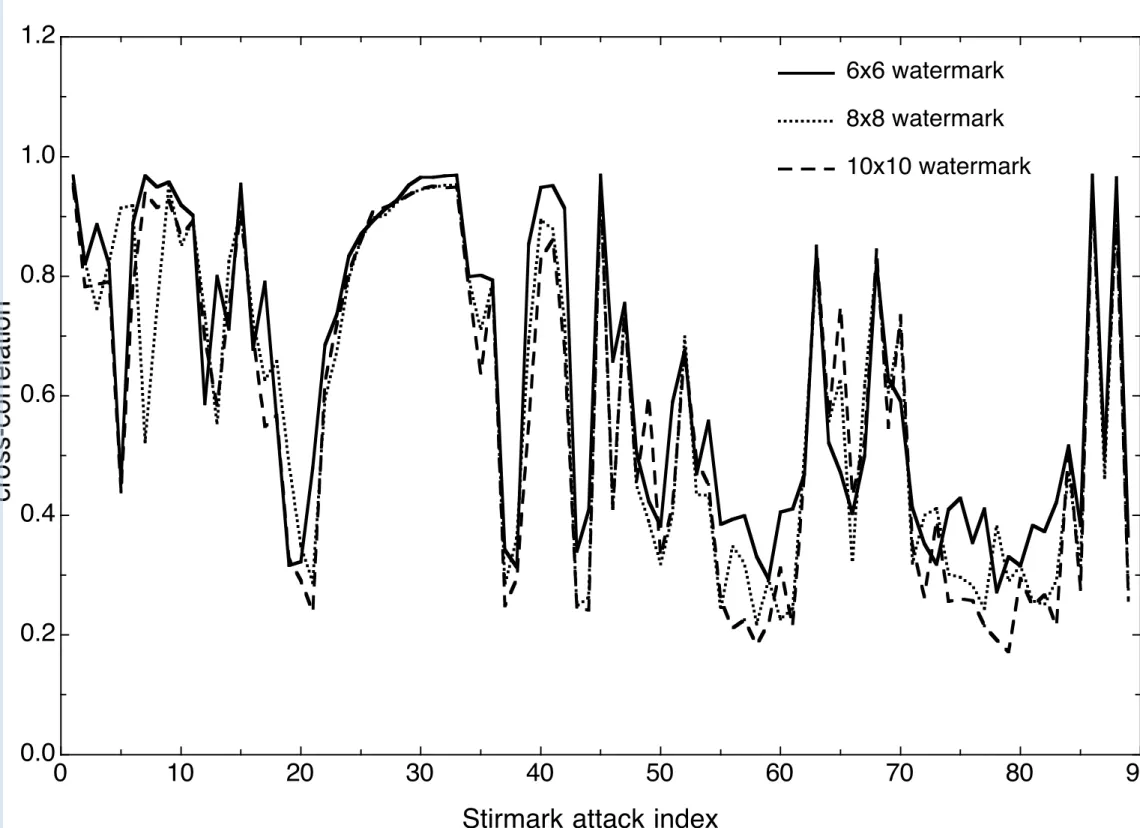
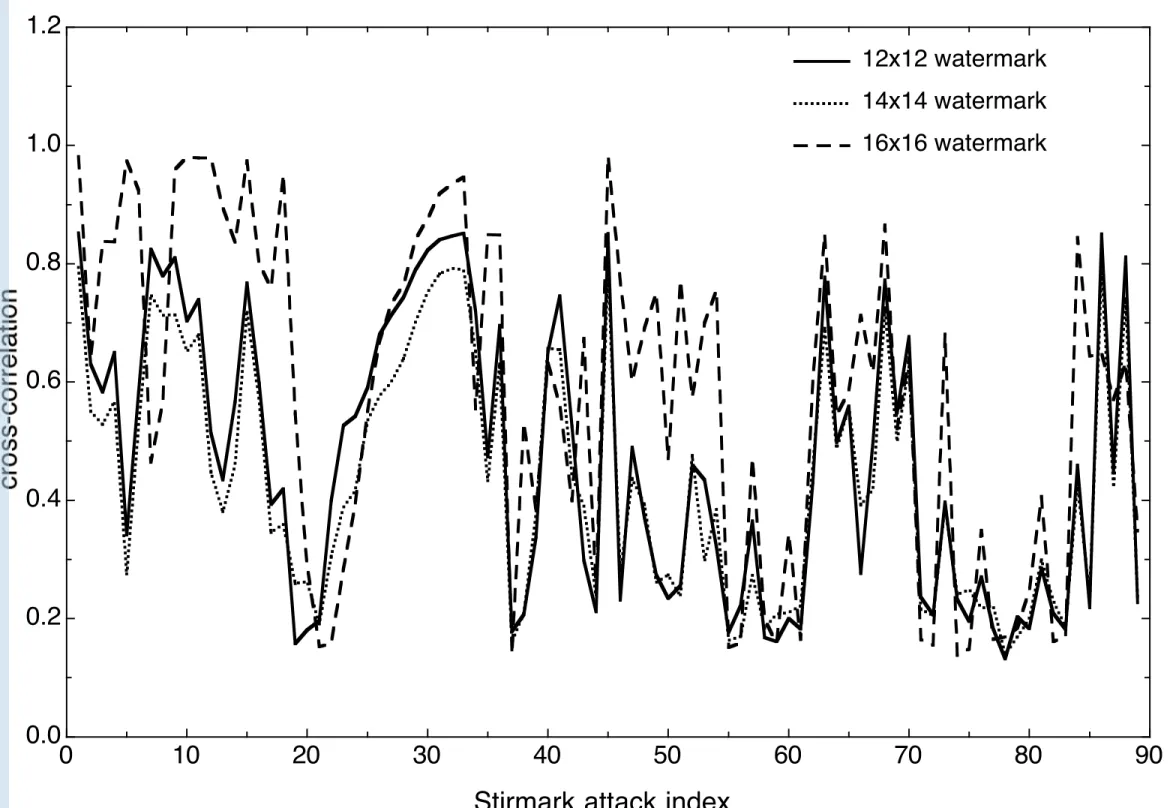
In order to optimize the data detection, several watermark sizes have been tested. The detection reliability is closely related to the watermark size. Wa-termarks that are too small usually cause important false detection results and the reliability increases with the watermark size. We tested the watermarking detection reliability for the boats image under all Stirmark attacks for six dif-ferent watermark sizes. Square shaped watermarks of size: 6×6, 8×8, 10×10, 12× 12, 14 × 14 and 16 × 16 were independently embedded into the image spectrum (horizontal middle frequency range as depicted in Fig. 3a), Stirmark distortions were applied and the detection process was performed. Figure 4 shows the cross-correlation results (Y-axis) according to all Stirmark attacks (X-axis). Note that the Y-axis in Figure 4 represent the peak cross-correlation value for the considered attack. In order to ensure a reasonable watermark capacity, we discarded the size 6× 6. Both 8 × 8 and 10 × 10 watermarks proved be good candidates for all three requirements (invisibility, robustness and capacity). We thus selected the 8×8 watermarks for further experimenta-tion, and chose to discard the size 10× 10, since its detection curves are very similar. It clearly appears on Figure 4 that the watermarks of size 12× 12 and 14× 14 present overall lower cross-correlation peaks. It is however interesting to notice that although the correlation peaks are smaller regarding to some
specific attacks (mostly for cropping and rotation), the lower part of the plots remain similar for the tested watermarks size. This means that depending on the chosen detection thresholds inherent to each watermark size, the global detection rates could approximately remain comparable. Furthermore, in or-der to investigate the effects of an optimal watermark capacity, we decided to discard the 12× 12 and 14 × 14 watermarks and to keep the 16 × 16 water-marks for further experiments. Thus, in the next few steps of the watermarking algorithm, we opted for watermarks of size 8× 8 and 16 × 16.
(a) watermarks of size 6x6 to 10x10
(b) watermarks of size 12x12 to 16x16
Figure 4. Watermark size optimization. Detection peaks for different watermarks in the boats image distorted by all Stirmark attacks.
4.1.2 Where to embed?
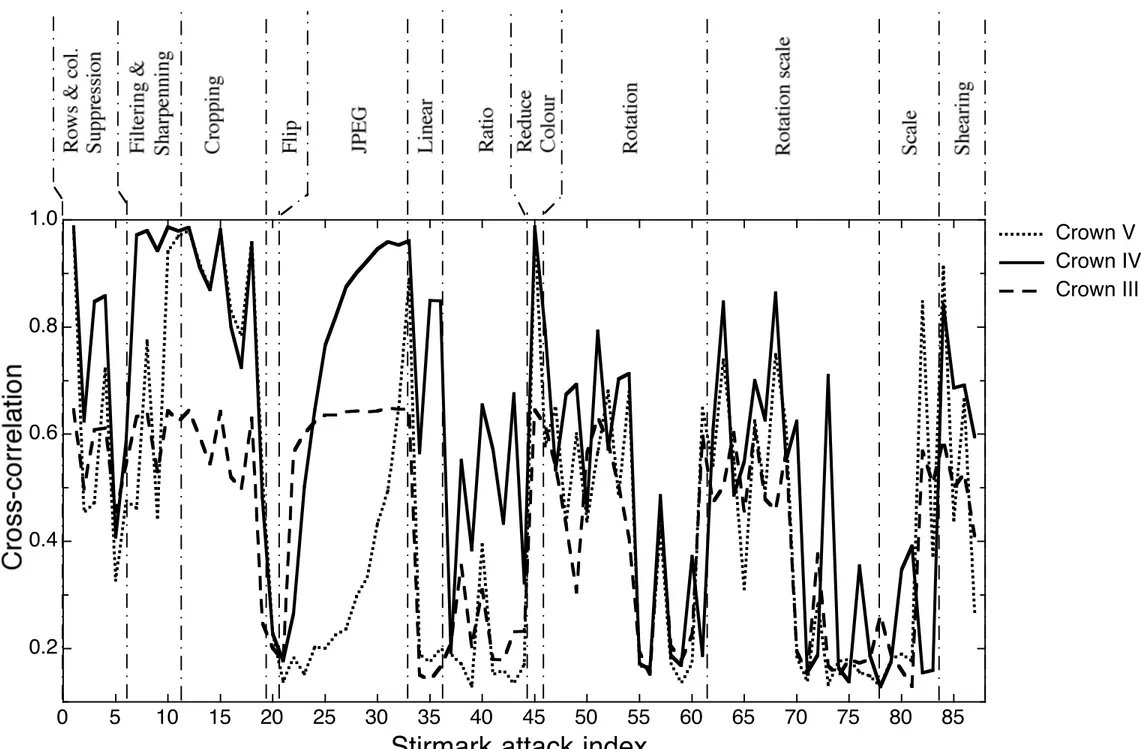
With the watermark size defined, we tested the behavior of the scheme for various frequency ranges, i.e. a 16× 16 watermark was respectively embedded in the PCD crowns labeled III, IV and V (Fig. 1) and its robustness was tested for each sub-band. Figure 5 shows the normalized cross-correlation coefficient obtained for each of the 89 Stirmark attacks [23], [30], [29] (see Table 3 for the list of Stirmark attacks along with the corresponding index). Cross-correlation of all Stirmark output images were sorted in alphabetical order. Associations between the distortion name and the corresponding attack index (X-axis) are given at the top of Fig. 5. These associations are more precisely detailed in Table 3.
Figure 5. Cross-correlation coefficient for the barbara image against the 89 Stirmark attacks when the III (dashed line), IV (solid line) and V(dotted line) PCD crown are respectively marked.
Figure 5 clearly shows the best detection results for mid-frequency range
efficients (results for crown IV are represented by the solid line). This figure confirms a possible weakness of the method against strong geometrical distor-tions. As explained in section 2, the local mean luminance is the same for all sectors of a specific crown (denominator in (2)), the only difference between the JND masks issued from a single crown will come from the quantization steps (Table 1), which usually present weak variations. Hence, from now on, the chosen embedding crown is (IV, 1). Evidently, one can choose to embed multiple watermarks, either in the same crown or a range of crowns. Based on this embedding technique, multiple watermark embedding have recently been proposed in an objective quality assessment metric [40].
4.1.3 Detection Threshold
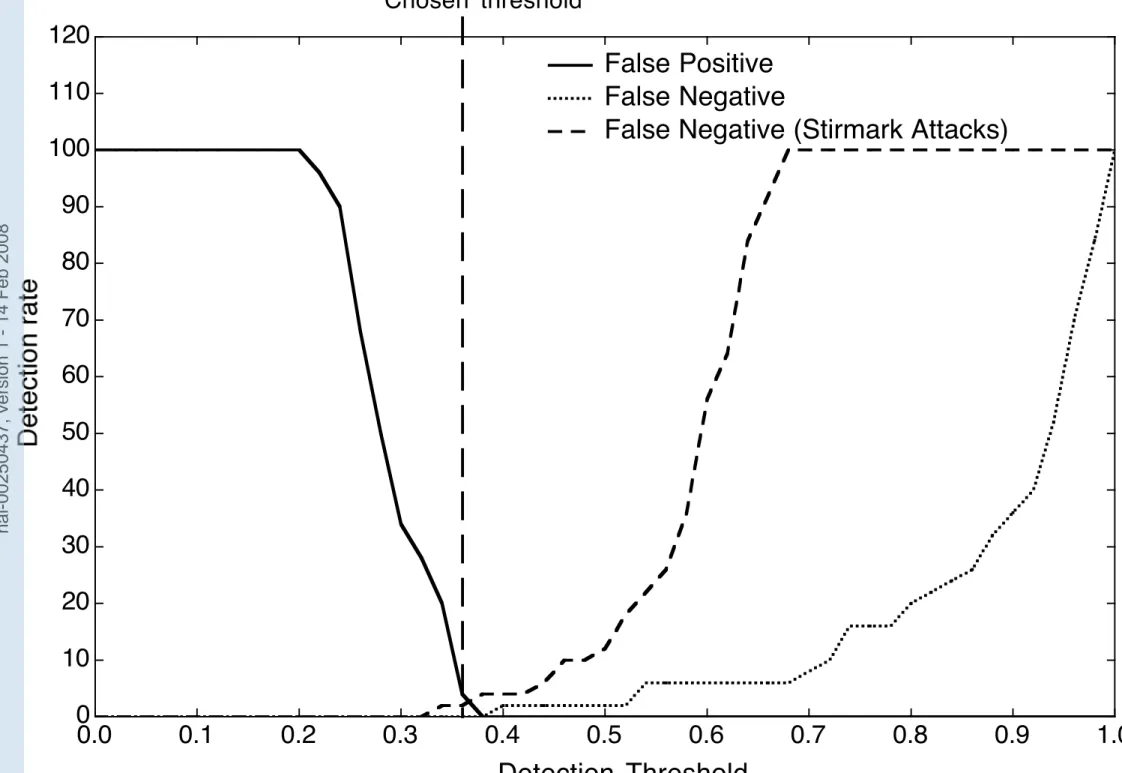
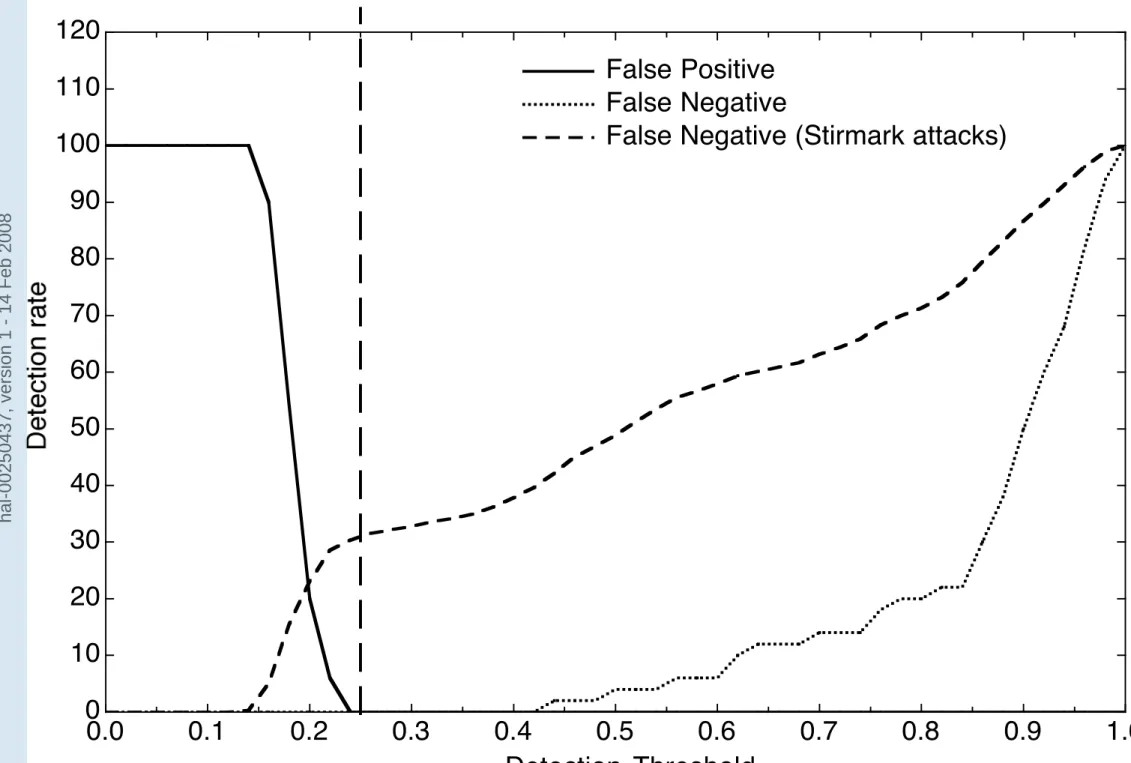
Once again, it is important to note here that our main goal is to provide the best detection correlation for a HVS model based watermarking scheme that resists geometrical distortions, thus, before performing detection tests on the Stirmark benchmark, a detection threshold must be defined. We also tested the robustness of the watermark with respect to false alarms. The detection process was tested for six hundred different watermarks applied to an un-marked image, the normalized cross correlation was computed for every trial. This process was repeated for three images. For the image lena degraded by a one degree rotation, the 600 cross correlations coefficients are plotted in Fig. 6.
Figure 6. Detector response. Only one matching watermark was found at position 200 (image “lena”, 1 degree rotation.
(a) 8x8 watermarks
(b) 16x16 watermarks
Figure 7. False Alarm and Missed detection rate for two watermark sizes.
The choice of the optimal detection threshold was obtained by computing the
false alarm and missed detection rate on one hundred images (Stirmark at-tacks were used). The false positive and false negative rates are given in Fig. 7 for both the 8× 8 and 16 × 16 watermarks (left and right panels respectively). According to the results in this figure we opted for a detection threshold of 0.25 for the 8 × 8 watermarks and 0.35 for the 16 × 16 watermarks (rep-resented by the dashed vertical lines). These thresholds allow minimization of false positives, while granting a very weak false negative rate. We deliber-ately chose here to avoid false positives, in order to ensure that no watermark would ever be detected in unmarked images. It is however important to no-tice that in figure 7(b), the chosen detection threshold (0.25) leads to a thirty percent false negative when the Stirmark attacks are taken into account. One could evidently have chosen a 0.2 detection threshold, optimizing both false positives and false negatives, this would allow a weaker false negative (about twenty percent) and thus induce a better overall detection rate. As described in the following section, the chosen thresholds shows very interesting detection performances when considering the full set of Stirmark attacks.
4.1.4 Visibility
Although the watermark is stretched into a perceptual mask exploiting ad-vanced HVS properties, we nevertheless chose to ensure the invisibility of the mark.
Figure 8. Objective quality assessment measures for fifty watermarked images, Carnec metric [31] and SSIM [32].
Thus, we used both subjective experiments and objective metrics to ensure the watermark invisibility. Ideally, for watermarking purpose, we need an objective metric that is able to detect if the watermark is visible or not. At this time such a tool doesn’t exist, on the other hand there are many studies dealing with image quality assessment metrics. Most objective quality metrics are actually fidelity metrics since they compare the similarity between a reference image and a distorted one. We chose to use such metrics as an objective metric for visibility purposes, making the assumption that similarity between original image and watermarked image is linked with watermark visibility. We use two objective quality metrics suited for still images: Carnec metric [31] and SSIM [32]. These two metrics are known to provide quality scores well correlated with human judgments, moreover the software can be found on the Internet. Figure 8 represents the quality measures given by two objective metrics on fifty marked images and for three watermarking algorithms (besides the presented technique) [14,13,20]. For both quality metrics, quality measures are obtained comparing the watermarked image to the original one, if the two images are perceptually close the quality score approaches unity while it decreases towards zero if too many differences are visible. According to Fig. 8, the proposed watermarking technique shows very interesting invisibility results: regardless of which quality metric is used, the quality scores are rather high (mostly greater than 0.95). Moreover, the method generally obtains a higher score when compared to usual perceptual watermarking methods found in the literature. In other words, taking these results with caution, we can conclude that the watermark is less visible with the proposed method.
Figure 9. Subjective quality assessment for the set of fifty images.
Besides the objective quality measurements, subjective quality experiments have been performed. During these experiments, we presented several mod-ified images using the two alternative forced choice procedure with one pre-sentation. This procedure is very useful in psychophysics in order to track for instance visibility thresholds. We adapted this procedure for watermarking vis-ibility purpose. During a session, in each trial we present the reference image, a copy of this one and a modified version. This latter was randomly present in one of two positions A or B and the observer was required to identify the positions where it has occurred. This kind of test is commonly used since it gives the best precision for the thresholds, however, it is quite long and diffi-cult for observers. We used several types of distortions (not only watermarked images) including obvious perceptual distortions, this made the task less frus-trating for observers. Some of the distortions were watermarked images using the proposed method with different strengths. Since, observers had to provide
an answer at each trial, one can say that a good detection probability of 0.5 means that the observer answered randomly. Usually, visibility threshold is measured for a probability of good detection of 0.75, so we set this same value to get the strength at the mark visibility threshold. Points on Fig. 9 represent a good detection rate for 8 observers with the “boats” image according to dif-ferent watermark strengths (on the X-axis). After fitting with a psychometric function we can estimate the optimal watermark strength obtained leading to a 75% detection rate. Measured optimal strengths for three distinct images used in the tests are given in Table 2, all the values are close to the strength provided by the HVS mask (i.e. 100%).
boats goldhill peppers
Strength 96% 133% 97%
Table 2
Optimal strengths according to subjective experiments.
4.2 Detection results
The one-dimensional cross-correlation was computed for seven images, and for all Stirmark attacks. Four cross-correlation plots are given in Fig. 10. In these figures, the horizontal axis represents the shift parameter, d in (7), whereas the vertical axis is the cross-correlation value, r(d). The dashed lines on Fig. 10 represent the detection threshold that has been set to 0.25. As the cross-correlation function is given on the interval [−1, 1], the negative value of the threshold is also represented. Figures 10 and 11 respectively show the one-dimensional and two-dimensional cross-correlation graphs when the im-age underwent a ratio (x=1.0, y=1.2 ) (Fig. 10a and 11a), a 10% cropping (Fig. 10b and 11b), a 2 degree rotation (Fig. 10c and 11c), and finally when 5 rows and 1 column have been removed (Fig. 10d and 11d). As theoretically expected from the data retrieval technique, although the detection threshold always allows a successful retrieval (in Fig. 10), the presented watermarking scheme exhibited a weaker robustness against geometrical distortions.
For such distortions, operating a mark de-synchronization, on the 2D corre-lation plots (Fig. 11d), the correcorre-lation peaks clearly moved compared to the watermark carrier (supposedly placed at the center of the map). It is impor-tant to notice that Figures 10 and 11 are simply provided here in the aim to present typical cross-correlation plots, however, the maximum values given in these plots are also represented in Figures 12 and 13 for different images and for all the Stirmark attacks. Effectively, the cross-correlation peak values for the full set of Stirmark attacks (89 attacks) are given in Fig. 12 for the 7 tested images. The readers may refer to Fig. 5 or Table 3 for more details on the attacks index (x axis in Fig. 12). We can easily observe that with the
(a) Ratio (1.0 1.2)
(b) Cropping 10
(c) 2 degrees rotation
(d) 5 rows, 1 col removed
Figure 10. 1D cross-correlation results.
previously defined detection threshold (set to 0.25, represented by the dashed lines), the watermark is still detected for most of the Stirmark attacks, includ-ing the majority of geometrical distortions. As expected from the detection process, the watermark is usually detected as long as the distortion keeps at least a part of the 16×16 noise like sequence within the 16×16 checked Fourier coefficients. Considering the 623 tested images (7 test images and 89 attacks), for an 8× 8 watermark, the mean detection rate is found to be about 70% with a detection threshold set to T=0.35, it reaches 79% with a threshold set to 0.25 for a 16×16 watermark (see Table 4). Tables 4 and 5 give, for different thresholds, the percentage of detected watermarks for each input images after the 89 Stirmark distortions. The overall percentage is given in the rightmost column for all seven images.
More detailed detection rates are given in Table 4 for the 8× 8 watermarks and in Table 5 for the 16× 16 watermarks, which shows both the number of detected watermarks for the 89 attacked images (lines 1, 3 and 5), and the corresponding detection rate (lines 2, 4 and 6). The last column gives the total number of detected watermarks along with the appropriate rate for the 623 tested images. During the detection process, attacked images have to be scaled to the resolution of the original image, in order to search the same frequency range, zero padding is usually performed for cropped versions. Note that using
(a) Ratio (1.0 1.2)
(b) Cropping 10
(c) 2 degrees rotation
(d) 5 rows, 1 col removed
Figure 11. 2D cross-correlation results.
an interpolation technique may improve the detection results. The storage of the carrier frequencies as a percentage of the spectrum size could also be used to perform the detection process, and would in fact avoid the zero padding technique. However, this might not sensibly increase the overall detection rate. The proposed technique has been compared to three well known watermarking algorithms [14,13,20] (the source code distributed by P. Meerwald was used [12]). Figure 13 shows the detection results for the three algorithms on the lena image. The rightmost part of Fig. 13 shows the detection rate of the three techniques for four detection thresholds (0.4, 0.3, 0.25 and 0.20 ).
This figure clearly shows the best detection results against JPEG compression for the Cox, Zhu and Fridrich techniques compared to the one we propose here. However, our technique achieves the best results against geometrical distortions, and a better overall detection rate.
1 marked image 24 JPEG 20 47 rotation -0.50 70 rot scale 1.0 2 17row 5col rem 25 JPEG 25 48 rotation -0.75 71 rot scale 10.0 3 1row 1col rem 26 JPEG 30 49 rotation -1.0 72 rot scale 15.0 4 1row 5col rem 27 JPEG 35 50 rotation -2.0 73 rot scale 2.0 5 5row 17col rem 28 JPEG 40 51 rotation 0.25 74 rot scale 30.0 6 5row 1col rem 29 JPEG 50 52 rotation 0.5 75 rot scale 45.0 7 4x4 med filter 30 JPEG 60 53 rotation 0.75 76 rot scale 5.0 8 3x3 med filter 31 JPEG 70 54 rotation 1.0 77 rot scale 90.0 9 2x2 med filter 32 JPEG 80 55 rotation 10.0 78 scale 0.50 10 Gauss filt 3x3 33 JPEG 90 56 rotation 15.0 79 scale 0.75 11 Sharp 3x3 34 linear filt 1 57 rotation 2.0 80 scale 0.9 12 cropping 1 35 linear filt 2 58 rotation 30.0 81 scale 1.1 13 cropping 10 36 linear filt 3 59 rotation 45.0 82 scale 1.5 14 cropping 15 37 ratio (0.8 1.0) 60 rotation 5.0 83 scale 2.0 15 cropping 2 38 ratio (0.9 1.0) 61 rotation 90.0 84 shear (0.0 1.0) 16 cropping 20 39 ratio (1.0 0.8) 62 rot scale -0.25 85 shear (0.0 5.0) 17 cropping 25 40 ratio (1.0 0.9) 63 rot scale -0.50 86 shear (1.0 0.0) 18 cropping 5 41 ratio (1.0 1.1) 64 rot scale -0.75 87 shear (1.0 1.0) 19 cropping 50 42 ratio (1.0 1.2) 65 rot scale -1.0 88 shear (5.0 0.0) 20 cropping 75 43 ratio (1.1 1.0) 66 rot scale -2.0 89 shear (5.0 5.0) 21 flip 44 ratio (1.2 1.0) 67 rot scale 0.25
22 JPEG 10 45 reduce color 68 rot scale 0.50 23 JPEG 15 46 rotation -0.25 69 rot scale -0.75 Table 3
List of Stirmark attacks along with the corresponding index.
5 Conclusions
This work presents a new watermarking technique for copyright protection using an advanced HVS model. The perceptual model used ensures the best invisibility capacity and robustness trade-off. Contrary to most perceptual Just Noticeable Difference masks, the visibility thresholds used in this study are computed for complex signals rather than for simple gratings. The HVS model provides a spatially defined JND mask, which gives the appropriate
(a) barbara image
(b) boats image
(c) goldhill image
(d) lake image
(e) lena image
(f) peppers image
(g) plane image
Figure 12. Cross-correlation coefficient for the 89 Stirmark attacks for 7 test images.
weighting coefficient for a given watermark whose optimal size has been as-sessed. The weighted watermark is finally embedded into the image, and the detection process takes place in the Fourier domain. The watermark, a square pseudo-random sequence, is embedded on Fourier domain coefficients and its
Threshold barbara boats goldhill lake lena peppers plane TOTAL 0.4 66 67 62 63 66 55 62 63 % 0.35 72 71 67 74 70 64 70 70 % 0.3 83 81 89 87 82 74 79 82 % 0.25 97 93 97 97 93 94 94 95 % Table 4
Detection percentage against Stirmark attacks (8x8 watermark).
Threshold barbara boats goldhill lake lena peppers plane TOTAL
0.4 73 70 74 71 67 60 74 70 %
0.35 78 73 79 74 73 62 78 74 %
0.3 80 76 82 80 74 67 79 77 %
0.25 81 79 82 80 79 69 81 79 %
Table 5
Detection percentage against Stirmark attacks (16x16 watermark).
(a) Comparison with Cox
(b) Comparison with zhu
(c) Comparison with Fridrich
Figure 13. Comparison of the proposed technique with Cox [14] , Zhu [13] and Fridrich [19].
amplitude is stretched to best match the spatially defined perceptual mask. The detection process performs a normalized cross correlation function be-tween the marked (and possibly attacked) part of the Fourier spectrum and the original weighted watermark. This detection process provided very good robustness results for a large set of attacks, including soft geometric
tions. However, for stronger geometrical attacks, the detection process showed weaker results. In fact, the presented detection scheme is able to detect the mark as long as a geometric distortion keeps a small part of the watermark in its original location, i.e. as long as the new watermark location (after being attacked) overlaps its original position in the frequency domain. The main drawback such attacks would induce is a mark de-synchronization problem : the detection process only looks for the mark at selected carrier frequencies and may not be able to detect the watermark when moved far away from the carrier. The detector scheme was tested on the 89 distorted versions of 7 test images, the obtained overall detection rate was about 79% for a de-tection threshold set to 0.25. Furthermore, the 2D-cross-correlation dede-tection was able to detect the degradation type, and future works will be devoted to compensate such distortions before using the detection process. Evidently, for several Stirmark attacks the presented detection process is not able to detect the mark, but usually, these distortions severely degrade the image quality or semantic content (rotations greater than 10 degrees, important scaling, 10 to 15 percent JPEG quality compression). Such attacks modify the images so severely that the images obtained don’t represent any commercial interest.
Acknowledgements
This work was supported by the French TSAR project funded by the National Research Agency (ANR). The authors thank the anonymous reviewers for their helpful comments, which have improved the quality of this paper. We also want to thank A. Tirel and E. Marini for their valuable input running the subjective experiments, as well as A. Kingston and P. Campisi for interesting discussions concerning this work.
References
[1] A. Z. Tirkel, G. A. Rankin, R. van Schyndel, W. J. Ho, N. Mee, C. F. Osborne, Electronic Watermark, Digital Image Computing, Technology and Applications, Sydney Australia, 1993, pp. 666-672.
[2] F. Hartung, J. K. Su, B. Girod, Spread Spectrum Watermarking: Malicious Attacks and Counterattacks, in Security and Watermarking of Multimedia Contents, Proc. SPIE 3657, pp. 147-158, Jan. 1999.
[3] M. Kutter, S. Winkler, A vision-based masking model for spread-spectrum image watermarking, IEEE Transactions on Image Processing, vol. 11, no.1, pp. 16-25, January 2002
[4] F. Autrusseau, JP. Gu´edon, Image Watermarking in the Fourier Domain Using the Mojette Transform. Santorini Greece 14th IEEE International Conference on Digital Signal Processing (DSP2002), vol. II, pp. 725-728, July 2002. [5] F. Autrusseau, A. Saadane, D. Barba. Psychovisual selection of auspicious sites
for watermarking. SPIE PICS, pages 326–329, 2000.
[6] F. Autrusseau, A. Saadane, D. Barba. A psychovisual approach for watermarking. SPIE Electronic Imaging, 4314(41), pages : 378–386, 2001. [7] W. Bender, D. Gruhl, N. Morimoto, A. Lu. Techniques for data hiding. IBM
systems journal, 35(3/4), pages : 313–336, 1996.
[8] G.W. Braudaway, Protecting publicly-available images with an invisible image watermark. Proceedings of the International Conference on Image Processing, 1, pages : 524–527, 1997.
[9] P. Le Callet, D. Barba A robust quality metric for color image quality assessment. Int. Cont. on Image Proc. 2003, (1) pp. 437-440.
[10] F.W. Campbell, J.G. Robson. Application of fourier analysis to the visibility of gratings. Journal of Physiology, 197, pages : 551–566, 1968.
[11] S. Comes, B. Macq. Human visual quality criterion. Proceedings of the SPIE, Visual Communications and Image Processing, 1360, pages : 2–13, 1990. [12] P. Meerwald, S. Pereira, Attacks, applications and evaluation of known
watermarking algorithms with Checkmark, SPIE Electronic Imaging, (4675), 2002.
[13] W. Zhu, Z. Xiong, Y.Q. Zhang, Multiresolution watermarking for images and video: a unified approach, IEEE International Conference on Image Processing, 1998.
[14] I. J. Cox, J. Kilian, T. Shamoon. Secure spread spectrum watermarking for multimedia. IEEE Transactions on Image Processing, 6(12), pages : 1673–1687, 1997.
[15] I. J. Cox, J. Kilian, T. Leighton, T. Shamoon. Secure spread spectrum watermarking for images, audio and video. Proceedings of the International Conference on Image Processing, pages 243–246, 1996.
[16] I. J. Cox, M. L. Miller The First 50 Years of Electronic Watermarking. EURASIP Journal of Applied Signal Processing, 2, 126-132, 2002.Ingemar J. Cox and Matt L. Miller
[17] J.F. Delaigle, C. De Vleeschouwer, B. Macq. Watermarking algorithm based on a human visual model. Signal Processing, 66, pages : 319–335, 1998.
[18] J. M. Foley. Human luminance pattern mechanisms : Masking experiments require a new model. Journal of the Optical Soc. of America, 11(6), pages : 1710–1719, 1994.
[19] J. Fridrich. Applications of data hiding in digital images. In Tutorial for the ISSPA’99 Conference, pages 22–25, Brisbane, Australia, August 1999.
[20] J. Fridrich. Combining low-frequency and spread spectrum watermarking. In Proceedings of the SPIE Symposium on Optical Science, Engineering and Instrumentation, San Diego, USA, July 1998.
[21] D. J. Heeger. Normalisation of cells responses in cat striates cortex. Visual Neuroscience, 9, pages : 181–198, 1992.
[22] M. S. Kankanhalli, Rajmohan, K. R. Ramakrishnan. Content based watermarking of images. ACM Multimedia - Electronic Proceedings, 1998. [23] M. Kutter, F. A. P. Petitcolas. A fair benchmark for image watermarking
systems. Electronic Imaging’99, Security ans Watermarking of Multimedia Contents, 3657, Janunary 1999.
[24] G. E. Legge, J. M. Foley. Contrast masking in human vision. Journal of the Optical Soc. of America, 70, pages : 1458–1471, 1980.
[25] J. Lubin. The use of psychophysical data and models in the analysis of display system performance. Digital Images and Human Vision, pages 162–178, 1993. [26] E. Peli. Contrast in complex images. Journal of the Optical Society of America,
7(10), pages : 2032–2040, 1990.
[27] A. Bradley, E. Switkes, K. K. De Valois, Contrast dependence and mechanisms of masking interactions among chromatic and luminance gratings Journal of the optical society of America, vol. 5 (7), pp. 1149-1159, 1988.
[28] A. Bradley, A Wavelet Visible Difference Predictor IEEE Transactions on Image Processing, vol. 8 (5), pp. 717-730, 1999.
[29] F.A. P. Petitcolas. Watermarking schemes evaluation. IEEE Signal Processing, vol. 17, no. 5, pp. 58-64, September 2000
[30] F.A.P. Petitcolas, R.J. Anderson, M.G. Kuhn. Attacks on copyright marking systems. Second Workshop on information hiding, 1525, pages : 218–238, 1998. [31] M. Carnec, P. Le Callet, D. Barba An image quality assessment method based on perception of structural information. IEEE International Conference on Image Processing, (3) pages : 185–188, 2003.
[32] Z. Wang, A. C. Bovik, H. R. Sheikh and E. P. Simoncelli, ”Image quality assessment: From error visibility to structural similarity,” IEEE Transactions on Image Processing, vol. 13, no. 4, pp. 600-612, Apr. 2004.
[33] C.I. Podilchuk, W. Zeng. Image-adaptive watermarking using visual models. IEEE Journal on Selected Areas in Communications, 16(4), pages : 525–539, May 1998.
[34] A. Neri, P. Campisi, M. Carli, E. Drelie Gelasca, Watermarking hiding in video sequences, First international workshop on video processing and quality metrics for consumer electronics, Scottsdale, Arizona, 23-25 January 2005.
[35] M.B. Sachs, J. Nachmias, J.G. Robson. Spatial frequency channels in human vision. Journal of the optical society of America, 61(9), pages : 1176–1186, 1971. [36] D.J. Sakrison, On the role of the observer and a distortion measure in image
transmission. IEEE Trans. on Com., 25(11), pages : 1251–1267, 1977.
[37] R.G. Van Schyndel, A.Z. Tirkel, C.F. Osborne. A digital watermark. Proceedings of the International Conference on Image Processing, 2, pages : 86–90, 1994.
[38] H. Senane, A. Saadane, D. Barba Image coding in the context of a psychovisual image representation with vector quantization, Int. Conf. on Image Proc. 1995, pp. 97-100, 1995.
[39] N. Bekkat, A. Saadane, D. Barba: Masking effects in the quality assessment of coded images, SPIE Human Vision and Electronic Imaging V (2000), Vol. 3959, pp. 211-219.
[40] A. Ninassi, P. Le Callet, F. Autrusseau, Pseudo No Reference image quality metric using perceptual data hiding SPIE Electronic Imaging, vol. 6057, 2006. [41] M.C.Q. Farias, M. Carli, S.K. Mitra Video Quality Objective Metric Using Data Hiding, Proc. IEEE Workshop on Multimedia Signal Processing (MMSP), (3), pp. 464-467, 2002.
[42] P.C. Teo, D. J. Heeger. Perceptual images distortion. Proc. of SPIE, 2179, pages : 127–141, 1994.
[43] A. B. Watson, G. Y. Yang, J. A. Solomon, J. Villasenor. Visual thresholds for wavelet quantization error. SPIE Proceedings, Human Vision and Electronic Imaging, 1996.
[44] A.B. Watson, The cortex transform : Rapid computation of simulated neural images. Computer Vision, Graphics, And Image Processing, 39, pages 311–327, 1987.
[45] A.B. Watson, Image data compression having minimum perceptual error. US Patent 54629780.
[46] A. B. Watson, J. A. Solomon, Model of visual contrast gain control and pattern masking. Journal of the Optical Society of America, vol. 14 (9), pp. 2379-2391, 1997.
[47] A.B. Watson. Efficiency of a model human image code. Journal of the Optical Society of America, 4(12), pages : 2401–2417, 1987.
[48] A.B. Watson, DCT quantization matrices visually optimized for individual images. Proc. of the SPIE Conference on Human Vision, Visual Processing and Digital Display IV, 1913, pages : 202–216, February 1993.
[49] W. Zeng, S. Daly, S. Lei, An overview of the visual optimization tools in JPEG 2000 Signal Processing: Image Communication, 17 (2002) pp. 85-104.
[50] C. Zetzsche, G. Hauske, Multiple channel model for the prediction of subjective image quality. Proceedings of the SPIE, Human Vision, Visual Processing and Digital Display, pages 209–216, 1989.
[51] M. L. Miller, J. A. Bloom, Computing the probability of false watermark detection Workshop on information hiding, Dresden Germany, Sept. 29 - Oct. 1, 1999
[52] JP. Linnartz, T. Kalker, G. Depovere, Modelling the false alarm and missed detection rate for electronic watermarks 2nd Workshop on Information Hiding, Portland, OR, 15-17 April, 1998
[53] A. Piva, M. Barni, V. Cappellini, Threshold selection for correlation-based watermark detection Proceedings of COST 254 Workshop on Intelligent Communications, L’Aquila, Italy, June 4-6, 1998, pp. 67-72
[54] F. Bartolini, M. Barni, V. Cappellini, A. Piva, Mask building for perceptual hiding frequency embedded watermarks. Proceedings of the International Conference on image Processing, 1, pages : 450–454, 1998.
[55] P.G.J. Barten, Contrast sensitivity of the human eye and its effects on image quality. SPIE, Bellingham, 1999.
[56] S. Daly, The visible difference predictor : An algorithm for the assessment of image fidelity. Proc. of the SPIE, Human Vision, Visual Processing and Digital Display, III, pages : 2–15, 1992.
[57] E. Dreliie Gelasca, D. Tomasic and T. Ebrahimi, Which Colors Best Catch Your Eyes: a Subjective Study of Color Saliency, First International Workshop on Video Processing and Quality Metrics for Consumer Electronics, Scottsdale, Arizona, USA, January 2005.
1
2
3
4
5
6
1
2
3
4
5
6
1
2
3
4
fy (cy/d°)
fx (cy/d°)
Angular selectivity
LF: none
III: 45°
IV: 30°
V: 30°
LF III IV V28.2 cy/d°
5.7 cy/d°
1.5 cy/d°
14.2 cy/d°
Fig 1:Perceptual sub-band decomposition of the Fourier Spectrum
Original image FFT 16x16 Watermark (Fourier coefficients) Spatial IFFT Quantization threshold
X
Perceptual Mask (IV,2) (LF+III) argmin Perceptual weighting coefficient Visual model Weighted Sub-band limitedFig 2: Weighted watermark computation
Fig 3a: Frequency watermark in sub-band (IV,1)
Fig 3b: spatial representation
Fig 3c: The corresponding marked image
0
10
20
30
40
50
60
70
80
90
0.0
0.2
0.4
0.6
0.8
1.0
1.2
6x6 watermark
8x8 watermark
10x10 watermark
Fig 4a: size optimization; watermarks of size 6x6 to 10x10
0
10
20
30
40
50
60
70
80
90
0.0
0.2
0.4
0.6
0.8
1.0
1.2
12x12 watermark
14x14 watermark
16x16 watermark
Fig 4b: size optimization; watermarks of size 12x12 to 16x16
0.2
0.4
0.6
0.8
1.0
Crown V
Crown IV
Crown III
Fig 5: Crosscorrelation for the barbara image against 89 Attacks
0
100
200
300
400
500
600
0.1
0.2
0.3
0.4
0.5
6: Detector response. Only 1 matching watermark at position 200
0.0
0.1
0.2
0.3
0.4
0.5
0.6
0.7
0.8
0.9
1.0
0
10
20
30
40
50
60
70
80
90
100
110
120
False Positive
False Negative
False Negative (Stirmark Attacks)
Chosen threshold
Fig 7a: False Alarm and Missed detection rate for 8x8 watermarks
0.0
0.1
0.2
0.3
0.4
0.5
0.6
0.7
0.8
0.9
1.0
0
10
20
30
40
50
60
70
80
90
100
110
120
False Positive
False Negative
False Negative (Stirmark attacks)
Chosen threshold
Fig 7bFalse Alarm and Missed detection rate for 16x16 watermarks
0
5
10
15
20
25
30
35
40
45
50
0.60
0.65
0.70
0.75
0.80
0.85
0.90
0.95
1.00
1.05
images index
Autrusseau algorithm, Carnec metric
Autrusseau algorithm, SSIM metric
Fig 8a: Objective quality scores for 50 images (Carnec and SSIM)
0
5
10
15
20
25
30
35
40
45
50
0.60
0.65
0.70
0.75
0.80
0.85
0.90
0.95
1.00
1.05
image index
Cox algorithm, Carnec metric
Cox algorithm, SSIM metric
Fig 8b: Objective quality scores for 50 images (Carnec and SSIM)
0
5
10
15
20
25
30
35
40
45
50
0.60
0.65
0.70
0.75
0.80
0.85
0.90
0.95
1.00
1.05
images index
Fridrich algorithm, Carnec metric
Fridrich algorithm, SSIM metric
Fig 8c: Objective quality scores for 50 images (Carnec and SSIM)
0
5
10
15
20
25
30
35
40
45
50
0.60
0.65
0.70
0.75
0.80
0.85
0.90
0.95
1.00
1.05
images index
Zhu algorithm, Carnec metric
Zhu algorithm, SSIM metric
Fig 8d: Objective quality scores for 50 images (Carnec and SSIM)
10
30
50
70
90
110
130
150
170
190
40
50
60
70
80
90
100
110
75 %
y = a-b.exp
-c.x
d
a = 103.57
b = 56.96
c = 7.10 e-5
d = 2.01
96 %
Weibull fitting for the "boats" image
Fig 9: Subjective quality assessment for the set of fifty images
Fig 10a: 1D cross-correlation results, (a) Ratio (1.0 1.2)
Fig 10b: 1D cross-correlation results, (b) Cropping 10%
Fig 10c: 1D cross-correlation results, (c) 2 degrees rotation
Fig 10d: 1D cross-correlation results, (d) 5 rows, 1 col removed
Fig 11a: 2D cross-correlation results, (a) Ratio (1.0 1.2)
Fig 11b: 2D cross-correlation results, (b) Cropping 10%
Fig 11c: 2D cross-correlation results, (c) 2 degrees rotation
Fig 11d: 2D cross-correlation results, (d) 5 rows, 1 col removed
0
10
20
30
40
50
60
70
80
90
0.0
0.1
0.2
0.3
0.4
0.5
0.6
0.7
0.8
0.9
1.0
Barbara
Threshold
Fig 12a:Crosscorrelation for 89 Stirmark attacks (barbara image)