HAL Id: hal-00795232
https://hal.archives-ouvertes.fr/hal-00795232
Submitted on 11 May 2020
HAL is a multi-disciplinary open access
archive for the deposit and dissemination of
sci-entific research documents, whether they are
pub-lished or not. The documents may come from
teaching and research institutions in France or
abroad, or from public or private research centers.
L’archive ouverte pluridisciplinaire HAL, est
destinée au dépôt et à la diffusion de documents
scientifiques de niveau recherche, publiés ou non,
émanant des établissements d’enseignement et de
recherche français ou étrangers, des laboratoires
publics ou privés.
Re-identification by Inductive Loop Detector:
Experimentation on target origin - Destination matrix
David Guilbert, Cédric Le Bastard, Sio Song Ieng, Yide Wang
To cite this version:
David Guilbert, Cédric Le Bastard, Sio Song Ieng, Yide Wang. Re-identification by Inductive Loop
Detector: Experimentation on target origin - Destination matrix. IEEE Intelligent Vehicles
Sympo-sium, Jun 2013, Gold Coast, Australia. �10.1109/IVS.2013.6629666�. �hal-00795232�
Re-identification by Inductive Loop Detector: Experimentation
on Target Origin - Destination Matrix
David Guilbert
1,2, C´edric Le Bastard
1,2, Sio-Song Ieng
3and Yide Wang
2∗†‡
Abstract
Traffic congestion has led to research on how to use the existing infrastructure more efficiently. The experi-mental platform SAROT was constructed to allow traf-fic analysis but also to test new algorithms for traftraf-fic modeling and management. Origin-Destination (OD) Matrix is one of the most important traffic information for Intelligent Traffic System. By using the experimen-tal platform SAROT, we want to test algorithms for OD Matrix. To obtain OD matrix, we need to get useful and accurate data by tracking vehicles. Two approaches for tracking vehicles by using Inductive Loop Detector (ILD) are used. Both approaches are computed on real traffic data set and compared. We use threshold deci-sion to improve the correct matching rate for tracking vehicles. We propose a new methodology by associat-ing two algorithms for increasassociat-ing the correct matchassociat-ing rate. The new methodology was used to perform target OD matrix.
1. INTRODUCTION
Transportation demands have increased in the last years. It has led to serious and worsening traffic prob-lems (congestion, pollution, accidents, etc.). To opti-mize the use of space and existing infrastructure, traffic managers need advanced techniques and tools to solve the difficult traffic problems. Origin-Destination (O-D) Matrix is an important traffic parameter in efficient traf-fic management and transportation planning. This
pa-∗1D. Guilbert, C. Le Bastard are with CETE Ouest, DLRC Angers, 23 avenue de l’Amiral Chauvin, 49136 Les Ponts de C´e, Francedavid.guilbert, cedric.lebastard @developpement-durable.gouv.fr
†2S.-S. Ieng is with Universit´e Paris-Est IFSTTAR, 14-20
Boule-vard Newton, Cit Descartes, Champs sur Marne F-77447 Marne la Valle Cedex 258, France,[email protected]
‡3D. Guilbert, C. Le Bastard and Y. Wang are with LUNAM
Uni-versit´e - UniUni-versit´e de Nantes, IETR Polytech Nantes, Site de la Chanterie, rue Christian Pauc, BP 50609, 44306 Nantes Cedex 3, [email protected]
rameter provides information about the number of trav-elers that commute or the amount of freights shipped between different areas of a region. But it is difficult to get the accurate O-D matrix with only direct measure-ments, interviews or surveys. Most of the techniques use prior information that might be expressed in terms of target O-D matrix [1]. Therefore, it is obvious that the target O-D matrix should be as accurate as possible. Recently, various estimation approaches for O-D matrix estimation have been developed [2, 3, 4]. It is possible to collect and analyze traffic data in real time to provide target O-D matrix by using vehicle tracking. For exam-ple, plate scanning can be used [5, 6]. Other sensors could also be used such as the Inductive Loop Detector which is the most used sensor in many countries. Re-cent work on this kind of sensors is the so called induc-tive loop’s signature re-identification (ILSR). This ap-proach is efficient to track anonymously vehicles with-out potential privacy concerns. In this paper, two ILSR algorithms are used for tracking vehicles. An experi-mentation is realized to compare the two algorithms and then they are used jointly to improve the matching rate of tracked vehicles. The target O-D matrix is also cal-culated using this new tracking algorithm.
2. Experimentation Platform
To optimize traffic management, it is necessary to collect the data on the traffic in order to model it and deduce the rules of optimization. It is also necessary to give the possibility to control the new algorithms set up for traffic management and to measure the expected benefit. It is within this framework that the experimen-tal platform SAROT has been developed.
SAROT is the acronym for ”Site Angevin de R´ef´erence pour l’Observation du Trafic” which can be translated by ”Angers platform of reference for traffic observation”. The aim of SAROT is to provide traf-fic data for analyzing user behaviors and understanding them in order to experiment new intelligent traffic sys-tems. SAROT is located on an urban motorway in the
east side of Angers in western France. Two lanes on Paris direction, and an access ramp are instrumented. The instrumented section is about 1050 meters. The speed is limited to 90km/h. The site has an average of 22000 vehicles per day. The instrumented section in-cludes 500 meters along an access ramp which is under a detailed observation. Seven cameras have been placed on three mast for observing and recording video picture of all the area of this section. 29 double inductive loops detectors are installed on the experimental platform, 5 on the access ramp and 12 on each lane. For the de-tailed section of 500 meters, the sensors are regularly spaced by 50 meters. 6 automatic number plate recog-nitions are over the bridges, with infrared light to per-form recognition during night. Over the bridge, there are also 6 lasers for performing reference measurement. All the sensors are managed by servers for the acqui-sition of data. The platform offers the possibility to activate one or more groups of sensors. The data are stored in a database, some data are aggregated directly to provide more information. For example, informa-tion in the database are timestamps, speed, classifica-tion, vehicle length, picture, ... With all these informa-tion, traffic analysis is possible. For example, SAROT has been used to collect data for analyzing lane use and operating speeds near entrance ramp [7]. In this pa-per, we want to realize vehicles tracking and calculate target Origin-Destination Matrix on this experimental platform. Figure 1 presents a simplified view of the ex-perimental platform SAROT with only the five Induc-tive Loop Detector used.
ILD 1 ILD 2 ILD 4 ILD 5 ILD 3 1050 m 350 m
Figure 1. The simplified experimentation plat-form SAROT
3. Vehicle tracking
Vehicle tracking is usually done by Origins-Destinations questionnaires, travel or mobility surveys, etc. but these data are punctual and costly. Several tech-nologies become available for vehicle tracking, such as GPS, vehicle tag, video image processing by plate recognition, cellular phone. However, these techniques are not free from privacy issue or do not cover wide surveillance area. The most common technique used
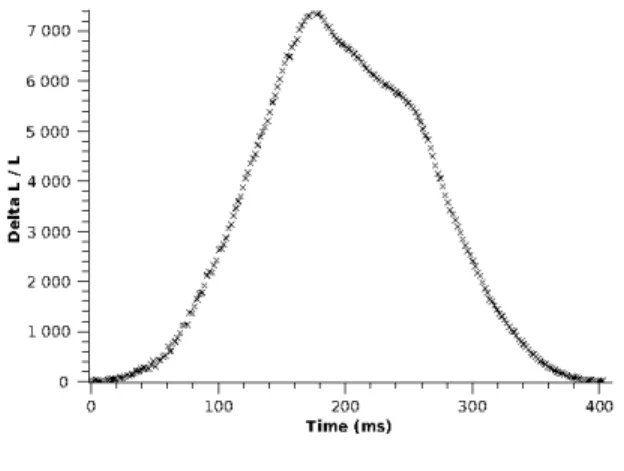
for traffic data collection is the inductive loop detector. Now advanced inductive loop detector can provide a in-ductance waveform when a vehicle passes over the sen-sor. The waveform, the so-called vehicle signature (fig-ure 2), can be used in vehicle re-identification; matching vehicles between an upstream and downstream location.
Figure 2. Raw vehicle signature
Therefore, a widespread Inductive Loop Detector network can provide anonymously a target Origins -Destinations matrix in real time. In a sense, it is an identification problem. The system identification is split into two separated components: the feature extraction and pattern matching.
From the vehicle signature, numerous features can be calculated. Different algorithms using different set of features are presented in [8, 9, 10, 11]. In [8], the clas-sical principal component analysis method is applied to identify the most representative features. The objective of features selection is to improve the performance, pro-vide fast and cost-effective algorithms. Based on the approach proposed in [8], only 9 features are extracted and used in this study. The features consist of elements of the Fourier Transform, the length, the overall maxi-mum.
Let xibe the features vector:
xi= (xi,0, xi,1, xi,2, xi,3, xi,4, xi,5, xi,6, xi,7, xi,8)T (1) In the ILSR problem, a downstream signature features vector xdis compared to a set of upstream signature
fea-tures vectors (xu,j)j=1..nin order to find a feature vector
pair from one single vehicle. If there was little varia-tion on the signature between the upstream and down-stream signature features vectors, it would be easy to perform a perfect vehicle matching algorithm. How-ever, in practice, vehicle signatures vary from differ-ent detection stations. For example, the differ-entrance angle of a vehicle into an inductive field, variability between the up and downstream inductive loop systems, physical
loop installation, etc are different kind of signature dis-ruption. The variation of up and downstream features vectors can be expressed by:
xu= ¯x +εu (2)
xd= ¯x +εd (3)
¯xmeans the real vehicle signature andεu,εdthe noise. An error close to zero signifies that two signatures should likely correspond to the same vehicle from two loops. The goal is thus to find features vector pair that minimizes the error. In this paper, the Bayesian approach and the fuzzy approach proposed in [8, 9] for travel time estimation are adopted for vehicle re-identification.
For Bayesian approach, we calculate the risk ri:
ri(xd) = 1 2 ( xd− ¯xu,i )T S−1(xd− ¯xu,i ) (4) where S is obtained by a supervised learning phase on a given set of training examples.
In theory, for a same vehicle passing through the up-stream and the downup-stream ILD, the risk should be equal to zero. In practice, the downstream signature features vector won’t be the same as the upstream sig-nature features vector (due to electronic noise, variation of speed, etc.), so the risk will be different from zero. A risk with small value shows a great similarity, so we can establish that it is the same vehicle.
The fuzzy logic approach is used to model the data imperfection between the upstream and the downstream sensors for the re-identification. In this case, the noise
εcan be generalized. For each jthcomponent xu,i,jof
the ithupstream features vector, a fuzzy set Ei, j[8, 9] is defined that consists of the component and the member-ship function : fEi, j(xk) = 0 xk∈ [m/ k−αk, mk+αk] , 1 xk= mk, 1 +xk−mk αk xk∈ ]mk−αk, mk[ , 1 +mk−xk αk xk∈ ]mk, mk+αk[ . (5) with : xk= xd,k− xu,i,k k∈ [0,8] αk= p2×σk (6) The parameters mk andσk, respectively the mean and the standard deviation, are obtained from a supervised learning phase. The parameter p2should be established
with the cross-validation step described after. Finally, the discriminating function is defined by :
Fi(Xd) =
8
∑
k=0
fEi, j(xk) (7)
In theory, a vehicle will have a sum equal to 9 between two ILDs. In practice, as for the Bayesian approach the signature features vector would be different between two ILDs and we won’t have a sum equal to 9. But a value which tends towards 9 shows a great similarity, so we can establish that it is the same vehicle. The higher is the discriminating function, the lower is the risk.
4. Cross-validation step
On figure 1 the Inductive Loop Detector (ILD) 2, 1 and 3 are considered as 3 upstream sensors, the ILD 5 and 4 as 2 downstream sensors. The distance between the ILD 2, ILD 1 and the 2 downstream loops (ILD 5 and ILD 4) is 1050 meters. The distance between the ILD 3 and the two downstream loops is 350 meters. Video recording is carried out for each loop in order to get a number of plate pictures (the plate pictures are encrypted for security) at the same time as the vehicle electromagnetic signature. Video data are used as refer-ence. We have a lack of information due to the exit and the ramp access which have no inductive loop detector. All vehicles coming from this ramp access or going to this exit are eliminated from database. Only the signa-tures of the cars are stored in the database.
Finally, the database contains 1396 vehicles. The database is split into two parts, the first part of 460 ve-hicles are used for the cross-validation step and the sec-ond part of 936 vehicles are used for the test-step.
The cross-validation is a statistical method of eval-uating and comparing learning algorithm [12]. In our case, the Bayesian approach will be compared with the fuzzy approach. The basic form of cross-validation is
k-fold cross-validation. In k-fold cross-validation, the
data is partitioned into k equally sized subsets. For the experimentation, k is chosen equal to 10. For each fold, the data are taken randomly. k iterations of training and validation are performed. Within each iteration a differ-ent fold of the data is held-out for validation while the remaining k− 1 folds are used for learning.
In the case of fuzzy approach, the mk and theσk are learned from the k− 1 folds. Once the parameters are known, the fuzzy approach is used on the validation data for identification. During this step, we try differ-ent value of p2to optimize the identification. In order
to compare the performance of different values, the cor-rect matching rate (CMR) is defined as the ratio of the number of good matched vehicles on the total number of vehicles.
CMR = number of good matched vehicles
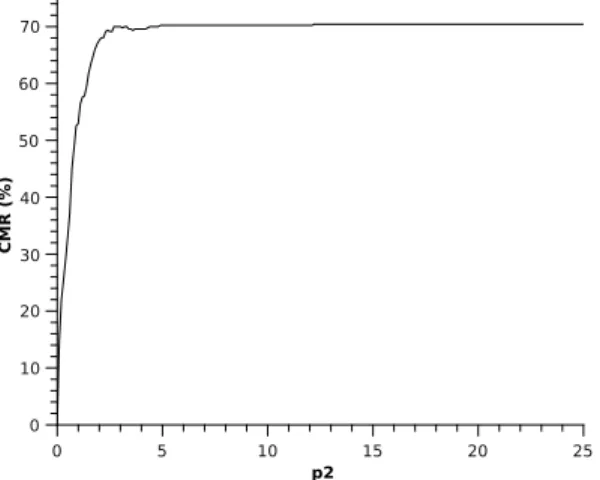
total number of vehicles × 100 (8) The CMR is calculated for each folder and different val-ues of p2. The average CMR is selected to be shown in
figure 3 as a function of p2. For p2= 2.7, the CMR
reaches already a value of 70%. There are little varia-tion in the CMR for values of p2between 2.7 and 12.3.
As the CMR value is constant for upper value of p2, we
have chosen p2= 12.5 . C M R ( %) 0 10 20 30 40 50 60 70 p2 0 5 10 15 20 25
Figure 3. CMR (%) in function of p2 for fuzzy
approach
In the case of Bayesian approach, only the matrix Sis learned from the k− 1 folds. We don’t have other parameters to optimize.
Table 1 shows the CMR of the two different ap-proaches for each validation fold. The average CMR for both approaches is calculated. It shows that the Bayesian approach gives a better result.
Table 1. Vehicle re-identification performances with two different approaches
CMR (%) Bayesian Approach Fuzzy Approach Fold 1 58.7% 54.35% Fold 2 54.35% 56.52% Fold 3 76.09% 67.39% Fold 4 78.26% 71.74% Fold 5 82.61% 73.91% Fold 6 76.09% 76.09% Fold 7 63.04% 65.22% Fold 8 84.78% 89.13% Fold 9 78.26% 73.91% Fold 10 86.96% 76.09% Mean 73.91% 70.43%
Now, we want to improve the correct matching rate of the two approaches to get a good estimate of tar-get origin-destination matrix Both algorithms try to per-form an association between an upstream signature fea-tures vector and a downstream one, even if the risk for Bayesian approach is high and the discriminating value
for the fuzzy approach is low. The upstream signature features vector may be very different from the down-stream features vector for the same vehicle. This could be generated by a vehicle which passes on the axis of the upstream ILD and on the left of the downstream ILD. The features vector of an other vehicle will be more similar and an error on the association may be made. By introducing a decision threshold, we could avoid some of this mismatching.
To improve the result, the risk for Bayesian ap-proach and the discriminating value for fuzzy apap-proach of making mismatching are taken into account by intro-ducing a decision threshold for each approach. The de-cision threshold is calculated on the training database. For Bayesian approach, if the risk is higher than the threshold for all possible combinations, no association would be retained. In the case of fuzzy approach, no association would be made if the discriminating value is lower than the threshold. We define the retained traf-fic as the number of vehicles associated with Bayesian approach or fuzzy approach on the number of true asso-ciation (based on the reference cameras). The retained traffic percentage in function of the threshold in relation with the used approach is presented on figure 4 and 5. The introduction of these thresholds implies a compro-mise between the CMR and the retained traffic.
% 0 20 40 60 80 100 Decision threshold 0 10 20 30 40 50 60 70 80
Bayes approach retained traffic percentage Bayes approach CMR (%)
Figure 4. CMR and retained traffic percentage in function of threshold for the Bayesian ap-proach
For example, the threshold for Bayesian approach equal to 10 means that any association of vehicles whose risk is greater than 10 is rejected. Therefore, some upstream signature features vectors will not be as-sociated to downstream signature features vectors. In figure 4, when the decision threshold is equal to 10, the retained traffic is about 76.3% and the CMR is about 80.14%. As shown in figure 4, on one hand, the
retained traffic percentage increases to move towards 100% when the threshold also increases. On the other hand, the CMR decreases to tend to about 74%. The re-tained traffic percentage decreases quickly for a thresh-old under 10, but the CMR value is good in this case. A compromise should be made because if the traffic is held too low despite a high CMR, it will be difficult to estimate the target O-D matrix. We propose to take as threshold the intersection of the two curves. The opti-mal threshold, as defined before, is about 11.2 and both CMR and the retained traffic percentage are about 80%.
% 0 20 40 60 80 100 Decision threshold 1 2 3 4 5 6 7 8 9 10
Fuzzy approach retained traffic percentage Fuzzy approach CMR (%)
Figure 5. CMR and retained traffic percentage in function of threshold for the fuzzy approach Figure 5 shows the CMR and the retained traffic in function of the discriminating value as threshold for fuzzy approach. The CMR moves towards 70% when the threshold decreases, and the retained traffic reaches 100%. If we are more selective in setting a high thresh-old (greater than 8.35), selected traffic will decrease rapidly. Like the Bayesian approach, we propose to take as threshold the intersection of the two curves. The op-timal threshold is about 8.24 and both CMR and the retained traffic percentage are about 77%. The CMR is improved in both approaches.
The two approaches are based on different math-ematical theory. By analyzing the mismatching vehi-cles of both approaches, bad matching is not necessar-ily made on the same vehicle. To avoid mismatching, we propose a new approach by combining the two ap-proaches defined above and by defining the following new rule: if the two approaches give a same matching, the decision is considered as true; if they give two dif-ferent answers, the risk to mismatching is considered as important, then no decision is taken which means that the downstream vector doesn’t match an upstream vec-tor. The new technique is named in this paper as
Asso-ciated Bayes-Fuzzy (ABF) approach. Two cases can be considered, one without the threshold and one with the threshold established for the two original approaches.
Table 2. Vehicle re-identification performances with four different approaches
CMR(%) Bayesian Fuzzy ABF ABF (threshold) (threshold) (threshold) Fold 1 57.58% 54.84% 68.57% 62.96% Fold 2 65.71% 62.5% 67.65% 74.07% Fold 3 83.78% 74.29% 79.49% 83.87% Fold 4 84.21% 78.95% 82.05% 85.29% Fold 5 86.11% 80.56% 84.62% 87.5% Fold 6 85.29% 87.88% 82.93% 90.32% Fold 7 74.36% 71.05% 72.97% 75.76% Fold 8 88.89% 91.43% 88.64% 90.63% Fold 9 80.49% 79.49% 83.78% 85.29% Fold 10 89.19% 83.33% 87.5% 87.88% Mean 79.56% 76.43% 79.82% 82.36%
Table 2 shows that, the best result is obtained by the ABF approach with threshold, the CMR is about 82%. The Bayesian approach with threshold and the ABF approach give nearly the same result about 80%. The CMR for the fuzzy approach with threshold is less than the other approaches.
The standard deviation for the ABF approach with-out and with threshold (respectively 7.54 and 8.8) is less than that for the Bayesian and the Fuzzy approaches with threshold (respectively 10.53 and 11.21). Thus, the standard deviation for the two ABF approaches is less important than that for the other methods.
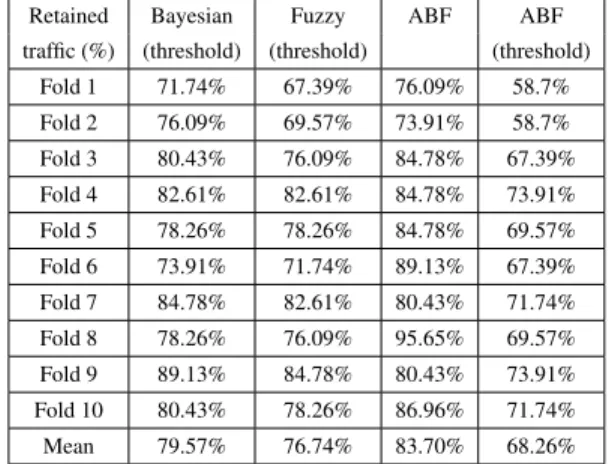
Table 3. Retained traffic for the four different approaches
Retained Bayesian Fuzzy ABF ABF traffic (%) (threshold) (threshold) (threshold)
Fold 1 71.74% 67.39% 76.09% 58.7% Fold 2 76.09% 69.57% 73.91% 58.7% Fold 3 80.43% 76.09% 84.78% 67.39% Fold 4 82.61% 82.61% 84.78% 73.91% Fold 5 78.26% 78.26% 84.78% 69.57% Fold 6 73.91% 71.74% 89.13% 67.39% Fold 7 84.78% 82.61% 80.43% 71.74% Fold 8 78.26% 76.09% 95.65% 69.57% Fold 9 89.13% 84.78% 80.43% 73.91% Fold 10 80.43% 78.26% 86.96% 71.74% Mean 79.57% 76.74% 83.70% 68.26%
We have also to make a compromise between a high CMR and the retained traffic. Table 3 shows that with only 68% the ABF approach with threshold has
the lowest retained traffic. The ABF approach without threshold has the best result on retained traffic. It is im-portant to know if the retained traffic is more imim-portant than the CMR for target O-D matrix or inversely.
5. Test database
The test database is used to evaluate the accuracy of only ABF approaches with and without threshold. They have given the best result. The matrix S of the Bayesian function and the parameters of the fuzzy function are learned from the cross-validation database. The results for the two approaches are much lower than those for cross-validation database, respectively 40.83% without threshold and 41.15% with threshold of CMR. This re-sult is due to a too important candidate number for the identification. The number of candidates can be reduced easily by taking into account the temporal constraint as it is presented in [8]. For the origins ILD 2 and ILD 1 to the destinations ILD 5 and ILD 4, the vehicle speed is considered to be between 60 km/h and 115 km/h. For the origin ILD 3 to the destinations ILD 5 and ILD 4, the vehicle speed is considered to be between 50 km/h and 100 km/h. With those considerations, a time window is applied for each case. The candidates for the vehicles matching are only those that are detected within win-dows. The average candidates within the time windows is about 11.
Table 4. Bayes-Fuzzy approaches for the test database
CMR(%) Retained Traffic(%) ABF (without threshold) 93.78 92.74
ABF (threshold) 94.51 72.01
Table 4 shows the percentage of CMR and of re-tained traffic for the ABF approach with and without threshold. The CMR is very high in both cases. For nearly the same CMR, the retained traffic is higher for the ABF approach without threshold. The retained traf-fic is 20 points more without threshold. In this case, it’s more interesting to select the ABF approach with-out threshold. Thus, only this approach is considered in the following for the target O-D matrix computation.
6. Target Origin - Destination matrix
The reference Origin-Destination matrix R, table 5 is established from the video recording for the test database. We have a total of 936 vehicles in the ma-trix. The matrix represent the number of vehicles from an origin to a destination. The numbers between brack-ets are the percentage of vehicles of the matrix.
Ap-proximately half of the traffic goes from origin 1 to destination 4. The flow from origin 3 to destination 5 represents a small percentage of the traffic The other observed O-D matrices are of the same order of magni-tude.
Table 5. The reference Origin Destination ma-trix R for the test database
Destinations 4 5 Origins 1 465 (49.95%) 116 (12.46%) 2 80 (8.59%) 132 (14.18%) 3 118 (12.67%) 20 (2.15%)
Note that, the identification process doesn’t take into account all the vehicles, so the target matrix will not have the same number of vehicles. In order to com-pare the target matrix to the reference matrix, flows are expressed as percentage.
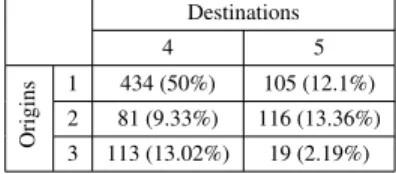
The target OD matrix is estimated by the ABF ap-proach without threshold. Table 6 shows the estimated target O-D matrix T . The traffic retained for the target OD matrix is equal to 868 vehicles (92.74%).
Table 6. The estimated target Origin Destina-tion matrix T from the test database
Destinations 4 5 Origins 1 434 (50%) 105 (12.1%) 2 81 (9.33%) 116 (13.36%) 3 113 (13.02%) 19 (2.19%)
The results are very similar to the reference O-D matrix, so the target O-D matrix represents a good es-timation of the flow distribution. To evaluate the target matrix, the matrix E representing the relative error be-tween the target flow percentage and the reference flow percentage is defined as follows:
E(i, j) =R(i, j)− T(i, j)
R(i, j) (9)
Table 7 shows that the relative error is less than 0.1 for Table 7. The error matrix E for the test database
Destinations 4 5 Origins 1 0 0.03 2 -0.09 0.06 3 -0.03 -0.02
each path when we compare the percentage. The target matrix is very close to the reality. This method has been
used on a static database from real data. But it can also be used on a dynamic database. In this case, the target O-D matrix could be computed dynamically.
7. Conclusions
In this paper, the experimental platform SAROT was used to acquire the data from ILDs, the cam-era recorders, the automatic number plate recognition. From this real traffic database, we have used Bayesian and fuzzy approaches to make anonymous vehicle tracking. The vehicle tracking performance is evalu-ated by cross-validation and the CMR is about 70%. To avoid mismatching vehicles, we apply a threshold on the decision process. As we are more selective on the matching, we don’t retain all the traffic and the CMR is higher. We also propose a new approach by associating the two algorithms with and without threshold. The best trade-off between the CMR and the retained traffic is obtained by the ABF without threshold. A test database is used to validate the result. To have a reasonable num-ber of candidates for the identification process, a time window is used. The CMR and the retained traffic are respectively about 93% and 92% for the ABF without threshold. Those approaches were achieved with ILD, but it is also possible to implement those approaches with other sensors such as video, laser, ...
From the vehicle tracking information, we have constructed the target O-D matrix. The relative error between the target O-D matrix and the reference one is less than 0.1 when we compare the percentage. The network seem very simple, but we can consider longer section and more complicated network as a set of simple networks.
References
[1] T. Abrahamsson, “Estimation of origin-destination ma-trices using traffic counts-a literature survey”, IIASA In-terim Report IR-98-021/May, 1998.
[2] M. L. Hazelton, “Some comments on
Origin-Destination Matrix Estimation”, Transportation Research Part A: Policy and Practice, vol. 37, no. 10, Dec. 2003.
[3] J. Li, B. Lin, Z. Sun, and X. Geng, “An estimation model of time-varying origin-destination flows in expressway corridors based on unscented Kalman filter”, Science in China Series E: Technological Sciences, vol. 52, no. 7, pp. 2069-2078, Jun. 2009.
[4] P.-W. Lin and G.-L. Chang, “generalized model and so-lution algorithm for estimation of the dynamic freeway origin-destination matrix”, Transportation Research Part B: Methodological, vol. 41, no. 5, pp. 554-572, Jun. 2007.
[5] E. Castillo, J. M. Men´endez, and P. Jim´enez, “Trip ma-trix and path flow reconstruction and estimation based on plate scanning and link observations”, Transporta-tion Research Part B: Methodological, vol. 42, no. 5, pp. 455-481, Jun. 2008.
[6] R. M´ınguez, S. S´anchez-Cambronero, E. Castillo, and P. Jim´enez, “Optimal traffic plate scanning location for OD trip matrix and route estimation in road networks”, Transportation Research Part B: Methodological, vol. 44, no. 2, pp. 282-298, Feb. 2010.
[7] G. Louah, D. Daucher, P. Conde-Cespedes, F. Bosc, and J.-P. Lhuillier, “Traffic Operations at an Entrance Ramp of a Suburban Freeway First Results”, in Procedia-Social and Behavioral Sciences, 2011, vol. 16.
[8] S.-S. Ieng, C. Grellier, J. Rivault, J. Bertrand, and M. Pithon, “Inductive-Loop-Based Vehicle Signature Fea-tures Analysis and the Anonymous Vehicle Reidentifica-tion for Travel Time EstimaReidentifica-tion”, presented at the Trans-portation Research Board 86th Annual Meeting, 2007, p. 16.
[9] S.-S. Ieng, J. Bertrand, A. Bacelar, and J. Nouvier, “Travel Time by Using Widespread Inductive Loops Network”, in Transport Research Arena, 2008. [10] D. Guilbert, C. Le Bastard, and A. Bacelar,
“Origin-Destination matrix by Using Inductive Loop Detector”, presented at the Transport Research Arena Europe 2010, Brussels, 2010.
[11] C. Le Bastard, D. Guilbert, A. Delepoulle, A. Boube-zoul, S. Ieng, and Y. Wang, “Vehicule identification from inductive loops application: Travel time estimation for a mixed population of cars and trucks”, in Intelligent Transportation Systems (ITSC), 14th International IEEE Conference, 2011, pp. 507-512.
[12] G. Dreyfus, J.-M. Martinez, M. Samuelides, M. B. Gor-don, F. Badran, and S. Thiria, Apprentissage statistique: R´eseaux de neurones - Cartes topologiques - Machines `a vecteurs supports. Eyrolles, 2011.