Title: The added value of accounting for activity space when examining the association between
tobacco retailer availability and smoking among young adults
Authors: Martine Shareck1,2 *, Yan Kestens2,3,4, Julie Vallée2,3,4,5, Geetanjali Datta2,4, and Katherine L.
Frohlich2,3 Accepted for publication in Tobacco Control Affiliations: 1 London School of Hygiene and Tropical Medicine, London, United Kingdom 2 Département de médecine sociale et préventive, Université de Montréal, Montréal, Canada 3 Institut de recherche en santé publique de l’Université de Montréal (IRSPUM), Montréal, Canada 4 Centre de recherche du centre hospitalier de l’Université de Montréal (CRCHUM), Montréal, Canada 5 Centre National de la Recherche Scientifique (CNRS), UMR Géographie-Cités, Paris, France * Corresponding author: London School of Hygiene and Tropical Medicine 15-17 Tavistock Place London, UK WC1H 9SH Phone: +44 (0)20 7958 8231 Fax: +44 (0)20 7927 2701 Email: martine.shareck@lshtm.ac.uk Keywords: activity space; context; mobility; neighborhood; smoking; tobacco retailer; youth Word count: 3700 Tables: 3 References: 53
1
ABSTRACT
Background: Despite a declining prevalence in many countries, smoking rates remain consistently
high among young adults. Targeting contextual influences on smoking, such as the availability of tobacco retailers, is one promising avenue of intervention. Most studies have focused on residential or school neighbourhoods without accounting for other settings where individuals spend time, i.e., their activity space. We investigated the association between tobacco retailer availability in the residential neighbourhood and in the activity space and smoking status. Methods: Cross-sectional baseline data from 1,994 young adults (age 18-25) participating in the Interdisciplinary Study of Inequalities in Smoking (Montreal, Canada, 2011-2012) were analyzed. Residential and activity locations served to derive two measures of tobacco retailer availability: counts within 500-meter buffers and proximity to the nearest retailer. Prevalence ratios for the association between each tobacco retailer measure and smoking status were estimated using log-binomial regression. Results: Participants encountering high numbers of tobacco retailers in their residential neighbourhood, and both medium and high retailer counts in their activity space, were more likely to smoke compared to those exposed to fewer retailers. While residential proximity was not associated with smoking, we found 36% and 42% higher smoking prevalences among participants conducting activities within medium and high proximity to tobacco retailers compared to those conducting activities further from such outlets. Conclusion: This study adds to the sparse literature on contextual correlates of smoking among young adults, and illustrates the added value of considering individuals’ activity space in contextual studies of smoking.
2 What this paper adds What is already known on this subject? • Young adults between 18 and 25 years consistently register the highest smoking prevalence among all age groups.
• The presence of tobacco retailers in the home and school neighbourhoods has been associated with smoking in youth and adults.
What important gaps in knowledge exist on this topic?
• Past studies have failed to consider the fact that individuals are mobile and may encounter tobacco retailers in the diversity of settings they experience in the course of their daily activities, i.e., in their activity space. This is especially relevant in studies of young adults since they are a particularly mobile population. What do we now know as a result of this study that we did not know before? • Living or conducting activities in areas characterized by high numbers of tobacco retailers is associated with smoking among 18 to 25 year-olds. • While residential proximity to a tobacco retailer is not associated with smoking, conducting activities in places which are, on average, within 150 meters or between 150 and 350 meters of such an outlet is associated with a higher likelihood of smoking.
• Considering individuals’ regular activity locations in contextual studies of smoking may be particularly insightful for tobacco control interventions targeted at settings, such as zoning policies.
3
INTRODUCTION
Despite an overall decline in many developed countries,[1-3] smoking remains disproportionally prevalent in young adults aged 18 to 25 years.[1 2] Since smoking is the leading preventable cause of premature death,[4] the concentration of this behaviour among young adults is of great public health concern. Early smoking initiation is associated with less success with quitting, a longer smoking duration [5] and, consequently, a higher risk of suffering from smoking-related health consequences including several cancers and cardiovascular diseases.
One avenue of promising population-level tobacco control intervention lies in targeting contextual features such as tobacco retailer availability,[6] defined as the degree of convenience in obtaining tobacco products, which is affected by the number and location of retailers.[6 7] The density of tobacco retailers around home [8-10] or school [11 12] has been associated with a higher likelihood of smoking in youth. In one study, retailer density in the residential but not the school neighbourhood was associated with youth smoking.[13] Among adults, high tobacco retailer density [14-18] and closer proximity [15 17 19] from home have been associated with a number of smoking behaviours including status,[14 19] initiation,[16 17] higher nicotine addiction and lower readiness to quit [18] as well as lower smoking abstinence.[15] In longitudinal studies, tobacco retailer proximity, but not density, in the residential area was associated with adults’ lower success at smoking abstinence [20] and cessation.[21] In two studies, increasing contacts with tobacco retailers as individuals moved across a city were related to increased cigarette cravings [22] and relapse among would-be quitters.[23] Whether these associations hold for young adults remains largely unexplored.
An important shortcoming of existing studies lies in their focus on the residential or school neighbourhood to examine the relationship between tobacco retailers and smoking. This overlooks the fact that individuals are mobile and experience a diversity of settings in the course of their daily
4
activities, all of which may provide exposure to tobacco retailers and subsequent opportunities to purchase cigarettes or crave smoking.[22-24] Most importantly, young adulthood is traditionally characterized by five transitions: leaving school, leaving the parental home, entering full-time work, entering conjugal relationships, and having children.[25] These may coincide with decreased social and physical bonds to the residential neighbourhood due to increased mobility, independence, and the development of relationships in new settings.[26 27] Moving beyond single, residential or school neighbourhoods, to examine contextual influences on smoking is thus warranted. This can be done by studying individuals’ activity space, defined as the subset of activity locations which one experiences as a result of his daily activities.[28-30] As such, activity spaces provide a more comprehensive and accurate representation of the contextual features and resources one may encounter on a regular basis.[30]
In this paper, we assessed the association between young adults’ smoking status and the number and proximity of tobacco retailers in their (a) residential neighbourhood, and (b) activity space. Tobacco retailer counts and proximity are two complementary measures of retailer availability.[31] While counts represent the overall number of tobacco retailers one might encounter in a given area, proximity approximates the ease of physical access. It is assumed that all else being equal, the closer one is from a tobacco retailer, the easier it is to buy cigarettes or the more tempted one might be to smoke.[7 31] We hypothesized that young adults who lived or conducted activities in areas with high numbers of (or in close proximity to) tobacco retailers, would be more likely to smoke than those living or conducting activities in areas with fewer tobacco retailers (or farther from such outlets). METHODS Study design and population Baseline data from the Interdisciplinary Study on Inequalities in Smoking (ISIS), collected between November 23rd 2011 and September 4th 2012, were analysed. 6,020 young adults were randomly
5
selected by the Régie de l’Assurance Maladie du Québec, the publicly funded health insurance programme in Quebec, Canada, from all eligible individuals living in each of the 35 Centre Locaux de Services Communautaires (CLSC) on the island of Montreal, Canada. CLSCs are the main health services catchment areas in Québec and served as sampling units to ensure geographic representativity across the study territory, i.e., the island of Montreal. Eligibility criteria included being between 18 and 25 years-old, fluent in French or English, and having lived for at least one year at their current address at time of first contact. Full details on procedures are available elsewhere.[32] Ethical approval was obtained from the Research Ethics Committee of the Université de Montréal’s Faculty of Medicine.
Data collection
Individual-level data
Participants provided socio-demographic, smoking, and activity location data in an online questionnaire (90.0% of respondents), a paper questionnaire (4.2%) or over the phone with a research assistant (5.8%) in exchange for a 10$ gift card. The final sample was 2,093 individuals, making for a 37.6% response proportion.[32] Online, written or verbal informed consent was obtained prior to questionnaire completion.
An activity space questionnaire was specifically developed to collect information on respondents’ regular activity locations (studying, working, grocery shopping, physical activity, leisure activity, and two other activities) in addition to their residential address. Participants provided location details (name, address, street, intersection/landmark, city) for each activity type they conducted. The questionnaire’s two-week test-retest reliability was high, as was its convergent validity when compared to a 7-day continuous GPS track and a prompted-recall survey completed by an independent sample.[33]
6
Area-level data
Geographical coordinates of stores which can legally sell tobacco in Québec, Canada (convenience stores, supermarkets, tobacconist shops, and gas stations) were extracted from the 2011 DMTI Enhanced Points of Interest (EPOI)© database.[34] Field validation of the 2010 version of this database was conducted for convenience stores and supermarkets, which were respectively found to have sensitivity values of 0.59 and 0.75 and positive predictive values of 0.73 and 1.00.[35] Area-level material deprivation was computed from 2006 Canadian Census data. Measures Outcome variable Smoking status was assessed with questions borrowed from the Canadian Community Health Survey questionnaire. Participants who had responded affirmatively to smoking at least one entire cigarette in the past were asked: “Currently, do you smoke cigarettes (1) every day, (2) sometimes or (3) never?” This question has been shown to have high sensitivity when compared to urinary cotinine levels.[36] Current smoking was defined as smoking daily or occasionally at the time of survey, while non-smokers combined former and never smokers.[37] Covariates Age, sex, occupational status (neither studying nor working/working/studying (while also working or not)), and educational attainment were considered individual-level covariates. Educational attainment was operationalized as (1) the highest level completed by participants who were not enrolled in studies, and (2) the highest level attained, imputed based on the level taught at the educational establishment attended at the time of survey, for students.[38] Three categories were created based on years of schooling: low (<=11 years; Secondary school or less), intermediate (12-13 years; CEGEP/Trade school (CEGEP are post-secondary institutions found only in Québec, Canada [39])) and high (14+ years; University).
7
Contextual measures
Respondents reported between 0 and 9 activity locations (mean 3.1, SD: 1.5). Out of the 8,422 residential and activity locations for which information was provided, 7.5% were not geocoded for lack of sufficient details. Geographic coordinates for the remaining 7,792 locations were obtained with Batch Geocodeur [40] using the street address (97.1% of locations), closest intersection (1.7%), landmark (0.3%), place name (0.5%) or street name (0.3%). A total of 8,362 tobacco retailers were identified in the DMTI EPOI© database.[34] Duplicate entries and those geocoded at the city level (n=597) were discarded for a final count of 7,765 tobacco retailers. Geocoded residential, activity, and tobacco retailer locations were spatialized in ArcGIS© v.10.1. They were used to compute two tobacco retailer measures for each participant’s residential and activity locations: counts (i.e., the number of retailers in a defined area), and proximity (i.e., the distance separating a location from the nearest tobacco retailer). In this paper, the activity space was defined as the combination of unique residential and out-of-home activity locations. Activity space measures were operationalized as the mean number of, or proximity to, tobacco retailers across locations, as done in similar studies.[41 42]
Tobacco retailer counts
Tobacco retailer counts were computed within 500-meter pedestrian road-network buffers anchored on each location. This distance, which corresponds approximately to a five-minute walk, has previously been used to study the tobacco retailer-smoking relationship.[20 21] Counts were chosen over alternative measures of density (eg. counts by surface area) because road-network buffers inherently integrate aspects of accessibility by limiting measures to locations that can be reached within a given distance.[31] For each participant, we (a) counted tobacco retailers within the residential buffer, and (b) computed the mean number of tobacco retailers across unique residential and activity buffers. For example, if a participant had 3, 2, and 10 tobacco retailers in her
8
home, study, and work buffers respectively, her activity space measure was 5. Residential and activity space counts were categorized into tertiles based on their respective distribution: 1 retailer or fewer (low counts), 2-5 retailers, and 6 retailers or more (high) for residential counts, and means of fewer than 4 retailers (low), 4 to 7.9 retailers (medium), and 8 retailers or more (high) for activity space counts. Tobacco retailer proximity
Tobacco retailer proximity was defined as (a) the shortest pedestrian road-network distance separating the residential location from the nearest tobacco retailer (residential proximity), and (b) the mean of distances separating each participant’s residential and activity locations from the closest tobacco retailer (activity space proximity). Since residential and mean activity space proximity measures were similarly distributed, they were categorized into three groups: more than 350m (low proximity), 150m-350m (medium), and less than 150m (high).
Area-level deprivation was examined as a potential confounder of the tobacco retailer-smoking association. Deprivation was operationalized as the Pampalon relative material deprivation index combining 2006 Census data on education, employment status, and income extracted at the dissemination area (DA) scale, the smallest administrative unit at which Census data is available.[43] Scores were aggregated within each buffer, and weighted proportionally to the population and surface area of any DA overlap. Residential and mean activity space deprivation scores were classified into four categories based on quartile cutpoints for the distribution across the Greater Montreal Metropolitan region.[32]
Statistical analyses
Given the high smoking prevalence in our sample (22.8%), adjusted prevalence ratios and 95% confidence intervals contrasting smokers and non-smokers were estimated using log-binomial
9
regression.[44] Generalized estimating equations with an exchangeable correlation matrix were fitted to account for potential clustering given the nested sampling frame (with 35 to 71 participants per CLSC territory). Analyses were performed with SPSS v.19.0.
The association between each tobacco retailer measure and smoking was modelled separately for the residential neighbourhood and activity space. Adjusted models included the individual-level covariates age, sex, occupational status, and educational attainment. Tests for linear trend across categories of tobacco retailer measures were carried out by modeling tertiles as continuous variables. To compare models’ goodness-of-fit, we present the quasi-likelihood under the independence model criterion (QICu) statistic, with smaller QICu values considered indicative of better model fit.[45] Sensitivity analyses using alternative expressions of activity space measures (the sum and maximum counts and minimum proximity across locations), as well as counts aggregated within 800-meter buffers, were performed.
RESULTS
Of the 2,093 young adults who completed the questionnaire, 37 were excluded because their main work or study location was outside the Greater Montreal Metropolitan Region. This exclusion criterion sought to ensure that the sample would closely represent the spatial behaviour of respondents more likely to experience the study territory on a daily basis. An additional 62 participants were excluded because no residential buffer zone could be created (n=2), due to insufficient details to geocode their activity locations (n=26), or due to missing values for smoking status (n=10) and/or occupational status (n=19) and/or educational attainment (n=10). Compared to the analysis sample (n=1,994), excluded participants were more likely to be exclusively in employment and to conduct activities in areas that were characterized, on average, by higher tobacco retailer counts and higher disadvantage (data not shown).
10 The sample was 56.9% women and mean age was 21.5 years (SD 2.3) (Table 1). Smokers composed 22.8% of the sample. They were more likely to be male, of lower educational attainment, and non-students compared to non-smokers. A significantly higher proportion of smokers than non-smokers lived and conducted activities in areas characterized by high tobacco retailer counts and proximity. While smokers were more likely to conduct activities in areas which were, on average, more disadvantaged compared to non-smokers, no significant difference was found for residential deprivation level. Table 1. Descriptive Statistics for 1,994 Young Adults From the ISIS Project (Montreal, Canada, 2011-2012), Full Sample and by Smoking Status Full sample (n=1,994) Smokers 22.8% (n=454) Non-smokers 77.2% (n=1,540) Individual-level characteristics Women, % (n)* 56.9 (1,135) 52.4 (238) 58.2 (897) Age, mean (SD)* 21.5 (2.3) 21.6 (2.3) 21.4 (2.3) Educational attainment, % (n)* Secondary school or less 16.3 (326) 26.4 (120) 13.8 (212) CEGEP/Trade school 39.5 (787) 39.4 (179) 39.1 (602) University 44.2 (881) 34.1 (155) 47.1 (726) Occupational status, % (n)* Not in education and not employed 7.5 (150) 9.9 (45) 6.8 (105) Student (and employed or not) 70.5 (1,405) 64.1 (291) 72.3 (1,114) Employed only 22.0 (439) 26.9 (118) 20.8 (321) Daily smoker, % (n) 43.0 (195) N.A. Occasional smoker, % (n) 57.0 (259) N.A. Contextual characteristics – residential neighbourhood Tobacco retailer counts, % (n)* 0 – 1 (low) 33.7 (671) 25.3 (115) 36.1 (556) 2 – 5 (medium) 31.3 (624) 29.5 (134) 31.8 (490) 6+ (high) 35.1 (699) 45.2 (205) 32.1 (494) Tobacco retailer proximity, % (n)* >350 m. (low) 33.7 (671) 28.2(128) 35.3 (543) 150 – 350m. (medium) 35.5 (708) 38.3 (174) 34.7 (534) <150 m. (high) 30.8 (615) 33.5 (152) 30,1 (463) Material deprivation level, % (n) Least 20.0 (399) 17.8 (81) 20.6 (318) Medium-low 28.0 (558) 28.2 (128) 27.9 (430) Medium-high 30.6 (610) 34.6 (157) 29.4 (453) Highest 21.4 (427) 19.4 (88) 22.0 (339) Contextual characteristics – activity space Mean tobacco retailer counts, % (n)* 0 – 4 (low) 32.1 (641) 26.4 (120) 33.8 (521) 4 – 7.9 (medium) 33.9 (676) 34.8 (158) 33.6 (518)
11 8+ (high) 34.0 (677) 38.8 (176) 32.5 (501) Mean tobacco retailer proximity, % (n)* >350 m. (low) 27.5 (548) 20.9 (95) 29.4 (453) 150 – 350 m. (medium) 44.0 (878) 45.2 (205) 43.7 (673) <150 m. (high) 28.5 (568) 33.9 (154) 26.9 (414) Mean deprivation level, % (n)* Least 16.0 (319) 13.4 (61) 16.8 (258) Medium-low 39.8 (793) 38.3 (174) 40.2 (619) Medium-high 35.2 (702) 40.7 (185) 33.6 (517) Highest 9.0 (180) 7.5 (34) 9.5 (146) An asterisk (*) is indicative of a statistically significant difference between smokers and non-smokers (P < 0.05).
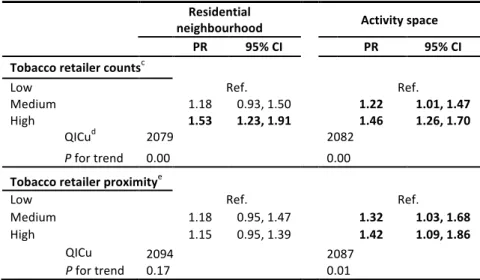
12 Most activity spaces included a place of study or main employment, but also grocery shopping destinations, and sports and leisure locations (Table 2). Table 2: Percent participants whose activity space included each type of activity Type of activity Full sample % (n) Residence 100 (1,994) Studies 69.6 (1,388) Main employment 52.5 (1,046) Secondary employment 6.8 (136) Main grocery shopping 31.0 (618) Secondary grocery shopping 14.9 (297) Sports/physical activity 42.7 (851) Leisure activity 32.3 (645) Other activity 1 22.0 (440) Other activity 2 5.4 (107) Prevalence ratios for smoking by categories of residential and mean activity space tobacco retailer counts are shown in Table 3 (upper half). High numbers of retailers in the residential area and activity space were associated with an increased prevalence of smoking. Participants encountering 6 tobacco retailers or more in their residential neighbourhood or a mean of 8 retailers or more in their activity space were respectively 53% and 46% more likely to be smokers compared to those exposed to fewer retailers. Trends were statistically significant. Goodness-of-fit statistics suggested the residential model was slightly better than the activity space one. Proximity models are also shown in Table 3 (bottom half). Residential proximity to a tobacco retailer was not associated with smoking, whereas medium (150m-350m) and high (<150m) mean proximity in the activity space were respectively associated with prevalence ratios of 1.32 (95% CI: 1.03-1.68) and 1.42 (95% CI: 1.09-1.86) compared to low mean proximity. The activity space model showed the strongest associations with smoking, a statistically significant trend, and had a better fit compared to
13
the residential model. Adjusting for deprivation did not change the associations between tobacco retailer counts or proximity and smoking (data not shown). In all fully adjusted models, increasing age was associated with a higher likelihood of being a smoker. An educational gradient was also found, with decreasing educational attainment associated with an incrementally higher smoking prevalence (data not shown.) Table 3: Adjusteda Prevalence Ratios and 95% Confidence Intervals for the Association Between Tobacco Retailer Counts and Proximity in the Residential Neighbourhood and Activity Spaceb and Smoking Status Among 1,994 Participants From the ISIS Study (Montreal, Canada, 2011-2012)
neighbourhood Residential Activity space
PR 95% CI PR 95% CI
Tobacco retailer countsc
Low Ref. Ref.
Medium 1.18 0.93, 1.50 1.22 1.01, 1.47 High 1.53 1.23, 1.91 1.46 1.26, 1.70
QICud 2079 2082
P for trend 0.00 0.00
Tobacco retailer proximitye
Low Ref. Ref.
Medium 1.18 0.95, 1.47 1.32 1.03, 1.68 High 1.15 0.95, 1.39 1.42 1.09, 1.86 QICu 2094 2087 P for trend 0.17 0.01 a All models are adjusted for individual-level variables age, sex, occupational status, and educational attainment. b For 85 participants (4.3%), the activity space corresponded to the residential neighbourhood because they had answered not conducting any of the inquired activities (n=53) or they only conducted activities at home (n=32). c Categories for residential counts are low: 0-1 retailer; medium: 2-5 retailers; high: 6 retailers or more. For mean activity space counts, categories are: low: 0-4 retailers; medium: 4-7.9 retailers; high: 8 retailers or more. d Goodness of fit statistic. e Categories for residential and mean activity space proximity are low: more than 350m; medium: 150m-350m; high: less than 150m. CI, confidence interval; PR, prevalence ration; QICu, Quasi-likelihood under the independent model criterion. DISCUSSION
14
We investigated the association between the number and proximity of tobacco retailers in the residential neighbourhood and activity space and smoking status among young adults. To our knowledge, this study is the first to consider individuals’ activity space when examining contextual correlates of smoking. It addresses shortcomings related to the common focus on single, usually residential or school neighbourhoods in contextual studies of smoking,[46] and fills an important gap regarding risk factors for smoking among young adults.[47] Consistent with other studies,[8-10 14] we found that living in a neighbourhood with a large number of tobacco retailers was associated with smoking. Unlike in one study showing that individuals with the best access (measured as driving time to the closest tobacco retailer) had higher odds of being smokers compared to those with the worst access,[19] we did not find a statistically significant association between residential proximity and smoking. Unlike this latter study, we also did not observe a confounding effect of neighbourhood deprivation. This is probably due to the lack of an association between the highest level of residential deprivation and smoking in our sample (Cf. Table 1), despite the fact that tobacco retailers tended to be more concentrated in more disadvantaged residential neighbourhoods (data not shown).
Our study is innovative in its consideration of individuals’ regular activity settings, including their residential area, and responds to calls to examine whether smoking is related to tobacco retailer availability not only in residential neighbourhoods, but also where people spend time.[19] We found that the mean number of, and proximity to, tobacco retailers in the activity space were significantly associated with smoking. Clear gradients were observed, with increasing mean counts or proximity being increasingly strongly associated with the likelihood of smoking. These findings were robust across definitions of retailer availability in the activity space. In sensitivity analyses, we found the highest tertiles of the sum and maximum number of tobacco retailers in the activity space to be associated with smoking (PR and 95% CI of 1.33 (1.10, 1.62) and 1.36 (1.14, 1.63) respectively) (data
15 not shown). High proximity, measured as the minimum distance separating any residential or activity location from the closest tobacco retailer, was also associated with smoking (PR and 95% CI of 1.47 (1.23, 1.75)) (data not shown). Retailer counts and proximity may influence smoking through similar, but also distinct, mechanisms. Generally, in addition to providing opportunities for purchasing cigarettes, tobacco retailers may tempt smokers through provision of visual cues and point-of-purchase advertisement. Two recent studies have suggested that the mere sight of a tobacco retailer could result in an impulse to buy cigarettes or to smoke.[22 23] In addition, the sight of smokers gathering in proximity to retailers could trigger contagion or normalization effects.[18] High retailer counts may be more specifically indicative of a more price-competitive market, as well as of smoking being more socially acceptable as a practice,[7 48] while proximity lowers the travel costs of smoking.[49] These putative mechanisms linking tobacco retailer availability and smoking have mostly been discussed with regards to residential and school neighbourhoods, but they could also be at play in other settings, as individuals go about their daily activities.[19 23]
Interestingly the number of tobacco retailers in the residential area seemed more important for smoking than residential proximity, while in the activity space both retailer measures were significantly associated with smoking. This could potentially be explained by the differential depth of knowledge people usually have of their residential neighbourhood compared to their regular activity settings. People tend to have strong knowledge of the diversity of resources found in their residential neighbourhood due to time spent there and to their home being the main anchor from which most trips to other destinations originate.[50] They may thus be more aware of the overall availability of tobacco retailers from which to purchase cigarettes, therefore not necessarily relying on the one closest to home. On the other hand, the areas where regular activities are performed may be more or less thoroughly known to individuals, supporting the idea that both the number of
16
retailers and their proximity, or “how close one gets to a tobacco retailer” in the course of daily activities, may act as a trigger for smoking or a deterrent to quitting.
Overall, our findings suggest that (1) focusing exclusively on the residential area only partially informs us of the link between tobacco retailers and smoking, and (2) other significant places of exposure merit consideration in contextual studies of smoking. Our findings further provide support to recent discussions on zoning policies limiting the sale of tobacco products at large, including in employment or leisure activity nodes.[19 51]
An important strength of our study lies in its focus on young adults involved in a variety of combinations of study, work, shopping, and leisure activities, rather than a more narrow focus on “students” and their place of study, or “workers” and their workplace. This makes our findings generalizable to a heterogeneous young adult population. Several sensitivity analyses were performed, including aggregating retailer counts within 800-meter buffers and limiting our sample to those for whom more than 80% of activity locations were successfully geocoded, and results were found to be robust across model specifications.
Our study is limited in its cross-sectional design, preventing us from making causal claims regarding the links between tobacco retailers and smoking. Given the relatively low response proportion (37.6%) we also cannot discount the possibility that selection bias affected our results since non-respondents were more likely to be men and to live in the highest quartile of deprivation than respondents. Selective daily mobility bias, whereby residual confounding by unmeasured characteristics of young adults which are related to both smoking and exposure to tobacco retailers in the activity space would explain the associations we observed, could also be at play.[52] This is, however, unlikely, since the activity space questionnaire assessed routine activities which had no direct link with smoking. It did not include secondary activities such as visits to the convenience
17
store where 83.3% of smokers in our sample purchased their cigarettes. Although grocery stores sell cigarettes, most activity locations were unlikely to be tobacco retailers. In this paper, we defined activity spaces as the combination of both home and out-of-home activity locations.[28] This resulted in 4.3% of participants with an activity space equivalent to their residential neighbourhood, which could have led to part of the activity space-smoking associations to be attributable to residential exposure. However, in analyses excluding these participants, results were not found to differ, supporting the importance of the non-residential context for smoking. The sole reliance on a secondary database to locate tobacco retailers is a limitation in that it excluded other potentially important cigarette purchasing sources such as contraband. However, given that tobacco retailers may not only influence smoking through purchase-related mechanisms, not considering contraband is unlikely to have influenced our findings.
We also could not verify that all outlets actually sold cigarettes. Relying on a provincial register of tobacco retailers might have been more reliable. Finally, we operationalized the activity space as a non-contiguous space without considering the routes connecting respondents’ activity locations and along which they may encounter tobacco retailers. This was done because regular activity spaces are more likely be composed of a combination of daily life nodes rather than being continuous, and since there may be more regularity in the places where people conduct activities than in the paths used to travel between them.[53]
CONCLUSION
This study extends knowledge regarding the association between tobacco retailer availability and smoking, and adds much needed evidence to the limited literature regarding smoking among young adults from the general population, a subgroup which has suffered from a lack of attention in tobacco research and policy.[47] Moving beyond the more traditional work on residential neighbourhoods, our findings suggest that both the residential and activity space contexts, as well as
18
measures of counts and proximity, should be considered when investigating contextual correlates of smoking. Although further research is required to disentangle causal pathways, selection processes, as well as which activity setting is most relevant for smoking, we recommend that individuals’ activity space be accounted for in future research on the influence of context on smoking as it may be particularly insightful when targeting action on settings.
19 REFERENCES 1. Health Canada. Canadian Tobacco Use Monitoring Survey (CTUMS) 2012. Secondary Canadian Tobacco Use Monitoring Survey (CTUMS) 2012 2013-10-01 2012. http://www.hc-sc.gc.ca/hc-ps/tobac-tabac/research-recherche/stat/ctums-esutc_2012-eng.php. 2. Centers for Disease Control and Prevention. Early Release of Selected Estimates Based on Data From the 2012 National Health Interview Survey - Current smoking. In: National Center for Health Statistics, ed. Atlanta, GA, 2013. 3. Office for National Statistics. Chapter 1 - Smoking (General Lifestyle Survey Overview - a report on the 2011 General Lifestyle Survey). United Kingdom: Office for National Statistics, 2013. 4. Jha P. Avoidable global cancer deaths and total deaths from smoking. Nat Rev Cancer 2009;9(9):655-64 doi: 10.1038/nrc2703[published Online First: Epub Date]|. 5. Breslau N, Peterson EL. Smoking cessation in young adults: age at initiation of cigarette smoking and other suspected influences. Am J Public Health 1996;86(2):214-20 doi: 10.2105/ajph.86.2.214[published Online First: Epub Date]|. 6. Cohen JE, Anglin L. Outlet density: a new frontier for tobacco control. Addiction 2009;104(1):2-3 doi: 10.1111/j.1360-0443.2008.02389.x[published Online First: Epub Date]|. 7. Chaiton MO, Mecredy GC, Cohen JE, Tilson ML. Tobacco Retail Outlets and Vulnerable Populations in Ontario, Canada. International Journal of Environmental Research and Public Health 2013;10(12):7299-309 doi: 10.3390/ijerph10127299[published Online First: Epub Date]|. 8. Pokorny SB, Jason LA, Schoeny ME. The relation of retail tobacco availability to initiation and continued smoking. J Clin Child Adolesc Psychol 2003;32(2):193-204 doi: 10.1207/S15374424JCCP3202_4[published Online First: Epub Date]|. 9. Novak SP, Reardon SF, Raudenbush SW, Buka SL. Retail tobacco outlet density and youth cigarette smoking: a propensity-modeling approach. Am J Public Health 2006;96(4):670-6 doi: AJPH.2004.061622 [pii] 10.2105/AJPH.2004.061622[published Online First: Epub Date]|.
20 10. Lipperman-Kreda S, Grube JW, Friend KB. Local tobacco policy and tobacco outlet density: associations with youth smoking. J Adolesc Health 2012;50(6):547-52 doi: 10.1016/j.jadohealth.2011.08.015[published Online First: Epub Date]|. 11. Leatherdale ST, Strath JM. Tobacco retailer density surrounding schools and cigarette access behaviors among underage smoking students. Ann Behav Med 2007;33(1):105-11 doi: 10.1207/s15324796abm3301_12[published Online First: Epub Date]|. 12. Henriksen L, Feighery EC, Schleicher NC, Cowling DW, Kline RS, Fortmann SP. Is adolescent smoking related to the density and proximity of tobacco outlets and retail cigarette advertising near schools? Prev Med 2008;47(2):210-4 doi: 10.1016/j.ypmed.2008.04.008[published Online First: Epub Date]|. 13. Shortt NK, Tisch C, Pearce J, Richardson EA, Mitchell R. The density of tobacco retailers in home and school environments and relationship with adolescent smoking behaviours in Scotland. Tobacco Control 2014 doi: 10.1136/tobaccocontrol-2013-051473[published Online First: Epub Date]|. 14. Li W, Land T, Zhang Z, Keithly L, Kelsey JL. Small-area estimation and prioritizing communities for tobacco control efforts in Massachusetts. Am J Public Health 2009;99(3):470-9 doi: 10.2105/AJPH.2007.130112[published Online First: Epub Date]|. 15. Chaiton M, Mecredy G, Rehm J, Samokhvalov A. Tobacco retail availability and smoking behaviours among patients seeking treatment at a nicotine dependence treatment clinic. Tobacco Induced Diseases 2014;12(1):19 16. Cantrell J, Pearson JL, Anesetti-Rothermel A, Xiao H, Kirchner TR, Vallone D. Tobacco Retail Outlet Density and Young Adult Tobacco Initiation. Nicotine & Tobacco Research 2015 doi: 10.1093/ntr/ntv036[published Online First: Epub Date]|. 17. Cantrell J, Anesetti-Rothermel A, Pearson JL, Xiao H, Vallone D, Kirchner TR. The impact of the tobacco retail outlet environment on adult cessation and differences by neighborhood
21 poverty. Addiction 2015;110(1):152-61 doi: 10.1111/add.12718[published Online First: Epub Date]|. 18. Young-Wolff KC, Henriksen L, Delucchi K, Prochaska JJ. Tobacco Retailer Proximity and Density and Nicotine Dependence Among Smokers With Serious Mental Illness. American Journal of Public Health 2014;104(8):1454-63 doi: 10.2105/ajph.2014.301917[published Online First: Epub Date]|. 19. Pearce J, Hiscock R, Moon G, Barnett R. The neighbourhood effects of geographical access to tobacco retailers on individual smoking behaviour. J Epidemiol Community Health 2009;63(1):69-77 doi: 10.1136/jech.2007.070656[published Online First: Epub Date]|. 20. Reitzel LR, Cromley EK, Li Y, et al. The effect of tobacco outlet density and proximity on smoking cessation. Am J Public Health 2011;101(2):315-20 doi: 10.2105/AJPH.2010.191676[published Online First: Epub Date]|. 21. Halonen JI, Kivimaki M, Kouvonen A, et al. Proximity to a tobacco store and smoking cessation: a cohort study. Tob Control 2013 doi: 10.1136/tobaccocontrol-2012-050726[published Online First: Epub Date]|. 22. Burton S, Hoek J, Nesbit P, Khan A. “Smoking is bad, it's not cool…yet I'm still doing it”: Cues for tobacco consumption in a ‘dark’ market. Journal of Business Research (0) doi: http://dx.doi.org/10.1016/j.jbusres.2015.03.004%5Bpublished Online First: Epub Date]|. 23. Kirchner TR, Cantrell J, Anesetti-Rothermel A, Ganz O, Vallone DM, Abrams DB. Geospatial Exposure to Point-of-Sale Tobacco: Real-Time Craving and Smoking-Cessation Outcomes. Am J Prev Med 2013;45(4):379-85 24. Lipperman-Kreda S, Morrison C, Grube JW, Gaidus A. Youth activity spaces and daily exposure to tobacco outlets. Health & Place 2015;34(0):30-33 doi: http://dx.doi.org/10.1016/j.healthplace.2015.03.013%5Bpublished Online First: Epub Date]|.
22 25. Côté J, Bynner JM. Changes in the transition to adulthood in the UK and Canada: the role of structure and agency in emerging adulthood. Journal of Youth Studies 2008;11(3):251-68 doi: 10.1080/13676260801946464[published Online First: Epub Date]|. 26. Rainham D, McDowell I, Krewski D, Sawada M. Conceptualizing the healthscape: contributions of time geography, location technologies and spatial ecology to place and health research. Soc Sci Med 2010;70(5):668-76 doi: 10.1016/j.socscimed.2009.10.035[published Online First: Epub Date]|. 27. Skelton T. Young People's Urban Im/Mobilities: Relationality and Identity Formation. Urban Studies 2013;50(3):467-83 doi: 10.1177/0042098012468893[published Online First: Epub Date]|. 28. Golledge RG, Stimson RJ. Activities in time and space. Spatial behavior : a geographic perspective. New York: Guilford Press, 1997: 620 p. 29. Flamm M, Kaufmann V. Operationalising the Concept of Motility: A Qualitative Study. Mobilities 2006;1(2):167-89 doi: 10.1080/17450100600726563[published Online First: Epub Date]|. 30. Kwan MP. The Uncertain Geographic Context Problem. Annals of the Association of American Geographers 2012;102(5):958-68 doi: 10.1080/00045608.2012.687349[published Online First: Epub Date]|. 31. Sherman JE, Spencer J, Preisser JS, Gesler WM, Arcury TA. A suite of methods for representing activity space in a healthcare accessibility study. Int J Health Geogr 2005;4:24 doi: 10.1186/1476-072X-4-24[published Online First: Epub Date]|. 32. Frohlich KL, Shareck M, Vallée J, et al. Cohort Profile: The Interdisciplinary Study of Inequalities in Smoking (ISIS). International Journal of Epidemiology 2015 doi: 10.1093/ije/dyv036[published Online First: Epub Date]|. 33. Shareck M, Kestens Y, Gauvin L. Examining the spatial congruence between data obtained with a novel activity location questionnaire, continuous GPS tracking, and prompted recall surveys.
23 Int J Health Geogr 2013;12(1):40 doi: 10.1186/1476-072X-12-40[published Online First: Epub Date]|. 34. DMTI Spatial Inc. Enhanced Points of Interest [computer file]. Markham, Ontario: DMTI Spatial Inc., 2011v.3. 35. Clary CM, Kestens Y. Field validation of secondary data sources: a novel measure of representativity applied to a Canadian food outlet database. Int J Behav Nutr Phys Act 2013;10(1):77 doi: 10.1186/1479-5868-10-77[published Online First: Epub Date]|. 36. Wong SL, Shields M, Leatherdale S, Malaison E, Hammond D. Assessment of validity of self-reported smoking status. Health Reports 2012;23(1) 37. Institut National de Santé Publique du Québec. Les inégalités sociales de santé en matière de tabagisme et d’exposition à la fumée de tabac dans l’environnement au Québec. In: Québec Gd, ed. Quebec, 2012:69 p. 38. Kestila L, Koskinen S, Martelin T, et al. Determinants of health in early adulthood: what is the role of parental education, childhood adversities and own education? Eur J Public Health 2006;16(3):306-15 doi: 10.1093/eurpub/cki164[published Online First: Epub Date]|. 39. Statistics Canada. CÉGEP. Secondary CÉGEP 2008-12-01 2008. http://www.statcan.gc.ca/pub/81-004-x/def/4068720-eng.htm. 40. Batch Géocodeur. Secondary 2007. http://www.batchgeocodeur.mapjmz.com/. 41. Vallée J, Shareck M, Kestens Y, K.L. F. Accès aux ressources et santé mentale à Montréal. L’importance de la mobilité quotidienne. Métropolitiques 2 juin 2014 42. van Heeswijck T, Paquet C, Kestens Y, Thierry B, Morency C, Daniel M. Differences in associations between active transportation and built environmental exposures when expressed using different components of individual activity spaces. Health & Place 2015;33(0):195-202 doi: http://dx.doi.org/10.1016/j.healthplace.2015.03.003%5Bpublished Online First: Epub Date]|.
24 43. Pampalon R, Raymond G. A deprivation index for health and welfare planning in Quebec. Chronic Dis Can 2000;21(3):104-13 44. McNutt LA, Wu C, Xue X, Hafner JP. Estimating the relative risk in cohort studies and clinical trials of common outcomes. Am J Epidemiol 2003;157(10):940-3 doi: 10.1093/aje/kwg074[published Online First: Epub Date]|. 45. Pan W. Akaike's information criterion in generalized estimating equations. Biometrics 2001;57(1):120-5 46. Shareck M, Frohlich KL. Rethinking exposure in area studies on social inequities in smoking in youth and young adults In: Stock C., Ellaway A., eds. Neighbourhood Structure and Health Promotion New York: Elsevier, 2013. 47. Backinger CL, Fagan P, Matthews E, Grana R. Adolescent and young adult tobacco prevention and cessation: current status and future directions. Tob Control 2003;12 Suppl 4(90004):IV46-53 doi: 10.1136/tc.12.suppl_4.iv46[published Online First: Epub Date]|. 48. Pearce J, Barnett R, Moon G. Sociospatial inequalities in health-related behaviours: Pathways linking place and smoking. Progress in Human Geography 2011;36(1):3-24 doi: 10.1177/0309132511402710[published Online First: Epub Date]|. 49. Schneider JE, Reid RJ, Peterson NA, Lowe JB, Hughey J. Tobacco outlet density and demographics at the tract level of analysis in Iowa: implications for environmentally based prevention initiatives. Prevention science : the official journal of the Society for Prevention Research 2005;6(4):319-25 doi: 10.1007/s11121-005-0016-z[published Online First: Epub Date]|. 50. Reginster I, Edward G. The concept and implementation of perceptual regions as hierarchical spatial units for evaluating environmental sensitivity. Journal of the Urban and Regional Information Systems Association 2001;13(1):5-16 51. Pearson AL, van der Deen FS, Wilson N, Cobiac L, Blakely T. Theoretical impacts of a range of major tobacco retail outlet reduction interventions: modelling results in a country with a
25 smoke-free nation goal. Tobacco Control 2014 doi: 10.1136/tobaccocontrol-2013-051362[published Online First: Epub Date]|. 52. Chaix B, Meline J, Duncan S, et al. GPS tracking in neighborhood and health studies: a step forward for environmental exposure assessment, a step backward for causal inference? Health Place 2013;21(0):46-51 doi: 10.1016/j.healthplace.2013.01.003[published Online First: Epub Date]|. 53. Chaix B, Kestens Y, Perchoux C, Karusisi N, Merlo J, Labadi K. An interactive mapping tool to assess individual mobility patterns in neighborhood studies. Am J Prev Med 2012;43(4):440-50 doi: 10.1016/j.amepre.2012.06.026[published Online First: Epub Date]|.
26 Funding: This work was supported by a CIHR operating grant #DCO150GP. Competing Interests: The authors have no competing interests. Contributorship Statement: MS conceptualized the study, analyzed the data, interpreted the results and wrote the manuscript. YK, JV, GD and KF contributed to conceptualizing the study, interpreting the results and read several versions of the manuscript. Data sharing: Data are available to bona fide researchers from the investigators upon request. Acknowledgements: The authors acknowledge Yuddy Ramos and Benoît Thierry for extracting area-level variables, Tarik Benmarhnia for providing comments on an earlier version of this paper, the ISIS research team as well as participants. MS is a recipient of a Doctoral Research Award from the Canadian Institutes of Health Research (CIHR) in partnership with the Public Health Agency of Canada. KF holds a CIHR New Investigator Award. YK is a recipient of a Young Investigator Award from Fonds de la Recherche du Québec en Santé. Thus work was supported by a CIHR operating grant #DCO150GP.