HAL Id: hal-01482317
https://hal.archives-ouvertes.fr/hal-01482317
Submitted on 3 Mar 2017HAL is a multi-disciplinary open access archive for the deposit and dissemination of sci-entific research documents, whether they are pub-lished or not. The documents may come from teaching and research institutions in France or abroad, or from public or private research centers.
L’archive ouverte pluridisciplinaire HAL, est destinée au dépôt et à la diffusion de documents scientifiques de niveau recherche, publiés ou non, émanant des établissements d’enseignement et de recherche français ou étrangers, des laboratoires publics ou privés.
Céline Perherin, Catherine Meur-Ferec, Yann Deniaud
To cite this version:
Céline Perherin, Catherine Meur-Ferec, Yann Deniaud. Coastal hazards mapping:
which obstacles prevent the stakeholders from reaching a consensus?.
FLOOD-risk 2016 - 3rd European Conference on Flood Risk Management, Oct 2016, Lyon,
France. http://www.e3s-conferences.org/articles/e3sconf/abs/2016/02/contents/contents.html, �10.1051/e3sconf/20160720012�. �hal-01482317�
Coastal hazards mapping: which obstacles prevent the stakeholders from
reaching a consensus?
Céline Perherin1,2,a, Catherine Meur-Ferec1 and Yann Deniaud2
1Univ Brest, CNRS, LETG Brest GEOMER, IUEM, 29280, Plouzane, France 2Cerema, Technical Division for Water, and Waterways, 29280, Plouzane, France
Abstract. The development of risks prevention plans frequently causes lively debates between state services (which
conduct risks prevention plans and prior hazards studies) and relevant territorial authorities. The development of coastal risks prevention plans, identified as priorities after Xynthia storm in 2010, also faced hard difficulties. Debates mostly concerned coastal hazards mapping process, realized before the plans which strongly depend of them. A questionnaire survey of state services focuses on around sixty coastal hazards studies, concerning coastal flooding, coastline recession and sand dunes migration. The results define territories characteristics (current issues in territory and future territorial development), technical studies characteristics, project management and dialogue process between stakeholders. Chi-square tests of independence highlight major causes to encountered difficulties during dialogue process about coastal hazards mapping process. Current issues in territory don’t generate difficulties. However, territories with a high development and where prevention plans could bring constraints are places of conflicts about coastal hazards maps. Encountered difficulties during hazards mapping participatory process is also correlated to the complexity level of studies.
1 Introduction
Major coastal floods in Pays de la Loire and Poitou-Charente regions during Xynthia storm on the 28th of February 2010 induced a serious awareness of accumulated delay in coastal risks prevention policy. The regulatory tools of natural risks prevention policy were available, particularly with the central tool of risks prevention plan (PPR). But the numerical targets of plans gave priority to areas concerned by floods from overflowing rivers to the detriment of areas concerned by coastal hazards (coastal flooding, coastline recession and sand dunes migration) [1-4]. After Xynthia storm, 303 municipalities were identified to realise coastal risks prevention plans1, given the priority to coastal areas. However, since 2011, prevention plans development on French territory has brought to light many local conflicts, revealing difficulties in dialogue process, but possibly intensified by a simultaneous realisation (61 coastal PPR were in progress in 2012). These strong debates mainly concern the study of natural phenomena which is the first stage to elaborate these documents. The PPR development and the coastal hazards mapping process, whatever the hazard was, has always been a source of 1 Identified in the ministerial circular of the 2nd of august 2011 relative to the municipalities identified as priorities to develop coastal risks prevention plans. The PPR must be realised in the delay time of 3 years, which can be extended by 18 months.
lively discussions between the French State, which conducts the PPR, and the territorial authorities, associated to the preparation of the document. The reasons cited to explain this observation are various : « impossible territorialization » [5] due to the complexity to locally translate some principles of a single field in integrated solutions adapted to a territory, unsuitable participatory process2 …
This article analyses the modalities of coastal hazards mapping process in these primary coastal PPR, at the end of their preparation. The current reflections are based on an exhaustive qualitative and quantitative survey, on a bibliographical study and on a 10 years professional practice in the coastal risks prevention policy. The objectives are to identify the encountered local difficulties level, to analyse its causes and to evaluate if there is a coastal specificity. The results emphasize sources of blockages, but also levers, which might facilitate to reach a desired consensus, but rarely achieved.
2 The way in which the dialogue process should be conducted has been an object of many reflections, when risks exposure plans (PER) became risks prevention plans (PPR) or during the reflections in the middle of the 2000 conducting to several methodological tools and to the ministerial circular of the 3rd of July 2007 relative to the consultation of the stakeholders, the dialogue process with the population and the territorial authorities during the development of the natural risks prevention plans.
2 Hazards maps produced in the hard
context of PPR
The hazards map represents the physical consequences of natural phenomena. Its analyse is mainly based on physical scientific disciplines. Mapping process a priori establishes a restricted discussion space centring on the performed studies understanding.
This hazards map, crossed with the territory issues map, is used to elaborate the regulatory zoning, which specifies areas which are not buildable and areas where new buildings are subject to prescriptions. The issue is not insignificant for the life of a territory. The cross principles between hazards and issues3 afford a very limited flexibility on the zoning process. Debates focus on upstream stages, mainly on the natural hazards characterisation [6-7]. Thus, the causes of the encountered difficulties during the hazards mapping process are similar to the causes of the encountered difficulties during the zoning process.
The shifted attention to the hazards maps, because of the regulatory issues, focuses on two aspects : the imprecise data, the limits of knowledge, used to weaken the zoning, and the conventional character of some technical hypothesis, highlighting a « reference » hazard which may be discussed. However this last aspect is the less debatable [6-9].
The reasons of the difficulties during prevention plans development and natural hazards mapping process are well known and described in the French4 and international5 bibliography.
The most commonly cited reason to explain these difficulties is the block or the limitation of urban and economic development. This situation may be experienced if the territory suffers of a high land-pressure, if the territory development is already restrained and if the reserves of buildable lands, outside the areas subject to hazards, are limited. The risks prevention plan is often seen only as a constraint, without any positive aspect, altering expected land-use planning, without providing any solutions. This is directly linked to the legal status of the document, which is not a planning document, and has as unique objective natural risks prevention.
Property depreciation (of building land and frame concerned by the zoning) and consequent individual 3 The regulatory zoning directly depends from the hazards level and the issues level (non-urbanised areas, urbanised areas, dense urban centre).
4 The bibliographical analysis considers the mapping process of all natural hazards, which mainly concerned floods from overflowing rivers. These bibliographic references deal with the causes of the difficulties encountered during the hazards mapping process and during the zoning process [1, 2, 5-26].
5 Mainly European and American literature [27-32]. The American analysis mostly focuses on factors influencing the quality of land use plans with respect to natural hazard mitigation. The reasons for the encountered difficulties are consistent with those for a lower quality of the plans.
losses, because of the principle that there is no compensation for public utility easements, make these measures unpopular. They are less accepted when they lead to major gaps, temporal gap (no compensation) or geographical gap. The geographical gap is linked to the line position, stressing a border which often doesn’t correspond to a physical discontinuity, and linked to the line « thickness » [33] related to the working scale, sometimes inadequate compared to the territorial issues.
The encountered difficulties during the prevention plan development may also be linked to a principled position of the territorial authorities which challenge State legitimacy in intervening on a space managed by the local authorities, or to the history of the relationships between State and territorial authorities. A previous participation in an action to reduce risk from natural hazards facilitates plans development.
The understanding of risk concept, linked to the potential occurrence of a low probability phenomenon, may also complicate the debate [34]. Natural hazards perception, including adherence to potential occurrence of an extreme phenomenon, is strongly correlated to the knowledge of a previous hazard occurrence. Major latest event occurrence has a strong impact on this perception. On the opposite, the lack of latest event could cause reconsideration of considered phenomena likelihood. The presence of levees, which prevent from floods, limits this perception as a result of the removal of floods for the frequent hight waters.
During the technical studies to map hazards, studies complexities and uncertainties management are the two major origins of difficulties. The complexity of the studies is multiple: precision needed to study some phenomena, handbooks and ministerial circular interpretation and their territorial application6, terminology, diversity of the collected data, etc. This complexity, sometimes facing a low technical capacity of the municipalities, makes the hazards mapping participatory process difficult. Chosen methodologies are sometimes discussed but uncertainties of the scientific data are mostly debated7. They are more debated when precautionary principle, enshrined in Barnier’s law, is applied. This principle is often locally seen as improperly used and source of disagreements.
Coastal hazards mapping process management, that is communication efforts and quality of dialogue process, also mainly impacts the difficulties level, linked to the capacity to create a « climate of confidence » [9]. Thus dialogue process seems to be a rare lever to limit difficulties encountered with stakeholders.
6 Yves Barel reminds how standards are complicated to apply at a territorial level [35].
7 We here define uncertainties as a lack of knowledge or insufficient knowledge to completely characterize a phenomenon. Thus we use the same terminology as Erne-Heintz [36] indicating links between risk, prevention, uncertainties and precaution. We don’t retain here by uncertainties an event occurrence probability.
3 An exhaustive survey to study
difficulties in dialogue during coastal
hazards studies
3.1 A questionnaire survey on coastal hazards studies
Most coastal hazards studies have been realised before coastal risks prevention plans development (PPRL8), realised under the leadership of the state
services. Whereas a first temptation could have been to focus on some case studies where the level of difficulties was high, we must realise an exhaustive analysis to understand what the origins of the difficulties are.
The progress of PPRL development is followed up at a municipal scale by the Directorate-General of Risks Prevention (DGPR) of the French ministry of Ecology (MEDDE), mainly by means of GASPAR9 database. However, coastal hazards studies and their maps are realised at a scale with homogeneous natural phenomena. They are thus realised on several municipalities. In order to identify all studies realised on French territory before the preparation of the PPRL and to collect detailed characterisation of their development process, a three-step methodology has been conducted.
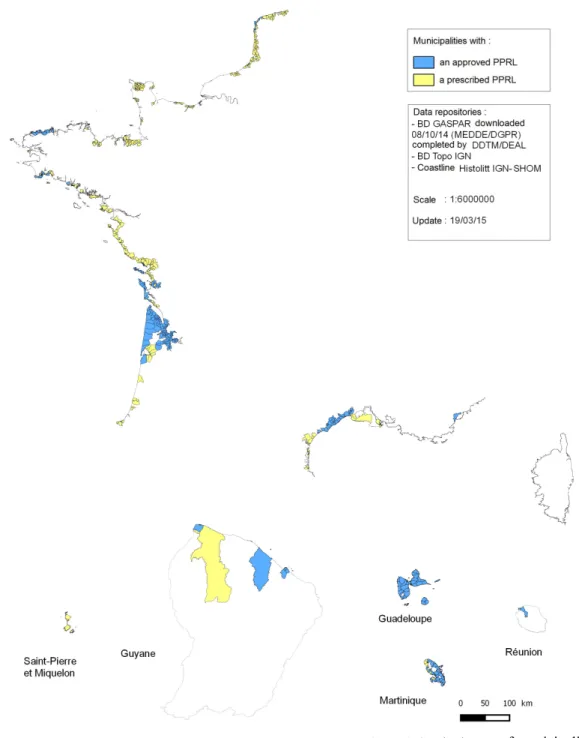
First, an inventory of the municipalities concerned by a PPRL has been established by analysing and validating GASPAR database. The downloaded data at the end of 2014 were consolidated thanks to the territorial state services in the first quarter of 2015 (figure 1).
Then, a municipalities reunification by risk basin was realised to identify 124 coastal hazards studies in France which constitute the studies sample and whose the hazards mapping process must be characterize.
Finally, an on-line questionnaire survey was performed and transmitted to all departmental directorate which conduct these studies and plans (Directions Départementales des Territoires et de la Mer DDTM and Directions de l’Environnement, de l’Aménagement et du Logement des départements d’outre-mer DEAL). The questionnaire content has been structured to collect data to check hypothesis about reasons which may impact the coastal hazards studies development and mapping process. These hypothesis come from a professional practice dedicated to reporting and technical support during coastal hazards mapping process within Cerema. 8 In French these plans are called Plans de Prévention des Risques Littoraux (PPRL). We use here the term PPRL to talk about all risks prevention plans (PPR) including at least one coastal hazard among: coastal flooding, coastline recession and sand dunes migration. We use here the term PPRL to talk about all the area concerned by the development process even if after each municipality is concerned by a unique plan based on an analysis made on a larger territory.
9 Gestion Assistée des Procédures Administratives relatives aux Risques naturels et technologiques: Administrative procedures management relative to natural and technological risks
The result is a situational analysis of the coastal hazards mapping process at the end of the first quarter 2015. 3.2 Chi-square independence tests methodology
The bibliographical analysis, the prior professional practise and the survey results allowed to formulate hypothesis about the reasons explaining the level of difficulties encountered by the state services10 during coastal hazards mapping process. Chi-square independence tests are computed between this level of difficulties and some suspected explanatory variables.
The variables, objects of cross-tabulations, come from several information sources. Some of them come from the questionnaire and others from Sea and Coastline National Observatory database. The choice of the variables is based on types of reasons impacting the level of difficulties identified by the analysis after the survey.
Chi-square independence tests are computed with R software. They determine an independence probability. Thus a 0,05 probability may be understood as 5 % chance to mistake rejecting the independence hypothesis or 95 % chance to be right accepting the dependence hypothesis. Chi-square independence tests are realised without approximation with a random draw, as a result of a low number of individuals in the sample (around forty). Thus the sample is completed on the basis of a distribution law corresponding to the sample.
In the following description of the tests results, a 0,05 probability threshold is chosen to define a high dependence probability (currently used). A 0,15 probability threshold mark the transition from the medium class to the low class, 0,25 from the low class to the very low class (no dependence).
Data relative to territory socio-economic condition mainly come from Sea and Coastline National Observatory database11 managed by Soes12. Tested variables can be divided in two groups : the ones representing current planning issues in territory and the ones representing the issues recently set-up in the territory which reflect future territory development. These indicators are mostly available at a municipal scale (unless otherwise specified). To report all the studied territory, which may concerned several municipalities, these indicators have been aggregated at the PPRL scale: sum for numbers, average and maximum of the considered municipalities for densities and percentages. The maximum may reflect the fact that the level of difficulties could be influenced by the discussions with only one municipalities.
10 Variable from questionnaire. The level of encountered difficulties is according the state services only. It can be: No difficulties, Low difficulties, Difficulties, Many difficulties.
11 http://www.onml.fr/outil-de-cartographie/presentation-de-loutil/
12 Service de l’Observation et des Statistiques du Ministère de l’Écologie, du Développement Durable et de l’Énergie: Observation and statistics department of the Ministry of Ecology.
4
Results from observation of the primary PPRL difficulties according to state services 4.1. A best knowledge of the primary PPRLThe PPRL inventory stresses plenty municipalities where the PPRL is in progress or in revising. Among these ones, half is concerned by a primary PPRL. Most of these studies are posterior to Xynthia storm. Indeed, among the 124 PPRL, 63 have been prescribed since 2010 et 58 included primary municipalities.
Figure 1. Synthesis map of municipalities with a prescribed or approved PPRL in the first quarter 2015
The questionnaire survey return rate is 48 %. 59 PPRL have been described. They are exclusively recent PPRL (none approved before 2010). This result shows the state services loss of memory about previous studies. The questionnaire survey return rate is 84 %, considering after 2004 prescribed PPR. The described PPRL are overall primary PPRL whose hazards studies are sufficiently advanced.
These 59 PPRL tackle very largely coastal flooding (98 % of them), but also coastline recession (60 %) and sand dunes migration (10 %). 58 % of them only tackle coastal hazards (42 % of all 124 PPR), the others also include another hazard, mainly floods from overflowing
rivers (often in estuaries). Their hazards studies were completed for 93 % of them, or nearly completed for the others 7 %, allowing the analysis of the hazards mapping process.
The stakeholders13 involved by the department in charge of PPRL development, DDTM and DEAL, vary from one PPRL to another. Municipalities are systematically involved. But others partners may also be associated according to local issues. Municipalities are the only stakeholders involved in 14 % of cases. The others associated stakeholders are often public inter-municipality cooperation establishments (EPCI) (64 %) and the county council (64 %). May also be involved the chamber of agriculture (39 %), the regional council (36 %), associations (36 %), emergency services (25 %), public institutions (22 %) and authorised water user associations (ASA) (12 %).
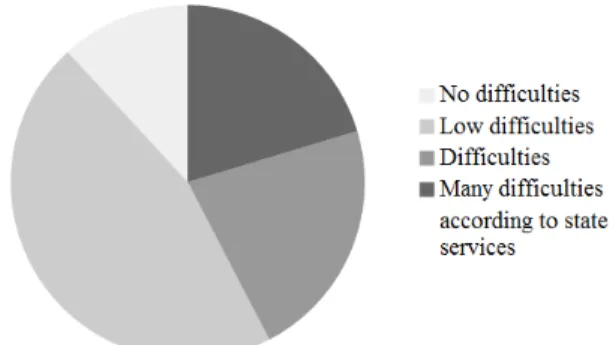
The phasing of the prior studies to the development of the PPRL allows to study specifically the hazards studies. The level of difficulties14 associating stakeholders
during hazards studies, according to the state services, are very various from one territory to another (figure 2). Territories with no difficulty are 12 % of cases. In 46 % of cases, the difficulties are low, in 22 % there are difficulties and in 20 % of cases many difficulties. This difficulties level is not geographically noticeable.
Figure 2. Encountered difficulties level by the state services during dialogue about coastal hazards mapping
The final acceptance level of hazards maps is linked to the level of difficulties encountered during stakeholders association. However, some complicated associations finally concluded with an acceptance of the maps by local stakeholders. 75 % of the hazards maps are accepted. 25 % are rejected according to the state services.
13 Under minister circular of the 3rd July 2007 relative to the consultation of the stakeholders, the dialogue process with the population and the territorial authorities consultation during the development of the natural risks prevention plans.
14 The perceived difficulties are defined by state services from the existence of conflicts about the hazards studies and their complexity level. However a difference between the practical approaches to cooperation, as they have been considered by the state services [37], and expectations of other stakeholders (from information, to appropriation, then to co-construction) may also place the engaged cooperation process in difficulty.
The subjects debates analysis shows that debates mainly focus on coastal flooding, first of all on the hypothesis of protection structure failures, then on the maritime event characterization, finally, and to a lesser extend, on flow spread. Comparing to the numbers of discussions about coastal flooding, a very low number of debates focus on coastline recession, despite a need of complementary analysis as strong as coastal floods.
The hazards characterization debates may start after the regulatory zoning, while the hazards maps first presentations didn’t generate any reactions. These reactions corroborate the regulatory impacts as the major reason to the difficulties cited by bibliography.
4.2 Well-known sources of difficulties and little-known levers
The survey of state services allowing to refine the knowledge of difficulties sources and also to understand the sources of an easier development. The analysis of the survey results and of the bibliography suggests to divide in two categories the factors which explain the difficulties level:
• the exogenous factors relative to the territory context (geographic and societal conditions),
• the endogenous factors relative to the procedure and its technical contents (technical hazards studies realisation and project management).
4.2.1 Exogenous factors
Territory context at the beginning of the PPRL development impacts its progress for several reasons. The limitation of urban and economic territorial development is the first reason cited to explain difficulties encountered by state services. The natural risks sectoral analysis, in the context of the PPR development, indeed doesn’t systematically coincide with territory planning reflections, often anterior to the PPRL development. In numerous cases, the territorial planning project must be reconsidered. Stronger is the territorial development, more the consequences may be significant; and more the territory is constraint (high land-pressure linked to land reserves available apart from flooding areas or others constraint areas), more the territorial planning project is hard to review [30]. Property depreciation (of building land and frame in areas concerned by the zoning) is also cited.
Hazards perception level, often evoked as « risk awareness » impacts the encountered difficulties level. It is generally correlated to recent major event occurrence or to recurring damages. The stakeholders of protected or non-damaged territories are said less « risk conscious ».
The principles of hazards mapping may also constitute a source of difficulties in some observed situations. Some mismatches about acceptable risk threshold lead to debates about the principles defining « reference hazard » (event intensity, prohibited construction behind levees inducing a systematic failure of the protection structures to elaborate the map...).
4.2.2 Endogenous factors
Endogenous factors relative to hazard mapping process concern on the one hand, the studies technical realisation, hazards studies at the first place, and on the other hand, the dialogue process during the PPRL development.
The studies complexity is the first source of difficulties cited by state services, equally over regulatory impacts. This complexity is often increased by limited technical capacity of municipalities and states services. Furthermore, scientific data uncertainties are hard to explain and to understand, and thus a source of debates.
The way the stakeholders are associated also impacts the difficulties level. State services report the positive effect of effort they made by pedagogy, by numbers of meetings and time devoted, by transparency. They also stress the effort the stakeholders made to actively participate to the studies realisation. On the opposite, they report the negative impact about the way they sometimes led the dialogue (schedule management difficulties, lack of municipal technical services association).
Exogenous factors Endogenous factors
Territorial planning issues, future development and regulatory impact - Territorial challenges - Urban and economic future development
- Land-pressure - Property value
Studies technical realisation - Studies complexity - Stakeholders technical capacity - Scientific uncertainties management - Precautionary principle application
Risks and hazards perception - Risk notion
- Natural event occurrence - Presence of protection structures
- Acceptable risk notion and doctrine approval
Project management and dialogue process - Pedagogy
- Schedule management - Transparency level - Stakeholders involvment
Table 1. Synthesis of major factors influencing difficulties level.
Types of encountered difficulties are thus not mainly specific to coastline. However some coastal specificities are identified. Tourist issues and coastal areas attractiveness are often stressed. These issues are close to other attractive areas subject to a high land-pressure. One of the specificities is the type of cooperation process, which staggers the plan development and preliminary realises the hazards maps, opening discussions on this subject. But the main specificity is linked to the hazards nature and to a more complex study as a result of various hydro-sedimentary phenomena, their dynamics, and strong interactions between hazards. This necessitates for all stakeholders, included state services, an additional implication effort to understand and control this complexity.
4.3 Independence tests results Results are synthesised in table 2.
Indicator Dependence probability Independe nce probability Territorial issues
Average population density 199915 Maximum population density in 199915
Population in 1999
Average tourist density (number of beds/km² in 2010)16
Maximum tourist density (number of beds/km² in 2010)16
Average vacation homes rate in 201117
Maximum vacation homes rate in 201117 Very low Very low Very low Very low Very low High High p=0,35 p=0,61 p=0,85 p=0,61 p=0,38 p=0,026 p=0,016 Territorial development
Average migratory balance between 1999 and 200918
Maximum migratory balance between 1999 and 200918
Average building density of accommodations begun in 2009 (build./km²)16
Maximum building density of accommodations begun in 2009 (build./km²)16
Building surface between 1990 and 201216
Average artificial territory rate between 2000 and 2006 (canton)19 Maximum artificial territory rate between 2000 and 2006 (canton)19 Average « Land-pressure » in surface (canton)20 Average « Land-pressure » in value (canton)20 Maximum « Land-pressure » in Very low Medium Very low High Very low Very low Medium Low Low Medium p=0,91 p=0,06 p=0,5 p=0,023 p=0,56 p=0,27 p=0,08 p=0,14 p=0,14 p=0,09
15 Variable from INSEE data, available for all French municipalities
16 Variable from INSEE data, available for all coastal municipalities, except overseas
17 Variable from INSEE data, available for all French municipalities, except overseas
18 Variable from INSEE data, available for all French municipalities, included overseas
19 Variable from MNHN data of 2013 available for all French cantons
20 Variable from SAFER data of 2006 available for all coastal French cantons, except overseas. « For all metropolitan canton, the land-pressure indicator in value is obtained as : the surface of residential or leisure market, multiplied by the average price by hectare or non-building area of this market. This product is then related to the cantonal surface, finally this cantonal ration is divided by the national ration (average value for all metropolitan cantons). Concerning the land-pressure indicator in surface, the indicator is obtained as the residential or leisure market surface related to the canton surface. Then, this cantonal ratio is divided by the national ratio (average surface for all metropolitan cantons). » (Source: SOeS)
surface (canton)20
Maximum « Land-pressure » in value (canton)20
Building lot price (2006-2013) (region)21
Very low
Low
p=0,31 p=0,17 Hazards studies technical realisation
Coastal functioning analysis Coastal flooding mapping methodology
Coastline recession study complexity22
Coastal flooding study complexity22
Coastline recession knowledge reliability 23
Coastal flooding knowledge reliability23
Presence of levees
Presence of protection structures High Medium High Medium Very low Medium Very low High p=0,016 p=0,024 p=0,019 p=0,09 p=1 p=0,13 p=0,49 p=0,002 Studies management and dialogue process
Meetings number Studied territory surface24 Concerned municipalities number Seniority of the person in charge of the file
Time of the first discussions with the partner25 High Very low Low Very low Very low p=0,05 p=0,31 p=0,17 p=0,88 p=0,61
Table 2. Synthesis of correlations with the encountered difficulties level by state services. Chi-square independence tests computed show several correlations with the encountered difficulties level during hazards mapping process. Thus, the biggest difficulties are encountered on territories where the vacation homes rate is high, the migratory balance is elevated, the buildings are dense, the artificial territories rate is high and the « land-pressure » is strong. The difficulties are mainly encountered where the hazards studies are complex, where they don’t start with a coastal functioning analysis, where they use hydraulic modelling in order to characterize coastal flooding, that necessitates to adapt to protection structures presence (levees and dunes), or where results are not fully reliable. The difficulties are noted where there are the most of municipalities concerned and where the number of meetings is elevated.
5 The explaining factors of difficulties
level
21 Variable from SoeS data available for all French regions
22 Variable of « Hazard study complexity » comes from survey results. Modalities can be: Low, Medium, High, Very High.
23 Variable of « knowledge reliability » comes from survey results and is according to state services.
24 Variable from IGN data of 2006 (BD Topo Version ‘Pays’ 1.2)
25 The modalities of the variable « Time of the first discussions » can be: Before the PPR project, At the prescription time of PPR, After PPR prescription.
5.1 Exogenous factors
The difficulties level encountered by state services during stakeholders association have been confronted to several variables relative to the socio-economic context of the territory concerned by the PPRL. Thus, this context is potentially directly impacted by regulatory measures.
5.1.1 Current stakes
One of the reasons cited by state services to explain the encountered difficulties is issues in areas concerned by hazards, in particular because of property depreciation fear or tourist issues. Three variables are tested to appreciate this issues : population, household income and vacation homes rate.
The present population charts some of current issues. Thus the link between the difficulties and population of all the concerned municipalities (not only population directly concerned by hazards) has been tested. However, Chi-square test doesn’t show any dependence between population density or inhabitants number and encountered difficulties. No link has been stressed between tourist density and encountered difficulties. No more difficulties are noted where municipalities are very urbanised. This result, contrary to initial hypothesis, may be explained by several ways. First of all, in the presence of a PPR, regulatory constraints are more important on new buildings. Thus, regulatory constraints introduced by the PPR are lower in urbanised areas. In absence of urbanization extension project, because of a low development or because extensions are not possible any more (very urbanised municipalities or constraint municipalities because of protected natural areas for instance), the little impact of the PPRL on constructibility explains an absence of correlation. Property depreciation fear would have a minimal impact. Recent studies by the way confirm a non-systematic impact of the PPR on property value [38]. Then, this result may also be explained by the fact that more expanded discussions are possible with the most urbanised municipalities, because they often dispose of qualified technical services. These discussions allow to get adequate hazards knowledge or to identify credible planning alternatives. This hypothesis is consistent with Berk’s results [30] which show technical discussions impact. A negative correlation between the plans quality and the population density is stressed where hazards mitigation is optional whereas the correlation is positive where it is mandatory and where mitigation is based on comprehensive technical documentation. However, the present results should be qualified because considered population is the one of all concerned municipalities and is not the one in areas concerned by hazards, introducing a bias. The issues directly concerned by hazards were not possible to analyse in a national assessment. But we may assume that this bias is low because most of issues are currently located close to the sea, in the most attractive area during the last decades, more affected by coastal hazards. Indeed, most of the urbanised territory decreases moving away from the sea [39], although on the coasts, building
areas mainly expanded from former villages generally located out of areas concerned by coastal hazards.
The household income informs on type of population. No link has been shown between this variable and the encountered difficulties. A correlation with the household income, linked to medium home value, could have been explained by a property depreciation fear. The absence of correlation confirms a little influence of this fear. Furthermore it may be assumed that a densification impossibility is wished by the prosperous population, compensating the property depreciation fear, even sometimes surpassing it26.
The vacation homes rate is also a particular issue in coastal municipalities. A high correlation probability has been determined between the difficulties level and vacation homes rate in all municipalities concerned by PPRL (p=0,026 et p=0,016). Vacation homes rate is the only current type of issues for which a correlation has been brought to light with the difficulties level. This result may be explained by the fact that hazards perception is lower in municipalities with a high vacation homes rate because a part of the population is present only a part of the year, mostly in the summer period. It may also be explained by the fact that a vacation homes may also have a financial investment vocation or may be the object of a stronger attachment than the principal living accommodation [40]. Temporary residents capacity to mobilize (association regrouping, legal support...) is also generally important. We also note that municipalities concerned by a high vacation homes rate are additionally the most attractive (correlation with migratory balance) which is presumably the most impacting factor (see under).
5.1.2 Territorial development
We assume that a PPR development, altering all or part of the municipality development, is a source of difficulties, as the survey and the bibliography strongly highlight it. Several indicators depicting recent implanted issues and showing territory development and land-pressure have been exploited.
Chi-square tests bring to light a dependence between encountered difficulties and the maximum migratory balance among concerned municipalities (p=0,06), the maximum building density among concerned municipalities (p=0,025), the maximum artificial territory rate among concerned cantons (p=0,08), the « land-pressure » (canton) (p=0,09) and the building lot price (region) (p=0,17). On the opposite, it shows no dependence with the recent building surface.
These underlined dependences confirm the hypothesis that the difficulties level is correlated to the territory development and its land-pressure. They strengthen the results of previous quantitative analysis [30, 32]27. The 26 Berk’s results [30], considering the impact of medium house values, appear to confirm this analysis. This result is however not systematic [32], showing other factors predominance.
27 Considering indicators as population growth or demand to build on land in hazard areas linked with economic
fact that dependences are mainly underlined with the municipality with the highest development shows that the encountered difficulties with only one municipality influence the all PPRL development. More attractive are the municipalities, and therefore their development is important, higher is the probability to alter all or part of the future expected development. One of the stronger issue is the building land freezing. The loss of constructibility, and property depreciation, generate difficulties during PPR development. The recent building surface is an indicator depicting part of current issues but also dynamic of building. It has also been tested but the test result is not significant. However, if a strong building density testifies of probable absence of large spaces devoted to future development, and therefore of a certain land-pressure level limiting territorial projects room for manoeuvre. A large building surface doesn’t necessary indicate the absence of building areas, which may be out of areas concerned by hazards. Thus the building surface is less relevant than building density, explaining the positive correlation positive with one indicator but not the second.
5.1.3 Hazards and risks perception
Indicators depicting risks and hazards perception are not numerous. The protection structures presence (levees and dunes) may give an impression of security neutralising flooding effects during the most frequent high water level. Chi-square test shows a very strong correlation between protection structures presence and encountered difficulties (p=0,002). The structures presence breaks the link between sea and territory for frequent event and makes the plausibility of flooding occurrence less perceptible. The presence of these structures makes discussions about on failure hypothesis difficult, in particular where they appear in good conditions, often extending the debates on acceptable risk notion. An in-depth analysis of the perception could only repose on a survey. This type of analysis has already shown the influence of perceived risk on planning in the absence of any regulation [30].
5.2 Endogenous factors
5.2.1 Hazards studies technical realisation The hazards studies technical complexity is the most frequent reason cited by state services, equality to regulatory impact, to explain the difficulties level. Chi-square test shows a high dependence probability (p=0,019) between encountered difficulties and technical complexity of the coastline recession study and to a lesser extend with coastal flooding technical study (p=0,09). Other factors, depicting complexity level, have been identified by the survey. Thus, Chi-square test shows a correlation probability between encountered difficulties and estimated coastal flooding knowledge reliability (p=0,13), between encountered difficulties and coastal development.
flooding mapping methodology (p=0,024), or with the protection structures presence (levees and dunes) (p=0,002) and with coastal functioning analysis made prior to hazards mapping (p=0,016).
We logically explain a dependence between hazards studies technical complexity and encountered difficulties. It is linked to the necessity to adapt the method to territory. Indeed there is not a unique hazards mapping method but rather an analysis logic which determines the major physical phenomena and therefore the methodology to apply. In order to properly take into account specific phenomena of the territory or the change of some phenomena inside this territory, the method must be adapted. When the method must strongly be complexified in order to adapt to the territory, the multiplication of encountered difficulties may be explained by :
•
multiplication of possible discussion points because of additional tools integration (formulas, model...) and more numerous uncertainties,• a more difficult methodologies and results appropriation, when studies are complex for all stakeholders, included state services.
The analysis highlights that the difficulties level is lower where the sea level has been projected on topography to characterize coastal flooding compared using numeric modelling. This link may be explained by the fact that a complex mapping method is more difficult to appropriate but also that numerous parameters, which needed to be adjusted, are all potential debates subjects (sea level, amount of water brought by waves, way that built, channels, floodgates, have been taken into account etc.). Similarly, protection structures presence, fallible by principle in a PPR, needs to determinate hypothesis about their failures. This principle however remains hard to translate through numerous hypothesis on failure process : general ruin or breach, breach width, bottom level, localisation, moment of failure, failure mode, etc. These hypothesis, which are often controversial subject, involve an arbitrary part, linked to fallibility principle which is not always accepted. Indeed, two visions face concerning the way to manage the territory linked to two forms of responsibility, one aiming to limit damages limiting stakes exposure and another aiming to protect from hazards by technical solutions [41].
The analysis shows that a low estimated knowledge reliability about coastal flooding hazards studies, with a high uncertainties level, generates several discussions. That comes, on the one hand, from necessity to bring a lot of pieces of information to fill existing knowledge gap and, on the other hand, from a bigger weight decision-making when pieces of knowledge are missing. The application of precautionary principle28 might end potential discussions but very constraining measures application based on unreliable informations may be locally refused, because of social consequences considered as too important [42].
28 Introduced into French Law in 1995 (“Loi Barnier”).
These factors of complexity initiating difficulties could be balanced by hazards studies management. Indeed, the holding of a prior phase to hazards mapping process, the coastal hydro-sedimentary functioning analysis, minimises the encountered difficulties level thanks to a shared diagnosis of territorial physical functioning, of territory changes linked to major events, and thanks to natural phenomena appropriation by all stakeholders.
5.2.2 Hazards studies management and dialogue
The survey stresses the impact of hazards studies project management on encountered difficulties. Several factors depicting the project management have been tested.
Chi-square tests show a dependence of encountered difficulties with the number of municipalities (p=0,17) and the number of meetings (p=005). This result shows encountered difficulties when a big number of partners are brought together in a same committal. The low correlation is also explained by the frequent choice of holding bilateral meetings with municipalities instead of one unique committee. On the opposite to the initial hypothesis which estimated that difficulties would be lower when the meetings were more numerous, because of longer extended debates, the analysis shows that less meetings held when the difficulties level is low. The numerous meetings are mainly a consequence of a tough mapping process rather than an advance strategy.
Chi-square tests don’t show any dependence of encountered difficulties with the time of the first discussions with the partners or seniority of the person in charge of the file. The time of the first discussions doesn’t seem to be a predominant factor on difficulties level, contrary to the initial hypothesis, estimating that a late information limits acceptability [14] and that earlier start the discussions, longer the exchanges duration is. The discussions may indeed possibly extend in time. Seniority of the person in charge of the file, which may have an impact to the to way of PPR development management, is not also a predominant factor.
6 A hazards mapping process marked
by non-technical factors
6.1 A link between hazards representation and the personal experience
The survey stresses the disparity between discussions on coastline recession and discussions on coastal flooding, which is the main topic of debates subject between stakeholders. The coastline recession method of characterisation, which is simpler, and the small size of areas in recession, may explain this result. It may also be explained by erosion visible tracks on the territory, because of progressive coastline recession. The extrapolation of historical observations makes the fact
that the mapped hazard comes true plausible29. The knowledge of historical events is probably the best flooding risk awareness because of their strong impact on flooding representation on a territory. The historical analysis stage is useful to connect hazards to territory history, or to the personal experience of the stakeholders [16, 44]. The ignorance of these events or the coastal flooding rarity thanks to protection structures are inversely additional obstacles for stakeholders to get a low-probability hazard representation. The historical analysis, and more generally the coastal hydro-sedimentary functioning analysis [45, 46] makes visible local information and crosses territorial data and knowledge. This analysis allows notably to confront all stakeholders knowledge, common knowledge, linked to a familiarity with the territory, and expert knowledge, which is theoretical and applied to the territory during the study. The local knowledge supplies this application and validates the theoretical analysis. If the quality of the study depends on these discussions, a similar hazards perception of the all stakeholders and the appropriation of the study results also depend on it. We thus understand all the importance of this phase which is useful, beyond technical aspects, to defuse some future difficulties linked to hazards and risks perception.
6.2 Partly predictable difficulties
The difficulties level is more predictable than the hazards maps final acceptance because numerous means allow to reach a maps acceptance, and in some cases a consensus30, despite encountered difficulties. The correlations analysis has shown that the territorial planning and the development context allow a first estimation of potential difficulties. The coastal geographical and physical context is useful to complete this estimation analysing the complexity of phenomena which must be take into account during hazards characterisation. This second analysis is mostly done during the coastal hydro-sedimentary functioning analysis, which defines the more appropriate methodology to map hazards.
6.3 Little discussed risk prevention principles
To reach a consensus about hazards maps necessitates the adherence of all stakeholders to a same acceptable risk threshold, that is to say an agreement about the State doctrine which is translated by the definition principles of « reference hazard ». The acceptable risk threshold however remains an « ambiguous » notion [11] but only debates may reflect an adherence to a same risk threshold. « The risk policy [must] be criticised, 29 According to the meaning given by Goutx and Narcy [43].
30 Consensus is defined here as a general stabilised and unanimous agreement, obtained after a discussion process between stakeholders, allowing to overcome potential blockages.
discussed, confirmed by the concerned population, in a word “appropriated” » [12]. The adherence of stakeholders to the risk prevention doctrine can’t be checked with a lack of discussion, particularly frequent when the constraints imposed by the PPRL are low. It is surprising to observe that doctrine principles and conventions are little directly debated. Tense discussions during the hazards mapping process not concerning the hazard characterisation method or, on the contrary, discussions searching for knowledge limits and controversies in order to unsettle purposed hypothesis could be the clue of an adherence absence.
6.4 A knowledge stabilisation thanks to a technical debate
A technical debate on hazards maps allows an appropriate local implementation of scientific knowledge, in addition to a discussion of prevention policy. A satisfactory hazards map is compatible with local knowledge which is useful to improve it. Mapping process is iterative, supplied by stakeholders remarks, their studies, data... This technical debate is based on a capacity to create a favourable discussion space leading to constructive exchanges. To obtain this discussion space is however not simple. It demands a dialogue management know-how. It is not always easy to theorise and identify what is useful to get it. It is often easier to identify errors to avoid: to keep a technical credibility, not give the impression of a “false” dialogue... To obtain this discussion space, the natural coastal phenomena analysis allows the initiation of discussions, the establishment of a common language. This discussions are free from major issues since anterior to the start of hazards mapping process. An exchange process begins allowing to mix in a unique place the local and expert knowledge. This « translation » process [47-49] stabilises knowledge. These technical discussions continue during the mapping process according to the implemented exchange process. The discussions are however not simple and could be conflictual. This debate31 is necessary to reach a stable consensus about the study results and territorial hazards representations.
7 References
1.
Gerin S., Laganier R. and Nussbaum, R. (2012). Le PPRN : d’un objectif de moyens à un objectif de résultats. Risques, études et observatoires (Riseo), Vol. 2012-2, pp. 38-68.2.
Martin B., Ansel R., and Guerrouah O. (2010). Territorialisation ou déterritorialisation du risque ? Analyse comparative et critique de la procédure de réalisation des PPRNP. Riseo : risques études et observations, Vol. 2010-1, pp. 83-98.3.
Gérin S., Laganier R. and Nussbaum R. (2010). Evaluation de la pertinence de la couverture des 31 « no consensus without conflict, no conflict without consensus » (Barel 1981)Plans de Prévention des Risques Naturels Inondations (PPRNI). Etudes foncières, No 144, pp.16–22.
4.
CETMEF, CETE Méditerranée and CETE de l’Ouest. (2012). Vulnérabilité du territoire national aux risques littoraux. France métropolitaine. 170 p.5.
Beucher S. (2007). Le risque d’inondation dans le Val-de-Marne : une territorialisation impossible ? Annales de Géographie, Vol. 5, No 657, pp. 470– 492.6.
Hubert G. and Reliant C. (2003). Cartographie réglementaire du risque d’inondation : Décision autoritaire ou négociée ? Annales des Ponts et Chaussées, No 105, pp. 24–31.7.
Beucher S. and Rode S. (2009). L’aménagement des territoires face aux inondations : regard croisés sur la Loire moyenne et le Val-de-Marne. Mappemonde. Vol. 94-2.8.
Bayet C. and Le Bourhis J.-P. (2000). Le zonage comme instrument de gouvernement le cas des risques naturels. Annales des Ponts et Chaussées, No 93, pp. 52–58.9.
Pottier N., Hubert G. and Reliant, C. (2003). Quelle efficacité de la prévention réglementaire dans les zones inondables ? Eléments d’évaluation. Annales des Ponts et Chaussées, No 105, pp. 14–23.10.
Barraqué B. (1994). Risque d’inondation : Urbanisme réglementaire ou servitude négociée ? Espaces et sociétés, No 77, pp. 133–152.11.
Decrop G., Dourlens C. and Vidal-Naquet P.-A. (1997). Les scènes locales de risque. Rapport de recherche, CERPE-Futur Antérieur, Lyon, 235 p.12.
Bayet C. (2000). Comment mettre le risque en carte ? L’évolution de l’articulation entre science et politique dans la cartographie des risques naturels. Politix, Vol. 13, No 50, pp. 129–150.13.
Blanchi R., Robert F. and Guarnieri F. (2003). Première analyse du contenu et de la qualité des Plans de Prévention des Risques Naturels (PPR). D’une complexité originelle à une pluralité fonctionnelle. Annales des Mines, pp. 61–69.14.
Pottier N., Reliant C., Hubert G. and Veyret Y. (2003). Les plans de prévention des risques naturels à l’épreuve du temps : Prouesses et déboires d’une procédure réglementaire. Annales des ponts et chaussées, No 105, pp. 40–48.15.
Pottier N., Veyret Y., Meschinet de Richemond N., Hubert G., Reliant C. and Duboismaury, J. (2004). Evaluation de la politique publique de prévention des risques naturels. Risques naturels et aménagement en Europe, pp. 46–67.16.
Dupont N. (2005). Le rôle des documents cartographiques dans l’appropriation du risque d’inondation. Exemple des communes périphériques de Rennes. Les risques climatiques, Belin sup. Géographie, pp. 175–191.17.
Le Bourhis J.-P. (2007). Du savoir cartographique au pouvoir bureaucratique. La politique des risques en France 1970 - 2000. Genèses, Vol. 2007/03, No 68, pp. 75–96.18.
Pigeon P. (2007). Les plans de prévention des risques (PPR) : essai d’interprétation géographique. Géocarrefour, Vol. 82, No 1-2, pp. 27–34.19.
Tricot A. and Labussiere, O. (2009). Les difficultés d’application des plans de prévention en France : lorsque le territoire façonne le risque. Cahiers de géographie du Québec, Vol. 53, No 148, pp. 119– 134.20.
Vinet F. (2010). Le risque inondation. Diagnostic et gestion. Éd. Tec & doc, Paris.21.
Douvinet J. and Denolle A.-S. (2010). Les marges de manœuvre des maires face à l’application des Plans de Prévention du Risque Inondation. Risques, études et observatoires (Riseo), Vol. 2010-1, pp. 41–55.22.
Meschinet de Richemond N. and Reghezza M. (2010). La gestion du risque en France : contre ou avec le territoire ? Annales de géographies, 2010/3, No 673, pp. 248–267.23.
Dupont N. (2010). Les documents cartographiques dans le cadre des PPRI : Analyse critique. Risques, études et observatoires (Riseo), Vol. 2010-1, pp. 56– 64.24.
Jacquinod F. and Langumier J. (2011). Géovisualisations 3D en action dans l’aménagement du territoire. Géocarrefour, Vol. 85, No 4, pp. 303– 311.25.
Chauveau E., Chadenas C., Comentale B., Pottier P., Blanlœil A., Feuillet T., Mercier D., Pourinet L., Rollo N., Tillier I. and Trouillet B. (2011). Xynthia : leçons d’une catastrophe. Cybergeo : European Journal of Geography, Environnement, Nature, Paysage, document 538.26.
Reghezza-Zitt M. and Sanseverino-Godfrin V. (2012). Aménagement durable des territoires soumis à de fortes contraintes : enjeux et perspectives à travers l’examen des outils juridiques. L’exemple de la basse vallée du Var (06). Annales de Géographie, Vol. 2012/3, No 685, pp. 242–265.27.
Pottier N., Penning-Roswell E., Tunstall S. and Hubert G. (2004). Land use and flood protection: contrasting approaches and outcomes in France and in England and Wales. Applied Geography, Vol. 25, No 1, pp. 1-27.28.
Greiving S., Fleischhauer M. and Wanczura S. (2006). Management of natural hazards in Europe: The role of spatial planning in selected EU members states, Journal of Environmental Planning and Management, Vol. 49, No 5, pp. 739-757.29.
Fleischhauer M., Greiving S., Flex F., Scheibel M., Stickler T., Sereining N., Koboltschnig G., Malvati P., Vitale V., Grifoni P. and Firus K. (2012). Improving the active involvement of stakeholders and the public in flood risk management – tools ofan involvement strategy and case study results from Austria, Germany and Italy, Natural Hazards and Earth System Science, Vol. 12, No 9, pp. 2785-2798.
30.
Berke P. R., Roenink D. J., Kaiser E. J. and Burby R. (1996). Enhancing plan quality: Evaluating the role of state planning mandates for natural hazard mitigation. Journal of Environmental Planning and Management, Vol. 39, No 1, pp. 79-96.31.
Brody S. D. (2003). Are we learning to mke better plans? A Longitudinal analysis of plan quality associated with natural hazards. Journal of Planning Education and Research, Vol. 23, No 2, pp. 191-201.32.
Lyles L. W., Berke P. and Smith G. (2014) Do planners matter? Examining factors driving incorporation of land use approaches into hazard mitigation plans, Journal of Environmental Planning and Management, Vol. 57, No 5, pp. 792-811.33.
Arnaud A. (2015). Les limites de la cartographie des risques littoraux : des perspectives pour la compréhension de tous. VertigO, Hors-série 21.34.
Gendreau N., Grelot F., Garçon R. and Duband D. (2003). Risque d’inondation : une notion probabiliste complexe pour le citoyen. Ingénieries-EAT, No 34, pp. 17-24.35.
Barel Y. (1981). Modernité, code, territoire. Annales de la recherche urbaine, No 10/11, pp. 3–21.36.
Erne-Heintz V. (2012). Penser le risque résiduel : l’improbable catastrophe. Risques, études et observatoires (Riseo), Vol. 2012-3, pp. 15-37. 37. Beuret J. E. and Cadoret A. (2012). Retourd'expériences sur la concertation vue par les acteurs environnementaux et les élus locaux, rapport final. Rapport ADEME, 188 p.
38.
Mauroux A. (2015). Exposition aux risques catastrophiques, politiques de prévention et marchés de l’immobilier en France - État de la connaissance en économie. Etudes et documents, No 134, CGDD.39.
CGDD/SOeS. (2009). Fiche Occupation du sol en 2006 et artificialisation depuis 2000 en fonction de la distance à la mer. Observatoire national de la mer et du littoral, <http://www.onml.fr/onml_f/Occupation- du-sol-en-2006-et-artificialisation-depuis-2000-en-fonction-de-la-distance-a-la-mer>.40.
Hellequin A.-P., Flanquart H., Meur-Ferec C. and Rulleau B. (2013). Perceptions du risque de submersion marine par la population du littoral languedocien : contribution à l’analyse de la vulnérabilité côtière. Natures Sciences Sociétés, Vol. 21, No 4, pp. 385–399.41.
Narcy J.-B. (2004). Pour une gestion spatiale de l’eau : comment sortir du tuyau ? Ecopolis, Peter Lang, Bruxelles, 342 p..42.
Callon M. and Rip A. (1992). Humains, non-humains: morale d’une coexistence. La Terre outragée. Les experts sont formels !, Autrement, Paris, pp. 140–156.43.
Goutx D. and Narcy J.-B. (2013). La place des modèles numériques dans la prise de conscience locale des risques d’inondations : simulations ou stimulations ? La Houille Blanche, Vol. 2013-1, pp. 27–33.44. Vinet F. (2007). Approche institutionnelle et contraintes locales de la gestion du risque. Recherches sur le risque inondation en Languedoc-Roussillon. HDR Université de Montpellier III., 270p.